
Prometheus
Send data to Last9 using Prometheus Remote Write
We make use of the Prometheus remote-write feature to allow Prometheus to write to an external remote endpoint i.e., Last9’s remote-write endpoint.
Prerequisites
Create a Last9 cluster by following Getting Started.
Keep the following information handy after creating the cluster:
$levitate_remote_write_url- Last9’s Remote write endpoint$levitate_remote_write_username- Cluster ID$levitate_remote_write_password- Write token created for the cluster
Writing data to Last9
The information flow is as follows:
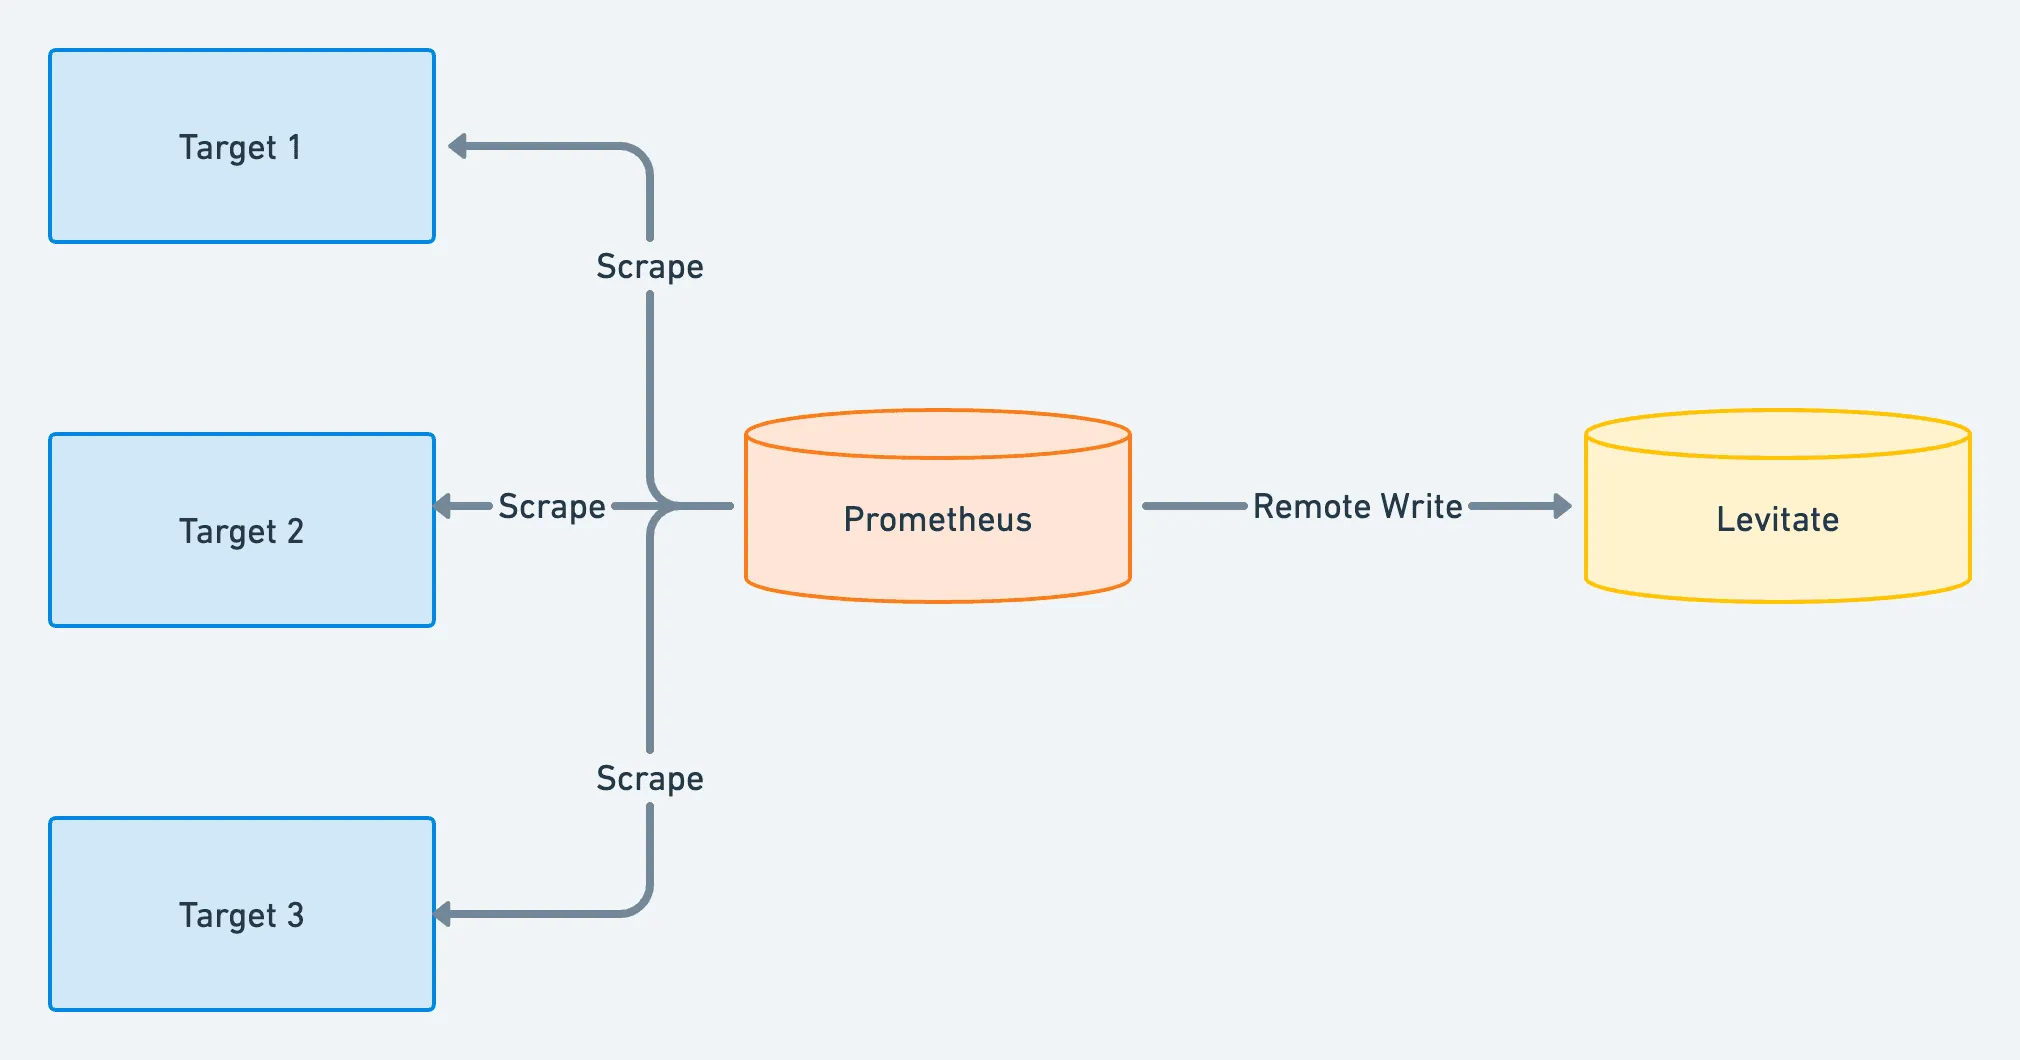
Just update the Prometheus configuration with the following changes for theremote_write:
remote_write: - url: "$remote_write_url" basic_auth: username: "$remote_write_username" password: "$remote_write_password" remote_timeout: 60sAfter that, restart Prometheus, and data will be written to Last9.
Using Prometheus Agent mode
With Last9 as Long-term storage, you don’t need to store time series in your Prometheus. You can run Prometheus only in agent mode and stream data directly to Last9.
The agent mode is limited to discovery, scrape, and remote write, which fits our needs nicely.
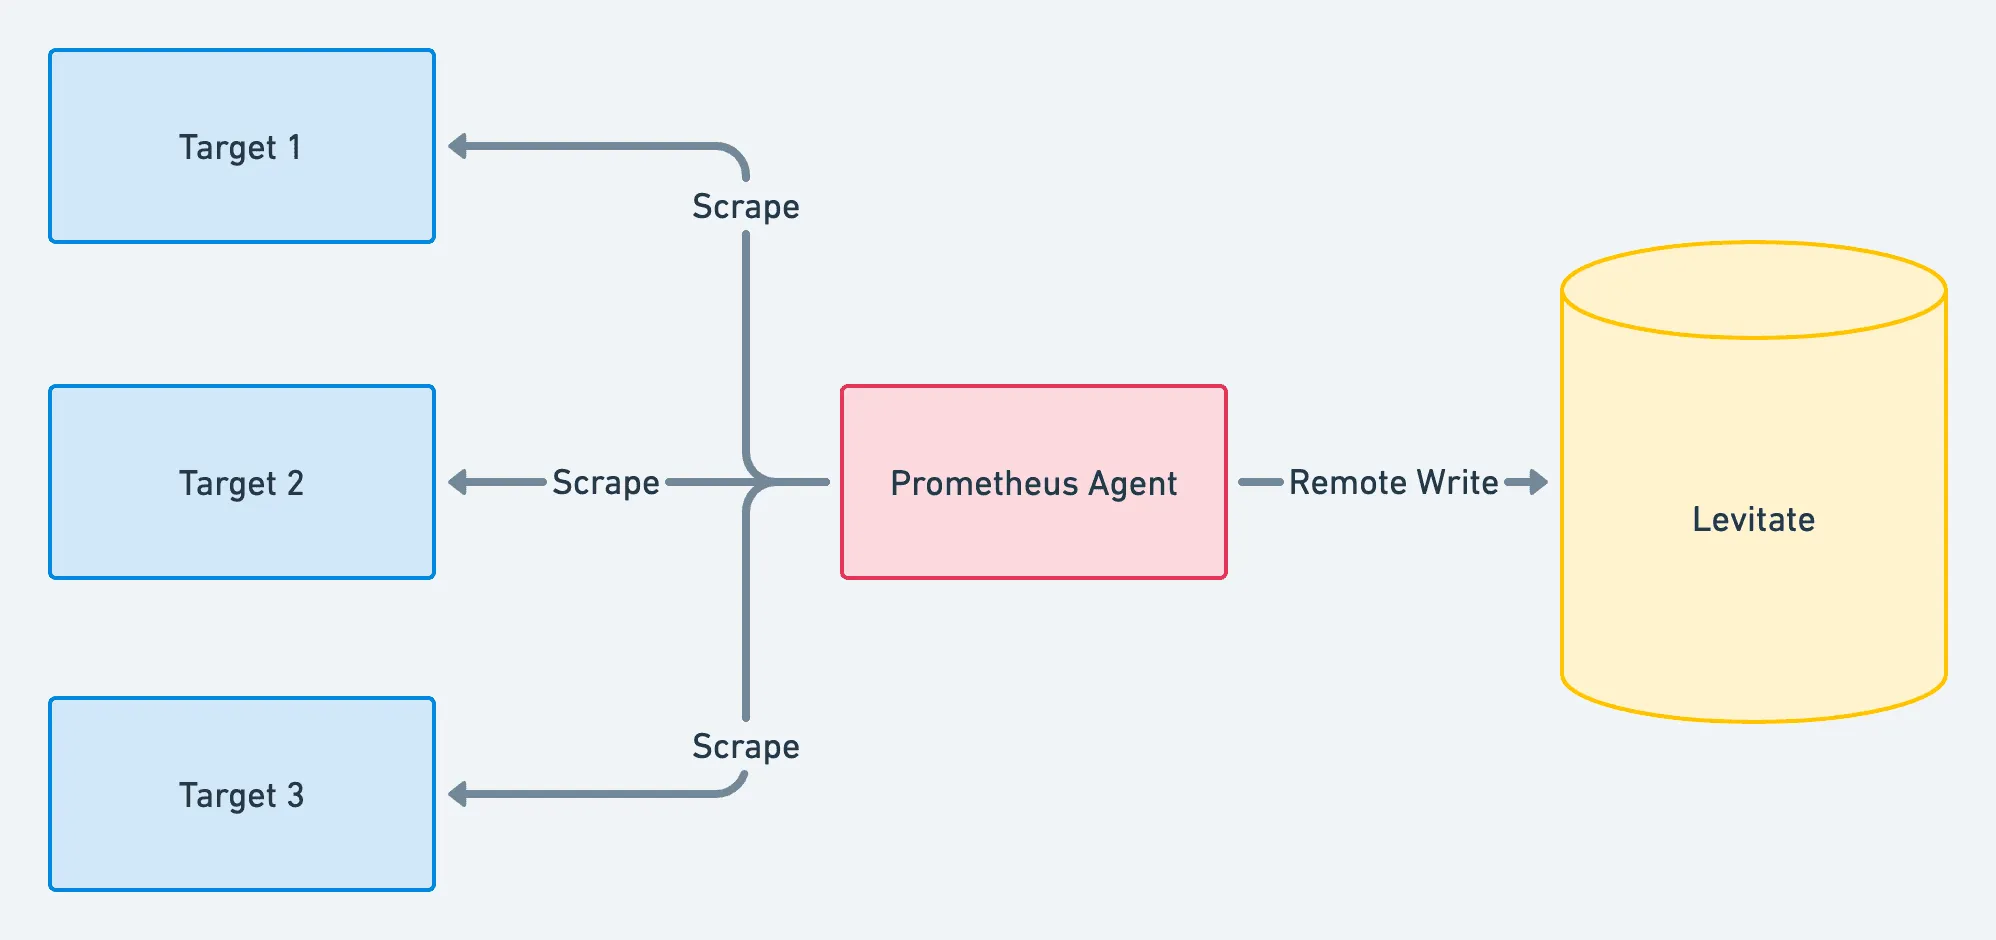
You don’t need to have the overhead of running full-fledged Prometheus anymore.
Here is a sample docker-compose.yaml that runs Prometheus in agent mode.
services: prometheus: container_name: prometheus-01 image: prom/prometheus:v2.39.1 ports: - 9091:9090/tcp volumes: - ./prometheus.yaml:/etc/prometheus/prometheus.yaml command: - "--config.file=/etc/prometheus/prometheus.yaml" - "--enable-feature=agent" network_mode: host restart: alwaysThe prometheus.yaml will need to have remote_writesection as follows:
global:  scrape_interval: 1m  scrape_timeout: 30s
scrape_configs:  - job_name: prometheus-self    static_configs:      - targets: ["127.0.0.1:9090"]
remote_write:  - url: "$remote_write_url"    basic_auth:      username: "$remote_write_username"      password: "$remote_write_password"    remote_timeout: 60s
Verification
The Last9 Cluster will start showing a summary of ingested samples.

Reading data from Last9
Last9 provides a Prometheus-compatible read endpoint that implements the Prometheus HTTP API, allowing you to query metrics stored in Last9 using standard PromQL queries.
Prometheus-Compatible Query API
Each Last9 Cluster comes with a Read URL that supports the full Prometheus HTTP API:
- Instant Queries:
/api/v1/query- Query metrics at a specific point in time - Range Queries:
/api/v1/query_range- Query metrics over a time range - Labels API: Full support for Prometheus label queries
- Metadata API: Query metric metadata and series information
This means you can:
- Use any Prometheus-compatible tool or library to query Last9
- Execute PromQL queries directly via HTTP
- Integrate Last9 with visualization tools like Grafana
- Use Prometheus client libraries to read data programmatically
Authentication
The read endpoint requires authentication using HTTP Basic Auth:
- Username: Your Last9 Cluster ID
- Password: A Read Token generated for your cluster
You can find your Read URL in: Cluster → Settings → Read Data → Bring Your Own Visualization
For detailed examples and complete API documentation, see our guide on Querying Last9 using HTTP API.
Next steps
Create a read token for your Last9 Cluster and follow our guide to Configure Grafana to visualize the time series data getting sent to Last9.
You can also query Last9 directly using the Prometheus-compatible HTTP API for programmatic access to your metrics.
Scaling Prometheus Remote Write
Read https://last9.io/blog/how-to-scale-prometheus-remote-write/, where we talk about how to scale Prometheus Remote write for Federated clusters, considering High Availability requirements.
Troubleshooting
Please get in touch with us on Discord or Email if you have any questions.