Logs Explorer
Use Last9's native UI for logs with first-class search and filters — quickly view related logs, traces, and metrics by clicking on any log line.
Using Logs Explorer
You can start exploring logs by visiting Logs Explorer in Last9. The Log Explorer allows to filter logs by specific log attributes and resource info to slice and dice by various log dimensions, and view correlated telemetry.
Builder Mode

Last9 provides a native experience to explore your logs without using any query language.
- Search:
- With auto-complete support,
service,severity, andbodyare first-class attributes - Supported operators are
equal,not equal,contains, anddoes not contain - Edit the same attribute chip to add multiple values
- With auto-complete support,
- Filters: Apart from severity and service, attributes and resources from the log lines in the selected time window are also listed. Click on
onlyorallnext to a filter item for quick actions. - Live Tail: A live stream of logs matching any filters, if applied. Useful to debug any instant changes to while deploying, etc. We recommened applying filters to narrow the scope of the Live Tail, which also helps improve the overall performance.
- Time Picker: Select an absolute or relative time range. You can also type shorthands like
1hor30mdirectly, or switch between timezones. See Time Range Picker for details. - Volume Chart: A stacked bar chart for the selected time window, color-coded to severity of the log lines.
- Toggle Columns: Click on the settings icon on the top right of the table to add dynamic columns based on log attributes.
Editor Mode

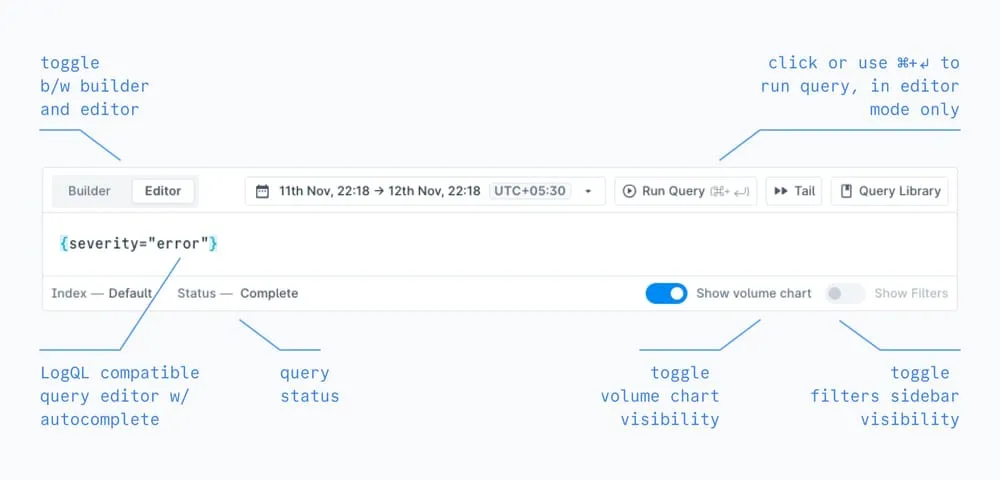
You can write complex queries, with aggregations, that are LogQL-compatible using the Editor mode.
- LogQL auto-completion is supported. Auto-complete for aggregation functions is WIP.
- Aggregation queries are visualized as timeseries instead of as a volume bar chart.
- Switching from Builder to Editor will convert any existing search to LogQL, but not vice versa.
- Queries in Editor mode are not auto-run. Please click on the Run Query button or use the
⌘/Ctrl + Enterkeyboard shortcut.
Read more about LogQL compatibility and supported functions.
Log Details

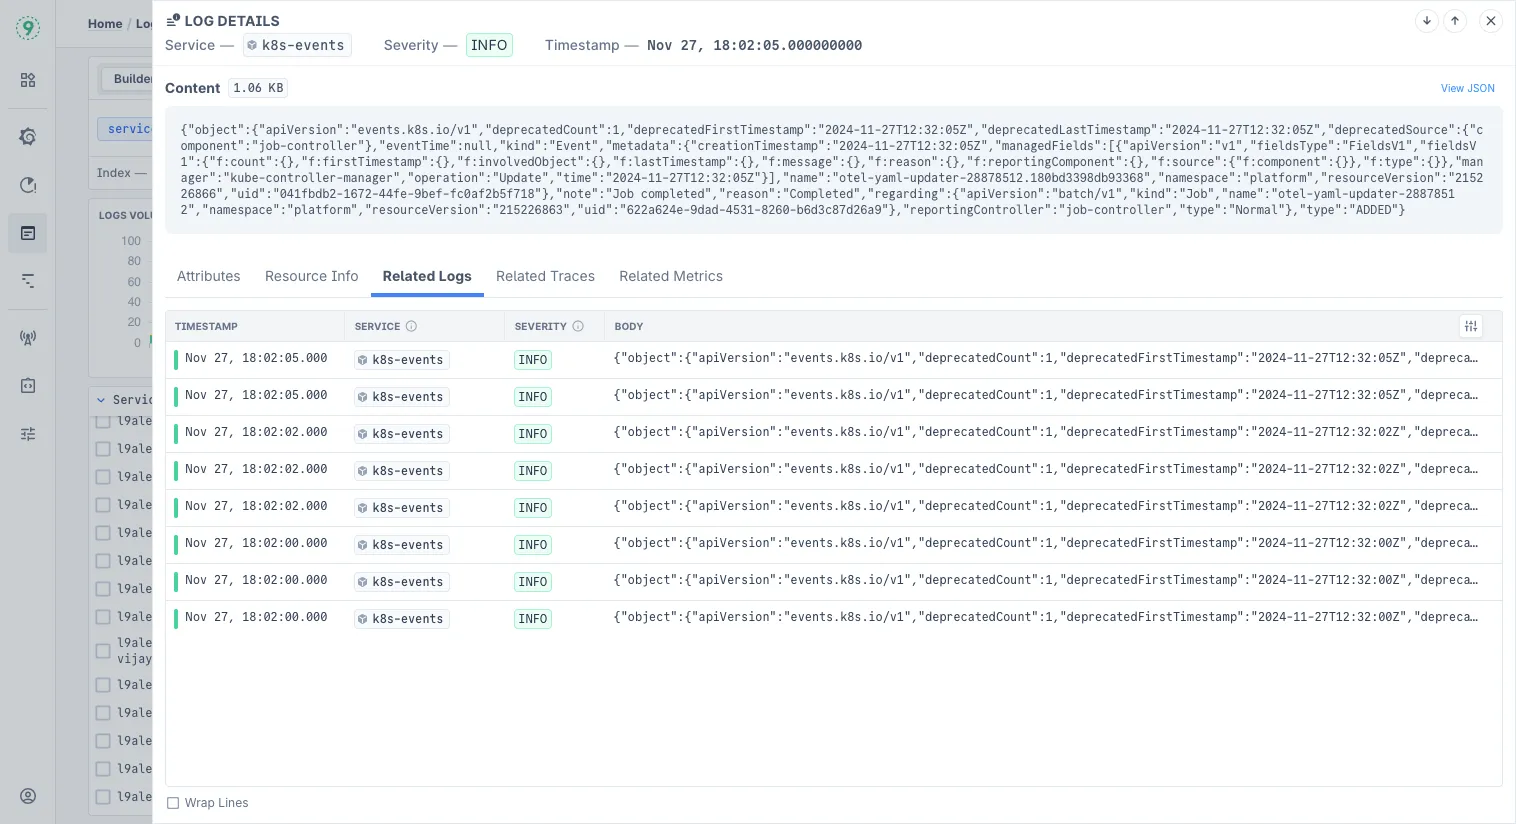
Clicking on a log line in Logs Explorer opens a side panel with additional context and information about the selected log line.
- Content, with payload size and option to view as raw or JSON
- Attributes of the selected log line
- Resource Info of the selected log line
- Related Logs, surrounding log lines for context — see details below
- Related Traces, based on the service and other attributes of the selected log line
- Related Metrics, visualizing CPU and memory utilization of the relevant container, instance, and pod resources
Creating Alerts from Queries
You can turn any log query into an alert using Scheduled Search. After running a query:
- Click on
⋮> “Save Query” in the top right - Enter a descriptive name for your query
- Click “Save query & add alert”
- Configure your alert threshold, evaluation frequency, and notification channel
Learn more about Scheduled Search →
Related Logs
The Related Logs tab shows surrounding log lines from the same service, providing context for debugging and investigation. When you open this tab, the table automatically scrolls to the highlighted log line with a visual indicator.

Context Range
Select how many log lines to display before and after the highlighted log:
| Option | Description |
|---|---|
| ±20 | Default. Shows 20 lines before and after the selected log |
| ±50 | Shows 50 lines before and after |
| ±100 | Shows 100 lines before and after |
| Custom | Set different values for before and after (up to 1000 lines each) |
Timestamp Display
Toggle between timestamp modes using the icons in the controls bar:
| Mode | Icon | Description |
|---|---|---|
| Relative | Timer | Shows time offset from the highlighted line (e.g., -2s, +500ms) |
| Absolute | Calendar | Shows the full timestamp for each log line |
Relative timestamps make it easier to understand the sequence and timing of events around the selected log.
Display Controls
| Control | Description |
|---|---|
| Wrap Lines | Wraps long log messages to fit the panel width for easier reading |
| Show Attributes | Displays log attributes (like severity, trace ID) alongside the message |
Exporting Related Logs
You can download related logs as a CSV file for offline analysis or sharing with your team. Click the Download button in the controls bar to access export options:
| Export Option | Description |
|---|---|
| Export All | Downloads all available log fields, regardless of column visibility |
| Export Visible | Downloads only the columns currently visible in the table |
The downloaded CSV file is automatically named with the selected log’s timestamp and the time range of related logs for easy identification (e.g., Related Logs for 2026-02-13 10:30:45 UTC - 10:30:25 UTC to 10:30:55 UTC.csv).
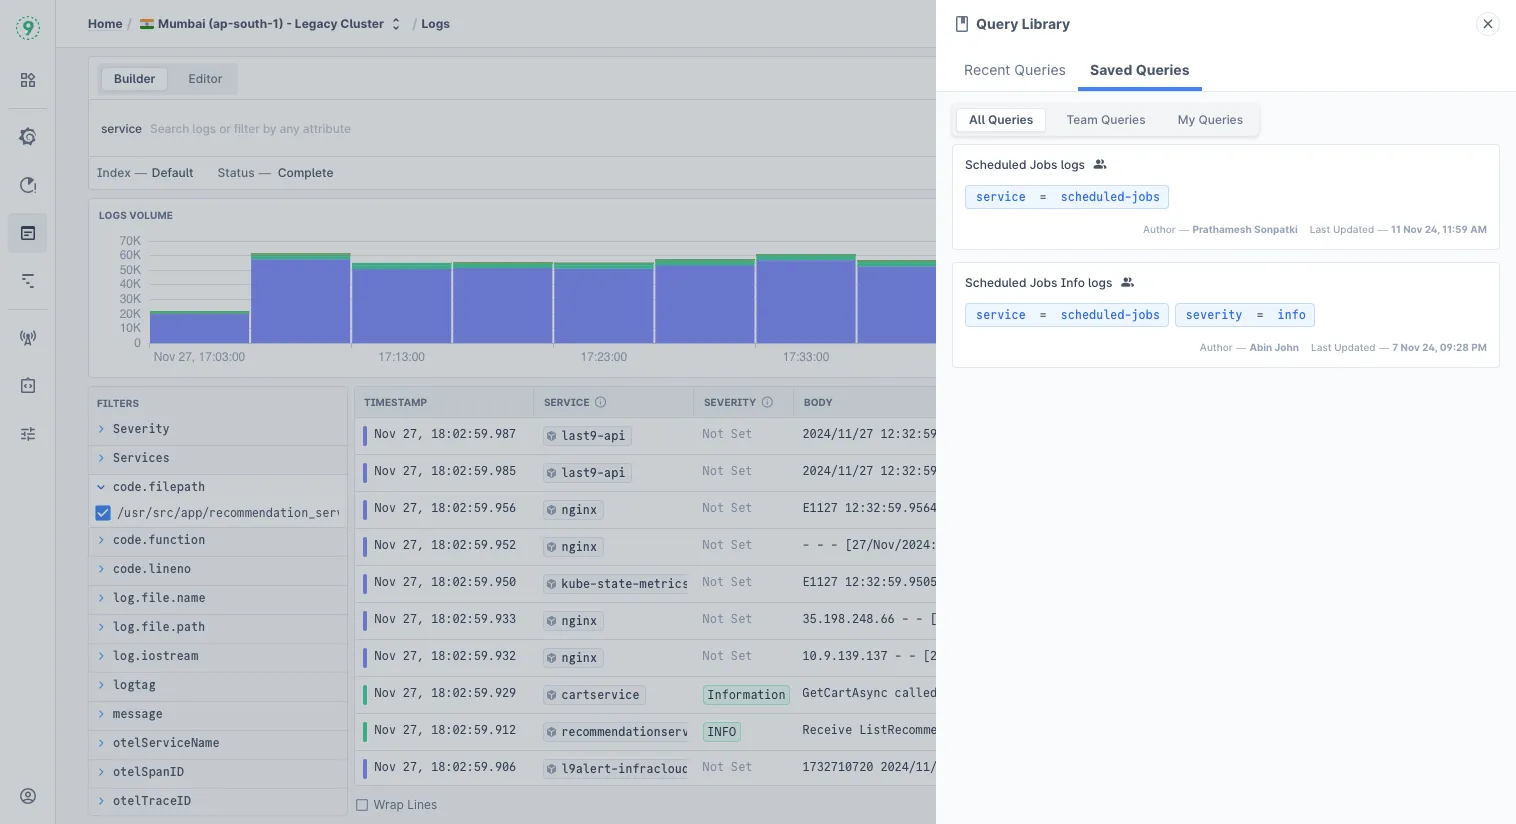
Query Library

- Recent Queries: This is a history of queries made by you.
- Saved Queries: This is a list of queries saved by your team or you. Queries can be shared with the team or be kept private.
Troubleshooting
Please get in touch with us on Discord or Email if you have any questions.