
Ruby on Rails
Send distributed traces to Last9 from a Ruby on Rails app using OpenTelemetry
Ruby on Rails is a server-side web application framework written in Ruby. This comprehensive guide will help you instrument your Ruby on Rails application with OpenTelemetry and smoothly send the traces to a Last9 cluster. You can also check out the example application on GitHub↗.
Pre-requisites
- You have a Ruby on Rails application.
- You have signed up for Last9, created a cluster, and obtained the following OTLP credentials from the Integrations page:
endpointauth_header
Install OpenTelemetry packages
To install the required packages, add the following lines to your Gemfile:
gem 'opentelemetry-sdk'gem 'opentelemetry-exporter-otlp'gem 'opentelemetry-instrumentation-all'
gem 'dotenv-rails', groups: [:development, :test]
Then, run the following command to install the packages:
bundle installSet the environment variables
Create a .env file in the root directory of your application and add the following environment variables:
OTEL_SERVICE_NAME=ruby-on-rails-api-serviceOTEL_EXPORTER_OTLP_ENDPOINT=<ENDPOINT>OTEL_EXPORTER_OTLP_HEADERS="Authorization=Basic <BASIC_AUTH_HEADER>"OTEL_TRACES_EXPORTER=otlpNote: Replace
<BASIC_AUTH_HEADER>with the URL encoded value of the basic auth header.
Instrument your application
In config/initializers/opentelemetry.rb, add the following code to instrument your application:
require 'opentelemetry/sdk'require 'opentelemetry/exporter/otlp'require 'opentelemetry/instrumentation/all'
# Exporter and Processor configurationotel_exporter = OpenTelemetry::Exporter::OTLP::Exporter.newprocessor = OpenTelemetry::SDK::Trace::Export::BatchSpanProcessor.new(otel_exporter)
OpenTelemetry::SDK.configure do |c|  # Exporter and Processor configuration  c.add_span_processor(processor) # Created above this SDK.configure block
  # Resource configuration  c.resource = OpenTelemetry::SDK::Resources::Resource.create({    OpenTelemetry::SemanticConventions::Resource::SERVICE_NAME => 'ruby-on-rails-api-service',    OpenTelemetry::SemanticConventions::Resource::SERVICE_VERSION => "0.0.0",    OpenTelemetry::SemanticConventions::Resource::DEPLOYMENT_ENVIRONMENT => Rails.env.to_s  })
  c.use_all() # enables all instrumentation!end
This code snippet configures the OpenTelemetry SDK to use the OTLP exporter and enables instrumentation for all standard components of a Rails application.
Run the application
Start your Ruby on Rails application by running the following command:
bin/rails serverVisualize data
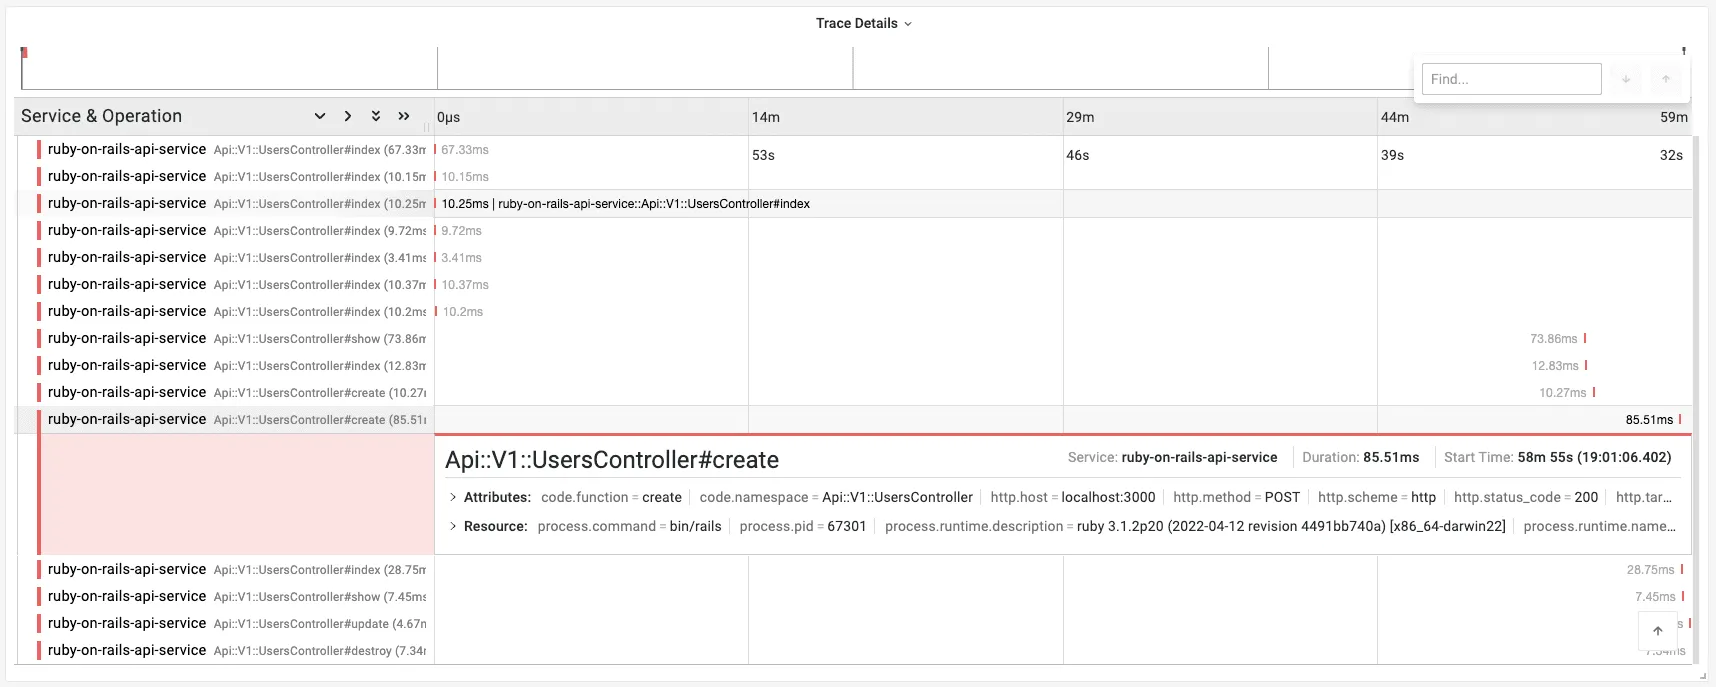
After running the Ruby on Rails app, you can visualize the traces in the Last9’s APM dashboard.
Log-Trace Correlation
Correlating logs with traces helps you debug production issues by linking log entries to their corresponding distributed traces in Last9’s APM dashboard. This integration shows you how to add OpenTelemetry trace IDs and span IDs to your Rails application logs.
How It Works
OpenTelemetry provides the current trace context through OpenTelemetry::Trace.current_span.context. You can extract trace_id and span_id from this context and add them to your log entries. Last9 will automatically correlate these logs with traces when both share the same trace ID.
Implementation Examples
Choose the integration that matches your logging setup:
Rails Logger (Default)
Add trace context to Rails’ default logger:
# config/initializers/logging.rbmodule LogTraceCorrelation  def add(severity, message = nil, progname = nil)    if block_given?      super(severity, progname) do        span = OpenTelemetry::Trace.current_span        context = span.context        "trace_id=#{context.hex_trace_id} span_id=#{context.hex_span_id} #{yield}"      end    else      span = OpenTelemetry::Trace.current_span      context = span.context      super(severity, "trace_id=#{context.hex_trace_id} span_id=#{context.hex_span_id} #{message}", progname)    end  endend
Rails.logger.extend(LogTraceCorrelation)
Example output:
trace_id=4bf92f3577b34da6a3ce929d0e0e4736 span_id=00f067aa0ba902b7 User login successfulLograge (Structured Logging)
If you’re using Lograge for structured logs:
# config/initializers/lograge.rbRails.application.configure do config.lograge.enabled = true config.lograge.custom_options = lambda do |event| span = OpenTelemetry::Trace.current_span context = span.context { trace_id: context.hex_trace_id, span_id: context.hex_span_id, host: event.payload[:host], params: event.payload[:params].except('controller', 'action') } endendExample output:
{ "method": "GET", "path": "/api/users/123", "status": 200, "duration": 145.23, "trace_id": "4bf92f3577b34da6a3ce929d0e0e4736", "span_id": "00f067aa0ba902b7"}Semantic Logger
For Semantic Logger:
# config/initializers/semantic_logger.rbRails.application.configure do  config.semantic_logger.add_file_appender = true  config.rails_semantic_logger.add_file_appender = true
  # Add trace context to all log entries  SemanticLogger.on_log do |log|    span = OpenTelemetry::Trace.current_span    context = span.context    log.named_tags[:trace_id] = context.hex_trace_id    log.named_tags[:span_id] = context.hex_span_id  endend
Custom JSON Formatter
For applications using JSON-formatted logs:
# config/initializers/logging.rbclass JSONLogFormatter < Logger::Formatter  def call(severity, timestamp, progname, msg)    span = OpenTelemetry::Trace.current_span    context = span.context
    log_entry = {      timestamp: timestamp.utc.iso8601,      level: severity,      message: msg,      trace_id: context.hex_trace_id,      span_id: context.hex_span_id    }
    "#{log_entry.to_json}\n"  endend
Rails.logger.formatter = JSONLogFormatter.new
Example output:
{ "timestamp": "2024-01-15T10:30:45Z", "level": "INFO", "message": "User login successful", "trace_id": "4bf92f3577b34da6a3ce929d0e0e4736", "span_id": "00f067aa0ba902b7"}Viewing Correlated Logs in Last9
Once configured, your logs will appear in Last9’s APM dashboard alongside their corresponding traces. You can:
- Click on any trace span to see related logs
- Click on any log entry to jump to its trace
- Filter logs by trace ID to see the complete request flow
Troubleshooting
Please get in touch with us on Discord or Email if you have any questions.