
Discover Kubernetes
Monitor Kubernetes clusters, deployments, and pods with comprehensive resource utilization and performance tracking
The Kubernetes feature in Discover provides comprehensive monitoring for your Kubernetes infrastructure, delivering real-time visibility into cluster health, resource utilization, and workload performance. Monitor deployments, pods, and individual containers with detailed metrics for CPU, memory, network, and storage across your entire Kubernetes environment.
This infrastructure monitoring solution helps you optimize resource allocation, identify performance bottlenecks, and maintain healthy Kubernetes workloads across all environments.
Prerequisites
To monitor your Kubernetes infrastructure with Last9, you need to configure the appropriate data collection integrations:
Required:
- Kubernetes Cluster Monitoring: Core metrics collection for cluster, node, deployment, and pod monitoring. Configure the Kubernetes Cluster Monitoring integration to collect infrastructure metrics.
Optional but Recommended:
- Kubernetes Logs: Application and system logs from pods and containers for troubleshooting context. Set up the Kubernetes Logs integration for comprehensive log collection.
- Kubernetes Events: Cluster events and state changes for operational insights. Enable the Kubernetes Events integration to track pod scheduling, resource constraints, and cluster events.
Without the core Kubernetes Cluster Monitoring integration, the Discover Kubernetes feature will not function. The additional integrations enhance troubleshooting capabilities and provide deeper operational context.
Understanding the Kubernetes Dashboard
Access the Kubernetes dashboard at Discover > Kubernetes in Last9.
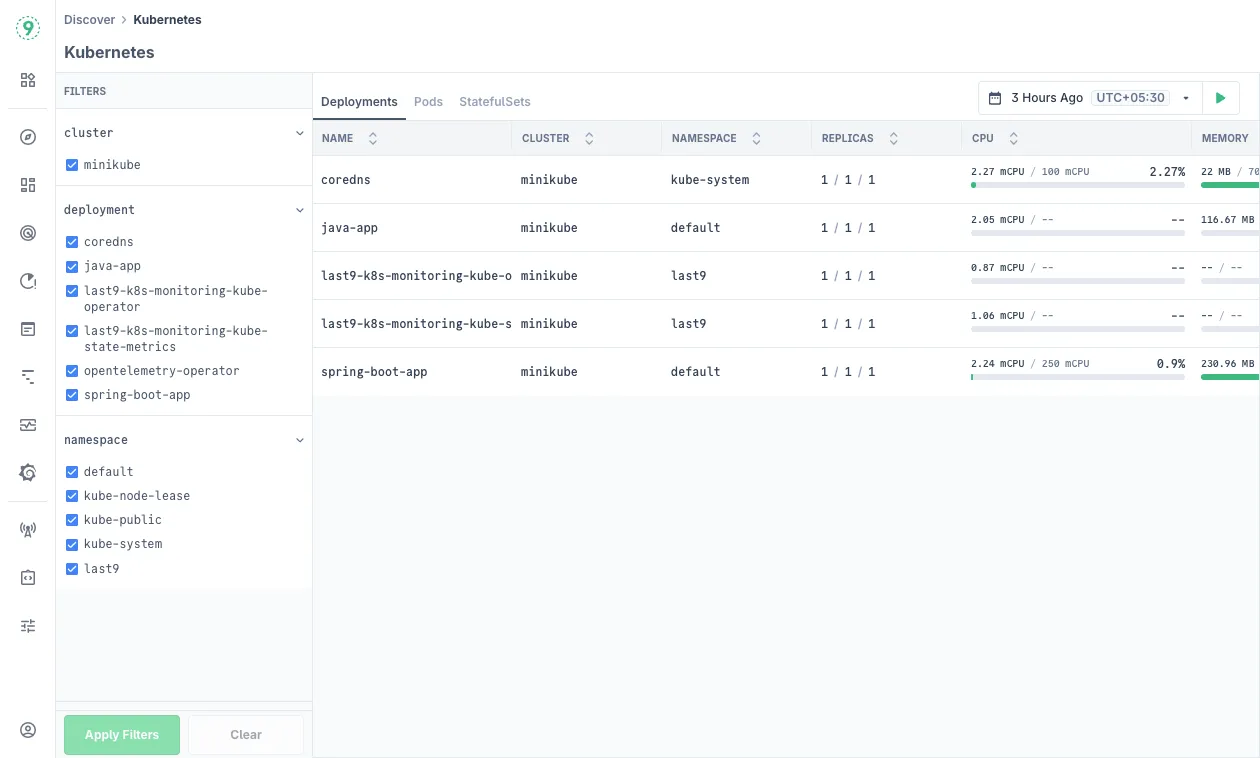
The main dashboard provides two primary views for monitoring your Kubernetes infrastructure:
- Deployments View:
- Name: Deployment name and associated container images
- Cluster: Kubernetes cluster hosting the deployment
- Namespace: Kubernetes namespace organization
- Replicas: Current vs. desired replica count (e.g., 1/1/1 showing current/ready/desired)
- CPU Usage: Current CPU utilization with resource requests and limits
- Memory Usage: Current memory usage with allocated limits
- Pods View:
- Name: Pod identifier with deployment association
- Deployment: Parent deployment name
- Status: Running, Pending, Failed, or other states
- Cluster: Kubernetes cluster location
- Namespace: Kubernetes namespace organization
- Ready/Restarts: Container readiness and restart count
- CPU/Memory: Current resource utilization
Use the left sidebar filters to focus on specific clusters, deployments, or namespaces:
- Select filter categories from the sidebar (Cluster, Deployment, Namespace)
- Choose specific values to narrow your view
- Click Apply Filters to update the display
- Use Clear to reset all applied filters
Analyzing Individual Deployments
Click on any deployment name to access detailed performance monitoring and resource analysis.
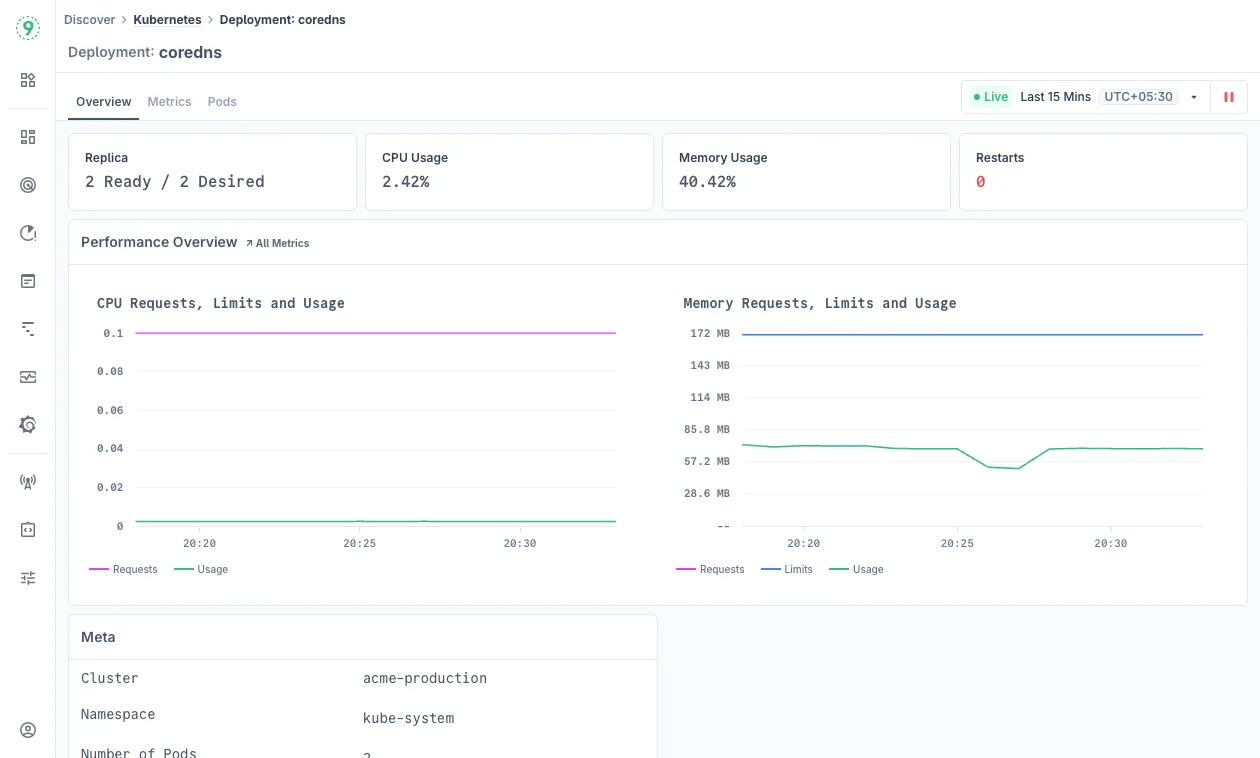
Overview
The deployment detail page provides comprehensive performance dashboards with key operational metrics:
- Performance Summary: View replica health, CPU and memory utilization percentages, and restart count indicators that signal deployment stability.
- Resource Performance Charts: Track CPU and memory allocation efficiency comparing resource requests, limits, and actual usage over time. Click on
All Metricsto view more. - Deployment Metadata: Essential configuration details including cluster, namespace, and pod count for operational context.
Metrics
The Metrics tab offers detailed resource utilization analytics:
- Pod Health Monitoring: Visual timeline showing pod availability and analysis of pod lifecycle events and termination reasons.
- Resource Utilization Analysis: Detailed CPU and memory performance tracking with requests, limits, and usage trends, plus storage performance monitoring for data-intensive applications.
Pods
The Pods tab shows all pods belonging to the specific deployment, filtered from the main dashboard view, with additional performance visualizations:
- Pod Status Timeline: Visual representation of pod health and availability over time
- Pod Termination Breakdown: Analysis of why pods have terminated or restarted
Click on any pod name to open detailed pod analysis in a side panel with the same information available in the individual pod analysis section.
Analyzing Individual Pods
Click on any pod name to examine detailed pod-level performance and resource consumption.
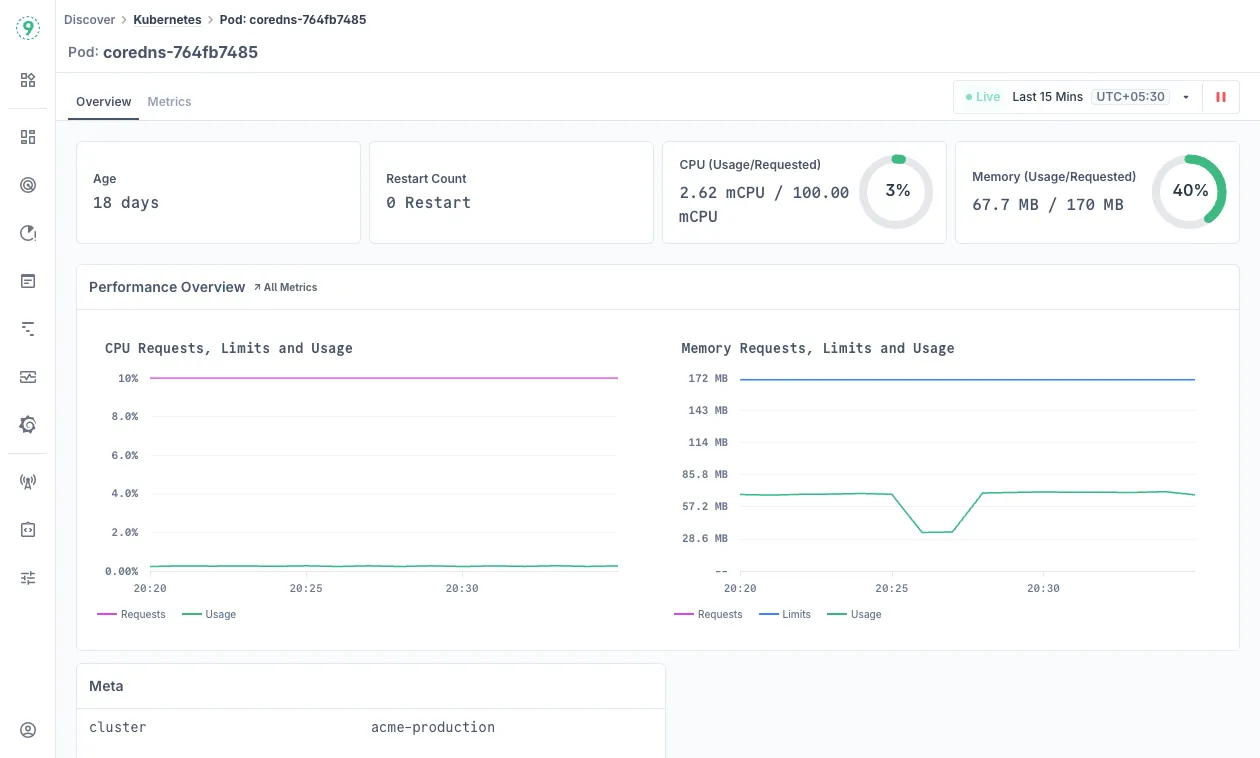
Overview
- Pod Health Summary: Monitor pod uptime, restart frequency, and resource allocation efficiency showing current CPU and memory usage versus requests.
- Resource Performance Charts: Track resource requests, limits, and actual consumption patterns over time for optimization insights. Click on
All Metricsto view more. - Pod Metadata: Configuration details including cluster, namespace, node assignment, pod IP, and parent deployment.
Metrics
- Container Health Analysis: Individual container health patterns, restart analysis, and out-of-memory event detection for resource optimization.
- Resource Performance Monitoring: Per-container CPU and memory consumption, throttling analysis, storage performance, and disk I/O monitoring.
- Network Performance: Pod network performance tracking and connectivity issue detection.
Best Practices
Resource Optimization:
- Monitor the gap between resource requests/limits and actual usage to identify over-provisioned deployments for cost savings
- Use CPU and memory data to right-size allocations and identify containers hitting their limits
- Track CPU throttling patterns and disk I/O bottlenecks for performance tuning
Troubleshooting:
- Track restart counts and OOM events to identify unstable applications
- Use deployment-level monitoring for performance analysis, pod-level for detailed troubleshooting
- Review pod age and restart patterns to identify stability issues
Monitoring Strategy:
- Use namespace filtering to organize by team or application boundaries
- Analyze resource usage patterns for capacity planning and autoscaler configuration
- Monitor resource trends over time to identify gradual performance degradation
Troubleshooting
Please get in touch with us on Discord or Email if you have any questions.