
Discover Jobs
Monitor and analyze background jobs, scheduled tasks, and asynchronous operations across your infrastructure
The Jobs feature in Discover provides comprehensive monitoring for background jobs, scheduled tasks, queue processing, and asynchronous operations across your application infrastructure. Track job execution performance, error rates, processing duration, and queue health to ensure reliable background processing and maintain optimal system performance.
This background job monitoring solution helps you identify processing bottlenecks, monitor queue backlogs, detect failed jobs, and optimize task execution across your entire job processing infrastructure.
Prerequisites
To monitor background jobs and scheduled tasks with Last9, configure the following integrations:
Required:
- Traces: Distributed tracing data is mandatory for job discovery, execution tracking, and operation-level analysis. Configure OpenTelemetry or other tracing instrumentation for your job processing systems. See all traces integrations.
Optional but Recommended:
- Logs: Application and job processing logs provide detailed execution context and error information. Configure log forwarding from your job runners and processing systems. See all logs integrations.
- Infrastructure Metrics: Container and host metrics for job processing infrastructure. Set up Docker, Kubernetes, or cloud monitoring for resource tracking during job execution.
Without traces, the Discover Jobs feature will have limited functionality. Logs and infrastructure metrics enhance troubleshooting capabilities and provide deeper operational context.
Understanding the Jobs Dashboard
Access the Jobs dashboard at Discover > Jobs in Last9.
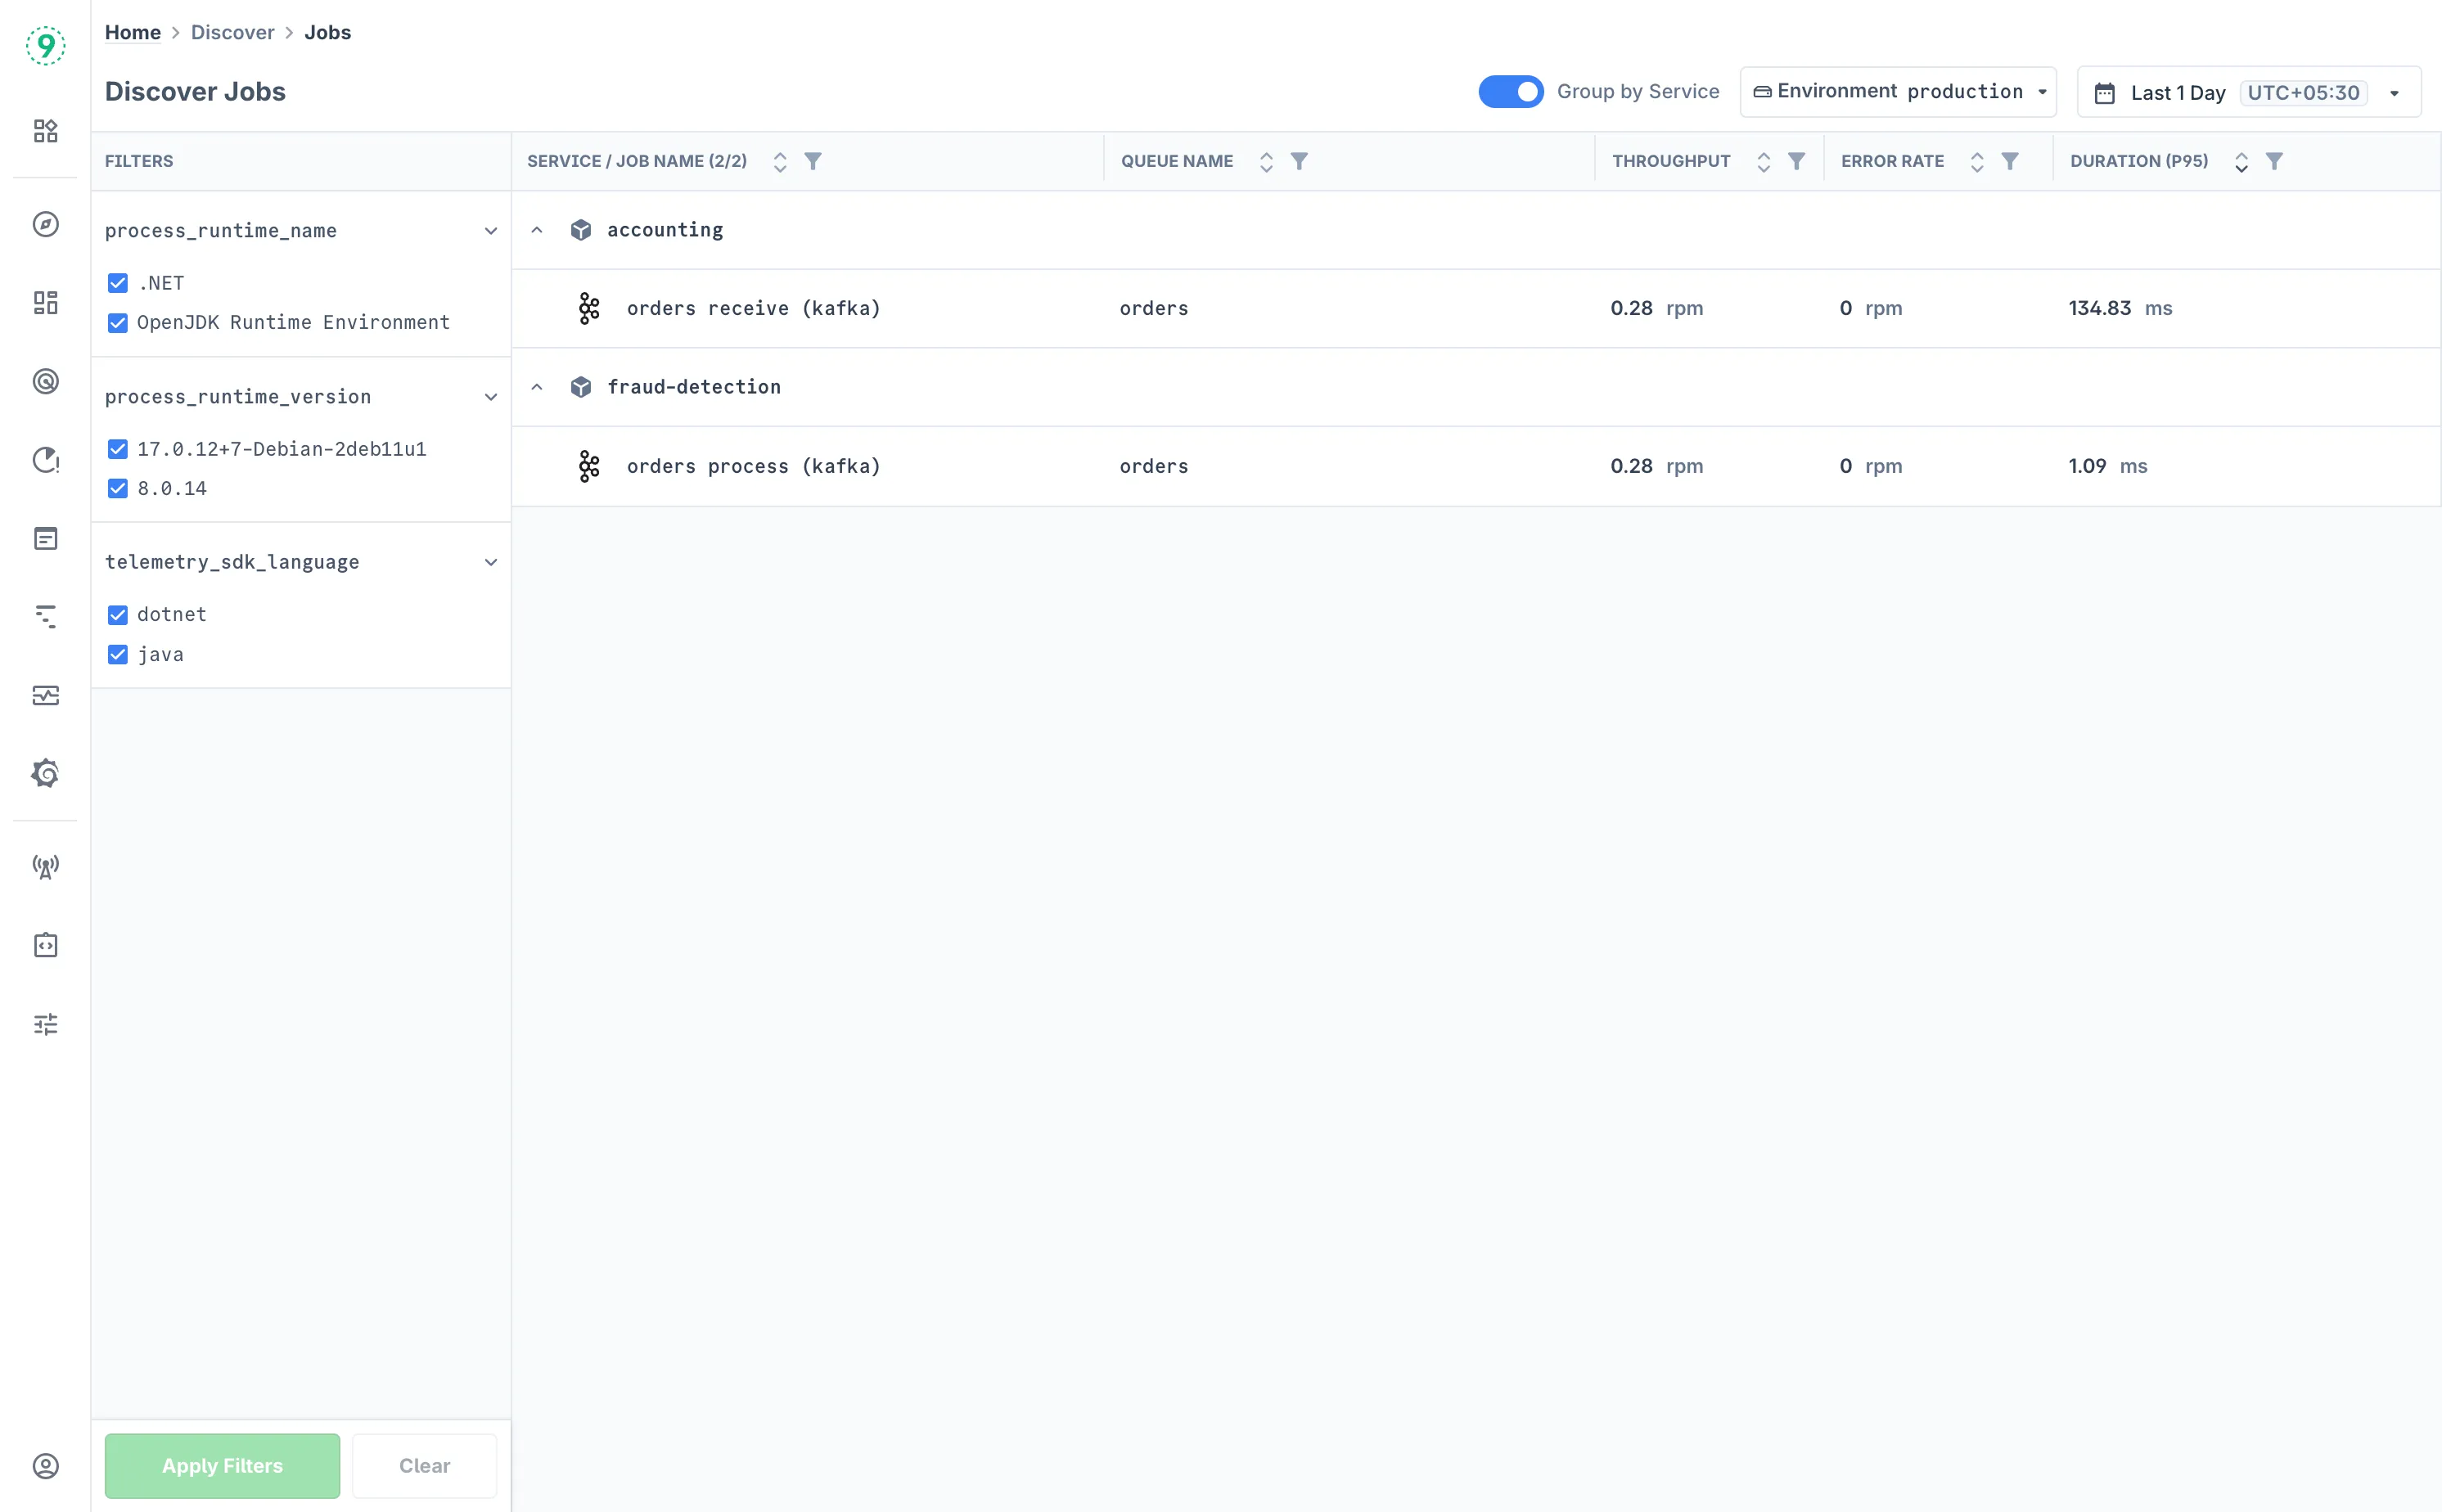
The Jobs dashboard displays all monitored background jobs and scheduled tasks in your environment with key performance indicators. The dashboard provides two viewing modes controlled by the Group by Service toggle.
- Default View (Ungrouped): The dashboard shows individual jobs with their performance metrics.
- Service: The service or application running the job
- Job Name: Specific job identifier or task name
- Queue Name: Job queue or processing system (when applicable)
- Throughput: Jobs processed per minute (RPM)
- Error Rate: Percentage of failed job executions
- Duration (P95): 95th percentile job execution time
- Grouped View: When Group by Service is enabled, jobs are organized hierarchically by service, allowing you to:
- Expand/Collapse Services: Click the arrow icons to show or hide jobs within each service
- Job-Level Details: View individual job performance within the service context
Use the sidebar filters to focus on specific job types or services:
- Select filter categories from the left sidebar (process_runtime_name, process_runtime_version, telemetry_sdk_language)
- Choose specific values to filter the jobs list
- Click Apply Filters to update the view
- Use Clear to reset all applied filters
Analyzing Individual Jobs
Click on any job name to access detailed performance monitoring and execution analysis.
Overview
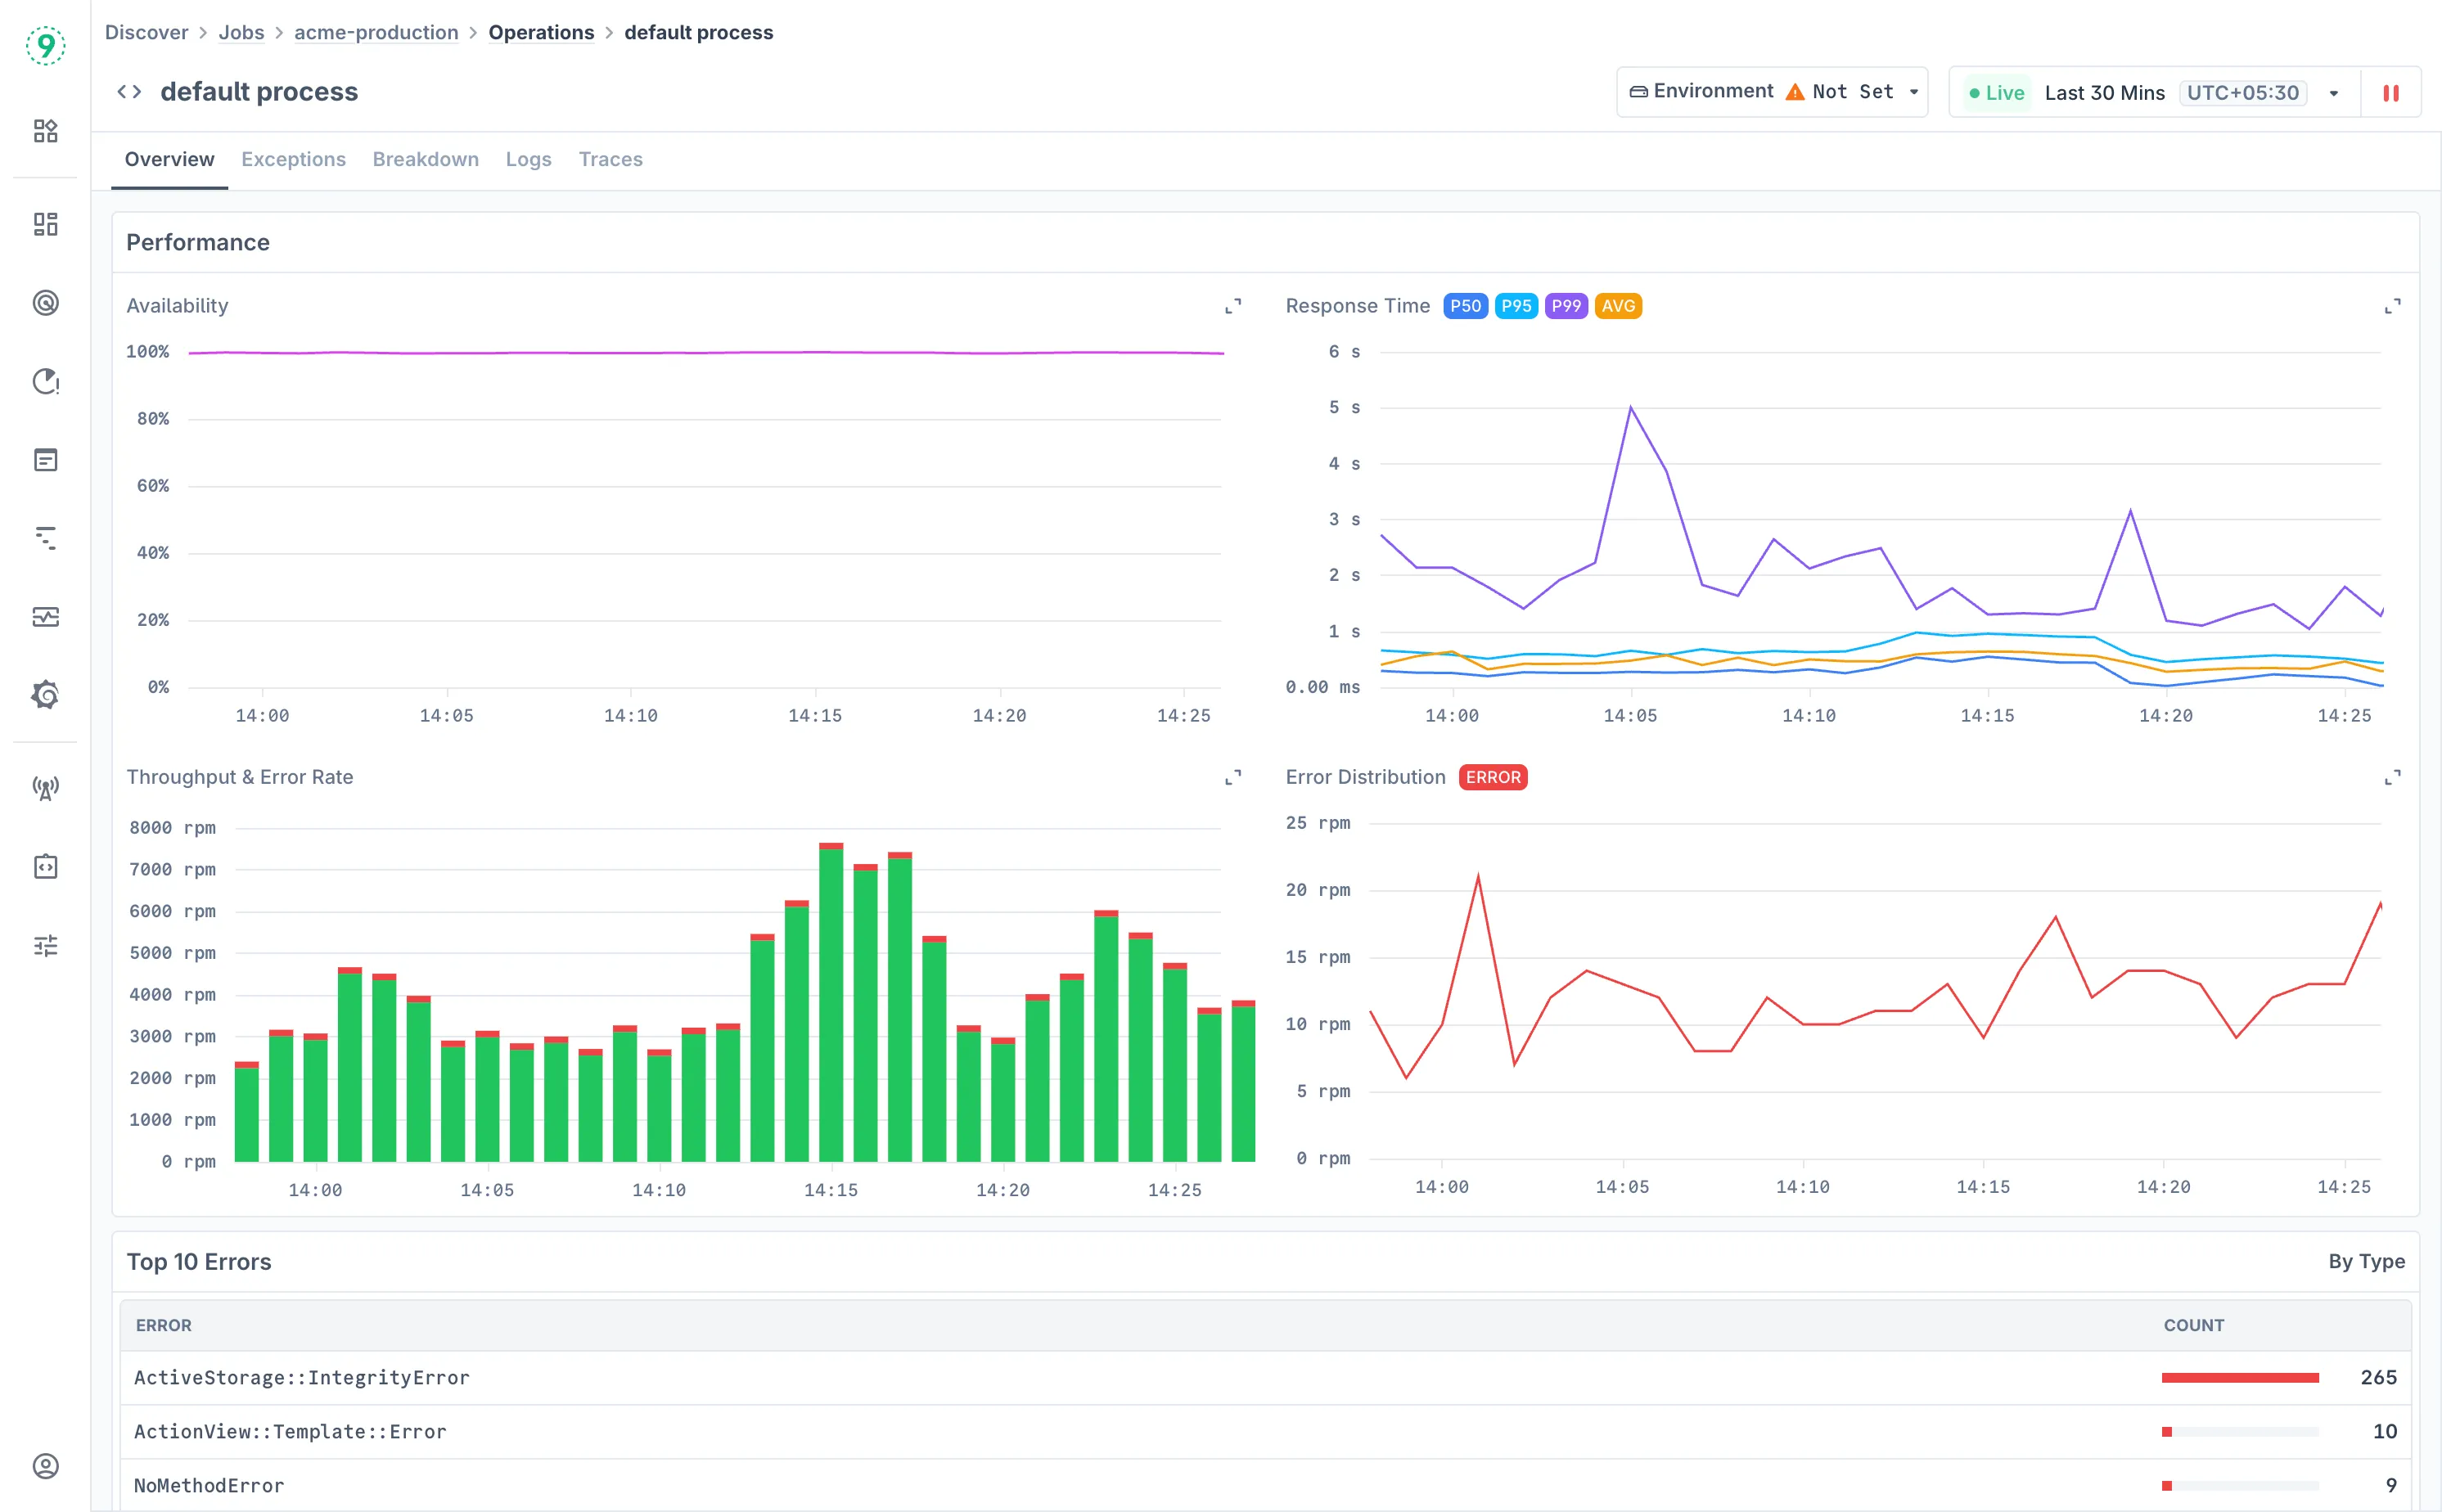
The Overview tab provides comprehensive job performance dashboards with key execution metrics:
Performance Metrics:
- Availability: Job execution success rate and reliability tracking
- Response Time: Execution duration with P50, P95, P99, and AVG percentiles
- Throughput & Error Rate: Job processing volume and failure rates over time
- Error Distribution: Breakdown of error types and their frequency during job execution
Key Performance Analysis:
- Top 10 Errors: Most frequent error types and their occurrence counts for prioritizing fixes
Exceptions
Monitor job failures and execution errors:
- Error Trend Visualization: Track error frequency over time with trend analysis for different error types
- Exception Type Filtering: Filter by specific exception classes and error types that occur during job execution
- Operation-Level Error Analysis: Identify which specific job operations are generating the most errors
- Error Count Tracking: Monitor total error occurrences for each exception type to prioritize troubleshooting efforts
Breakdown
Analyze job execution performance by individual operations. The Breakdown tab shows detailed operation-level metrics:
- Response Time Visualization: Area chart showing P50, P95, P99, and AVG response times with color-coded percentile bands
- Operation Performance Table: Detailed metrics for each job operation including:
- Operation Name: Specific job operation or database query
- Operation Type: Classification (Database, HTTP Client, Consumer, etc.)
- Avg. Calls/Transaction: Average number of operations per job execution
- Response Time (P95): 95th percentile execution time
- Total Time Spent: Cumulative time spent on the operation
Related Logs
Access job-specific logs for troubleshooting:
- Pre-filtered Logs: Automatically filtered to the selected job with service context
- Log Volume Indicator: Visual representation of log activity over time
- Time Range Alignment: Logs correspond to the selected monitoring time window
- Search and Filter: Use the search bar to find specific log entries or filter by attributes
- Click on any log line to view more details
Related Traces
Examine distributed traces for job execution. The Traces tab provides detailed execution flow analysis:
- Trace Filtering: Filter traces by service name, span name, and span kind (Consumer, Internal, etc.)
- Execution Timeline: View job execution traces with start times, trace IDs, and duration
- Operation Details: Examine specific operations and services involved in job execution
- Click on any trace or span to view distributed tracing visualization and more details
Best Practices
Job Monitoring Strategy:
- Focus on jobs with high error rates or extended execution times in the main dashboard
- Use the grouped view to understand service-level job health and identify problematic services
- Monitor both individual job performance and overall job processing throughput
Performance Optimization:
- Use the Breakdown tab to identify slow operations within job execution
- Monitor database queries and external API calls that may be bottlenecks
- Track resource usage patterns to optimize job scheduling and concurrency
- Analyze execution time trends to validate the impact of job optimizations
Troubleshooting Workflow:
- Start with the Overview tab to identify performance anomalies and error spikes
- Use the Exceptions tab to understand specific error patterns and their frequency
- Examine the Breakdown tab for operation-level performance issues
- Access Logs for detailed execution context and error messages
- Use Traces to understand job execution flow and identify bottlenecks in distributed processing
Queue Management:
- Monitor throughput trends to identify processing capacity issues
- Track error rates to detect systemic problems with job processing
- Use duration metrics to optimize job execution and resource allocation
- Analyze job scheduling patterns to balance system load and processing efficiency
Troubleshooting
Please get in touch with us on Discord or Email if you have any questions.