Discover Hosts
Monitor and analyze infrastructure performance across all your hosts with comprehensive system metrics
The Hosts feature in Discover provides comprehensive infrastructure monitoring, delivering real-time visibility into system performance across all your hosts. Monitor CPU usage, memory consumption, storage capacity, and detailed system metrics to optimize resource allocation, identify performance bottlenecks, and maintain healthy infrastructure across your entire environment.

This infrastructure monitoring solution helps you proactively identify resource constraints, track system health trends, and ensure optimal host performance for your applications and services.
Prerequisites
To monitor your host infrastructure with Last9, you need to configure at least one of the following data collection integrations:
Required (Choose at least one):
- Host Metrics: Core system metrics collection for CPU, memory, disk, and network monitoring. Configure the Host Metrics integration to collect infrastructure metrics via OpenTelemetry collectors
- Kubernetes Operator (recommended for Kubernetes deployments): Comprehensive Kubernetes monitoring including host-level metrics. Configure the Kubernetes Operator for Kubernetes environments
- Kubernetes Cluster Monitoring: Alternative Kubernetes monitoring solution that includes host metrics collection. Set up Kubernetes Cluster Monitoring for cluster-wide infrastructure monitoring
You can use any combination of these integrations based on your infrastructure setup. For Kubernetes environments, the Kubernetes Operator is the recommended choice as it provides the most comprehensive monitoring capabilities.
Understanding the Hosts Dashboard
Access the Hosts dashboard at Discover > Hosts in Last9.
The Hosts dashboard provides two visualization modes: List View and Map View (heatmap). Toggle between views using the view selector in the top-right corner. Your preference is automatically saved for future sessions.
Map View (Heatmap)
The Map View displays your hosts as a heatmap visualization, providing an at-a-glance overview of infrastructure health across your entire environment.
Key features:
- Color-coded health: Each cell represents a host, with colors indicating health status (green for healthy, yellow/orange for warning, red for critical)
- Health status summary: Cards at the top show counts of Healthy, Warning, and Critical hosts with threshold definitions
- Quick identification: Instantly spot problematic hosts in large infrastructure deployments
Group By
Use the Group by dropdown to organize hosts into logical groups:
| Option | Description |
|---|---|
| Job | Groups hosts by their collection job (e.g., prometheus-node-exporter, node-exporter) |
| Health Status | Groups hosts by their current health state (Healthy, Warning, Critical) |
| None | Displays all hosts in a single flat grid without grouping |
| Custom Labels | Groups by any label attached to your hosts (e.g., environment, region) |
View By
Use the View by dropdown to change which metric determines each host’s color:
| Option | What it shows |
|---|---|
| CPU | Colors based on CPU utilization percentage |
| Memory | Colors based on memory usage percentage |
| Disk | Colors based on root volume disk usage percentage |
The health thresholds for coloring depend on the selected metric:
Health Thresholds:
| Metric | Healthy | Warning | Critical |
|---|---|---|---|
| CPU | < 70% | 70-90% | ≥ 90% |
| Memory | < 70% | 70-90% | ≥ 90% |
| Disk | < 80% | 80-95% | ≥ 95% |

Hover details: Mouse over any cell to see detailed host information including:
- Host ID and IP address
- Current health status
- Associated job
- Resource usage (CPU, Memory, Disk) with visual progress bars
List View

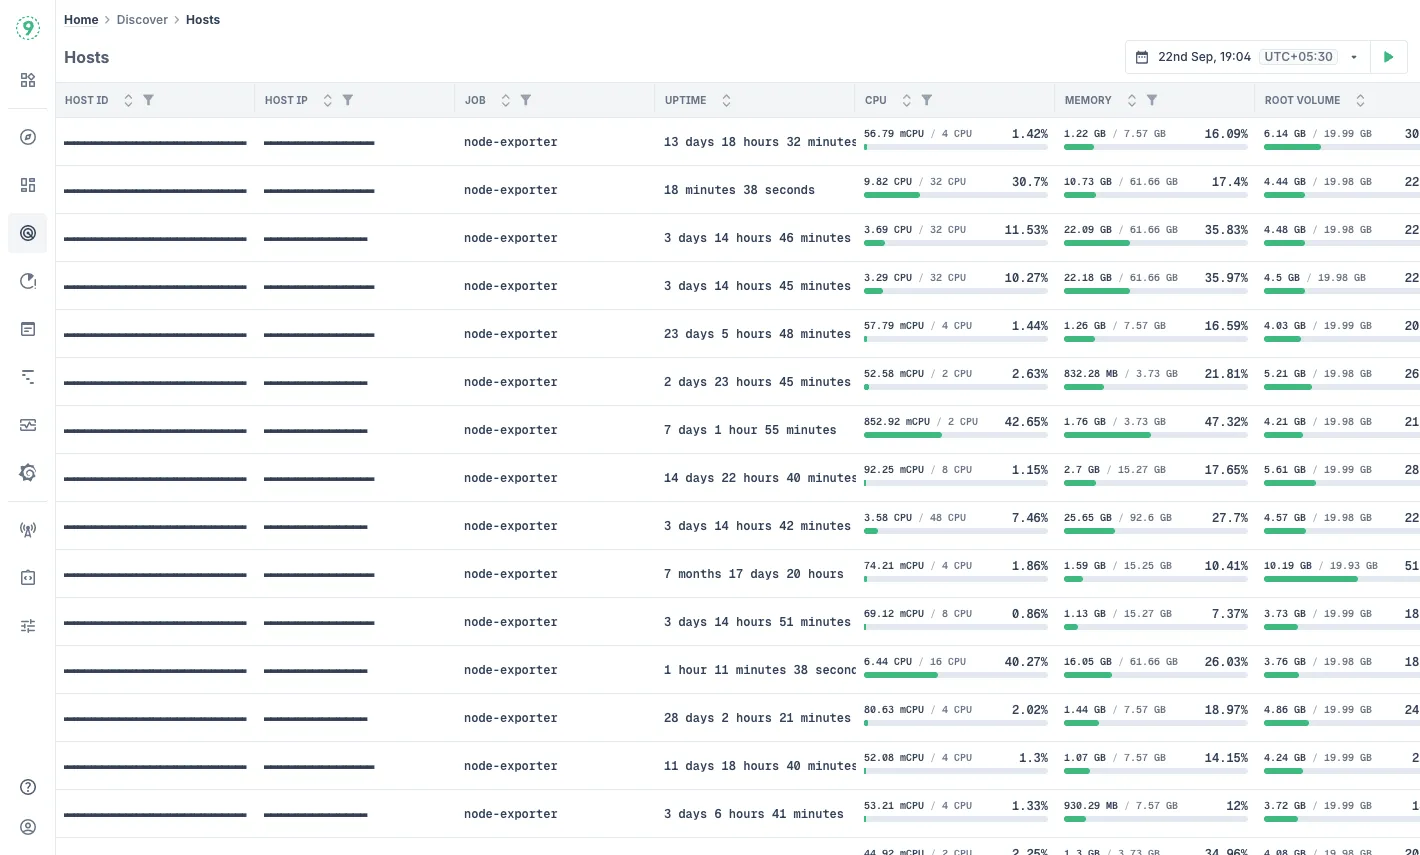
The List View displays all monitored infrastructure in a unified table with key performance indicators at a glance:
- Host ID: Unique identifier for each monitored host
- Host IP: Network address of the host
- Job: Associated collection job
- Uptime: How long the host has been running
- CPU: Current CPU utilization with visual indicators
- Memory: RAM usage showing used/total capacity
- Root Volume: Primary disk usage percentage
Use the filtering capabilities to focus on specific hosts:
- Click on any column header to sort hosts by that metric
- Use the search box to filter by host ID or IP address
- Select multiple hosts using the checkboxes for bulk analysis
- Toggle between “ALL” and “NONE” to quickly select or deselect all hosts
Color-coded metrics help identify hosts requiring attention - green indicates normal operation while red suggests potential issues that need investigation.
Analyzing Individual Hosts
Click on any host to access comprehensive performance data and system analysis.

Overview
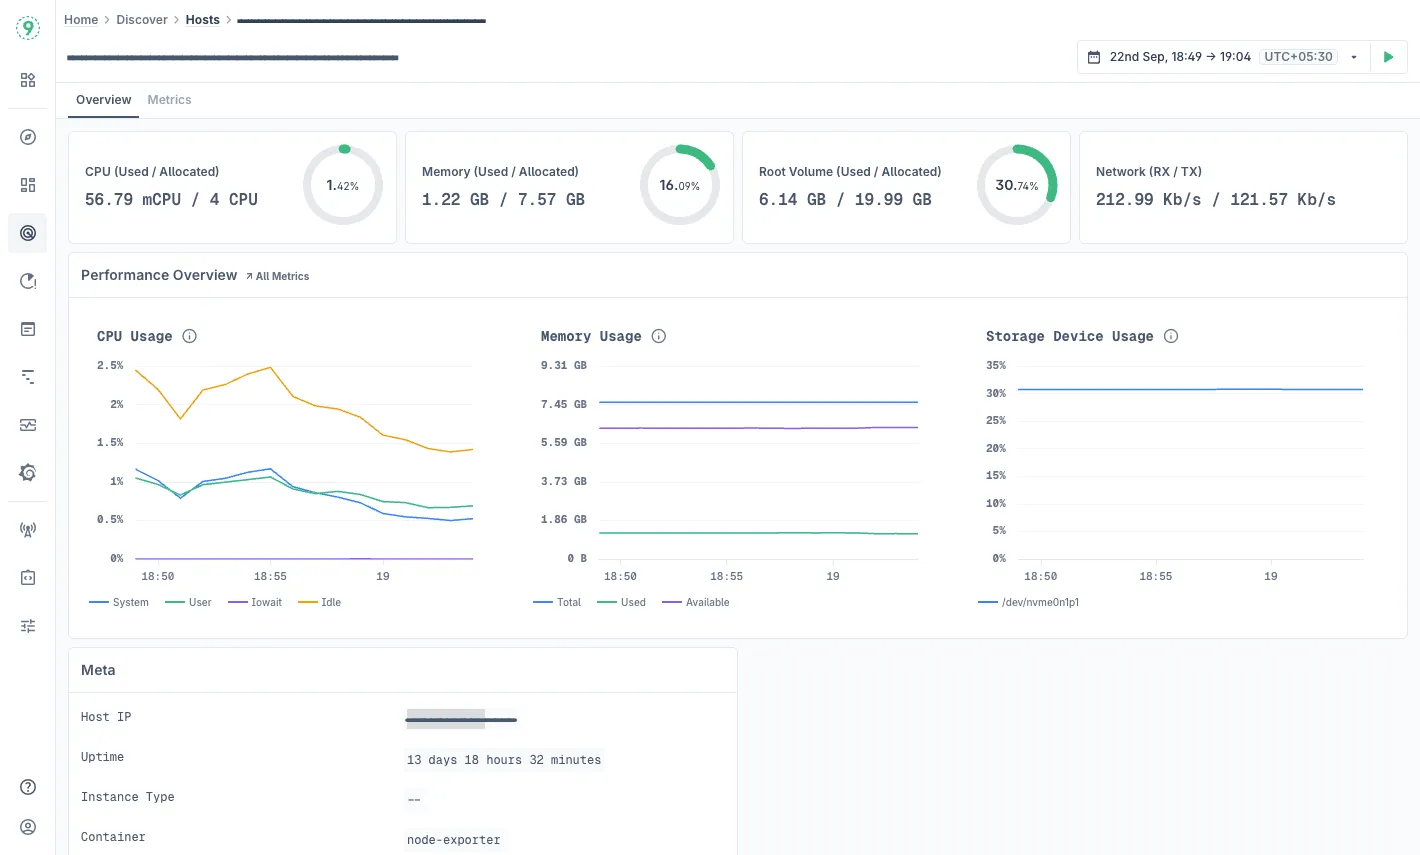
The Overview tab provides high-level resource utilization dashboards with essential system metrics:
- Resource Summary: View current CPU utilization, memory consumption, root volume usage, and network throughput at a glance
- Performance Charts: Track CPU usage, memory consumption, and storage device usage over time with detailed graphs
- Host Metadata: Essential configuration details including Host IP, uptime duration, instance type, container information, availability zone, and system architecture
Metrics
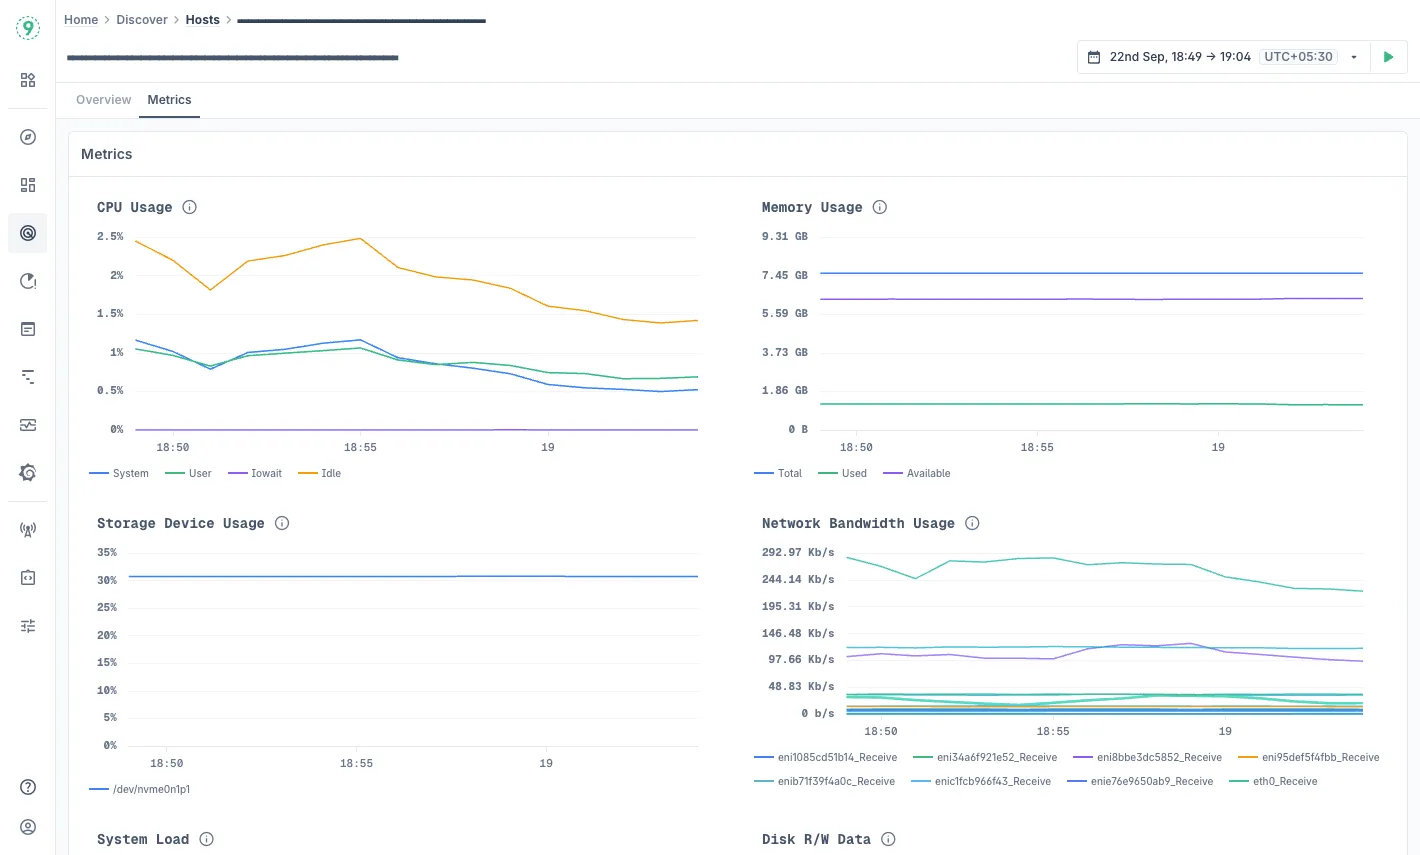
The Metrics tab offers comprehensive system performance analytics with detailed monitoring capabilities:

Core System Metrics:
- CPU Usage: Processor utilization tracking over time for performance optimization
- Memory Usage: RAM consumption patterns with available memory monitoring for capacity planning
- Storage Device Usage: Disk utilization for mounted volumes and storage performance analysis
- Network Bandwidth Usage: Network I/O rates and throughput monitoring for connectivity analysis
Advanced System Metrics:
- System Load: System load averages indicating overall system stress and resource demand
- Disk R/W Data: Read/write operations and throughput rates for storage performance optimization
- Disk R/W Time: I/O operation latency and timing analysis for identifying storage bottlenecks
- Disk IOps Completed: Input/output operations per second for storage performance monitoring
- Time Spent Doing I/Os: Time spent on disk operations for I/O efficiency analysis
- Network Sockstat: Network socket statistics and connection monitoring for network health
- Open File Descriptor/Context Switches: System-level resource usage for process management analysis
Best Practices
Choosing the Right View:
- Use Map View for daily health checks and quick infrastructure status reviews
- Use List View when you need to compare specific metrics across hosts or sort by performance
- Start with Map View to identify problem areas, then switch to List View for detailed investigation
Infrastructure Monitoring Strategy:
- Regularly review host performance to identify trends and potential capacity issues before they impact applications
- Monitor both individual host metrics and overall infrastructure health patterns
- Use color-coded indicators to quickly identify hosts requiring immediate attention
- Set up systematic monitoring schedules to track infrastructure health over time
Resource Optimization:
- Use historical CPU and memory data to plan for capacity expansion and optimize resource allocation
- Monitor disk I/O patterns to identify storage bottlenecks and optimize disk usage
- Track network bandwidth utilization to plan for network capacity and identify connectivity issues
- Analyze system load trends to understand resource demand patterns and optimize workload distribution
Performance Analysis:
- Establish baseline performance ranges for your hosts to quickly identify anomalies and performance degradation
- Monitor advanced metrics like file descriptor usage and context switches to identify system-level bottlenecks
- Use storage device metrics to optimize disk allocation and identify potential hardware issues
- Correlate network metrics with application performance to understand infrastructure impact on service delivery
Troubleshooting Workflow:
- Start with the Overview tab to identify resource utilization anomalies and system health issues
- Use the Metrics tab for detailed performance analysis and trend identification
- Monitor system load and I/O metrics to identify infrastructure bottlenecks
- Analyze network statistics to understand connectivity and throughput issues
Troubleshooting
Please get in touch with us on Discord or Email if you have any questions.