
Application Errors
Monitor errors, exceptions, and failed requests with detailed breakdowns by browser, device, and network conditions.
The Errors tab in Discover Applications helps you identify, analyze, and prioritize errors and exceptions that affect your users. Get detailed breakdowns by browser, device, network conditions, and view comprehensive error traces.
Error Collection
The SDK automatically captures errors from multiple sources:
- Console errors: JavaScript errors logged to the console
- Global errors: Unhandled exceptions and promise rejections
- Reporting Observer: Browser-reported issues like CSP violations
- Network failures: Failed API requests and resource loading errors
Each error includes HTTP details (for network failures), resource timing, session context, and any global attributes you’ve configured.
Configuring Error Capture
Control which error sources are enabled:
L9RUM.init({ // ... errors: { console: true, global: true, report: true, network: true, ignorePatterns: [/ResizeObserver/i], beforeSend: (event) => { // Filter or enrich errors if (event.attributes["exception.message"]?.includes("ExpectedNoise")) { return null; // Drop this error } return event; }, },});Manual Error Capture
Explicitly track handled exceptions:
try { await searchProducts(query);} catch (error) { L9RUM.captureError(error, { handled: true, message: "search_query_timeout", query, page: 3, });}Manual captures default to handled: true and pass through the same beforeSend hook as automatic errors.
Accessing Error Monitoring
- Navigate to Discover > Applications in Last9
- Click the Errors tab
- Choose your version and environment from the top filters
- Set your desired time range using the date picker
Dashboard Components
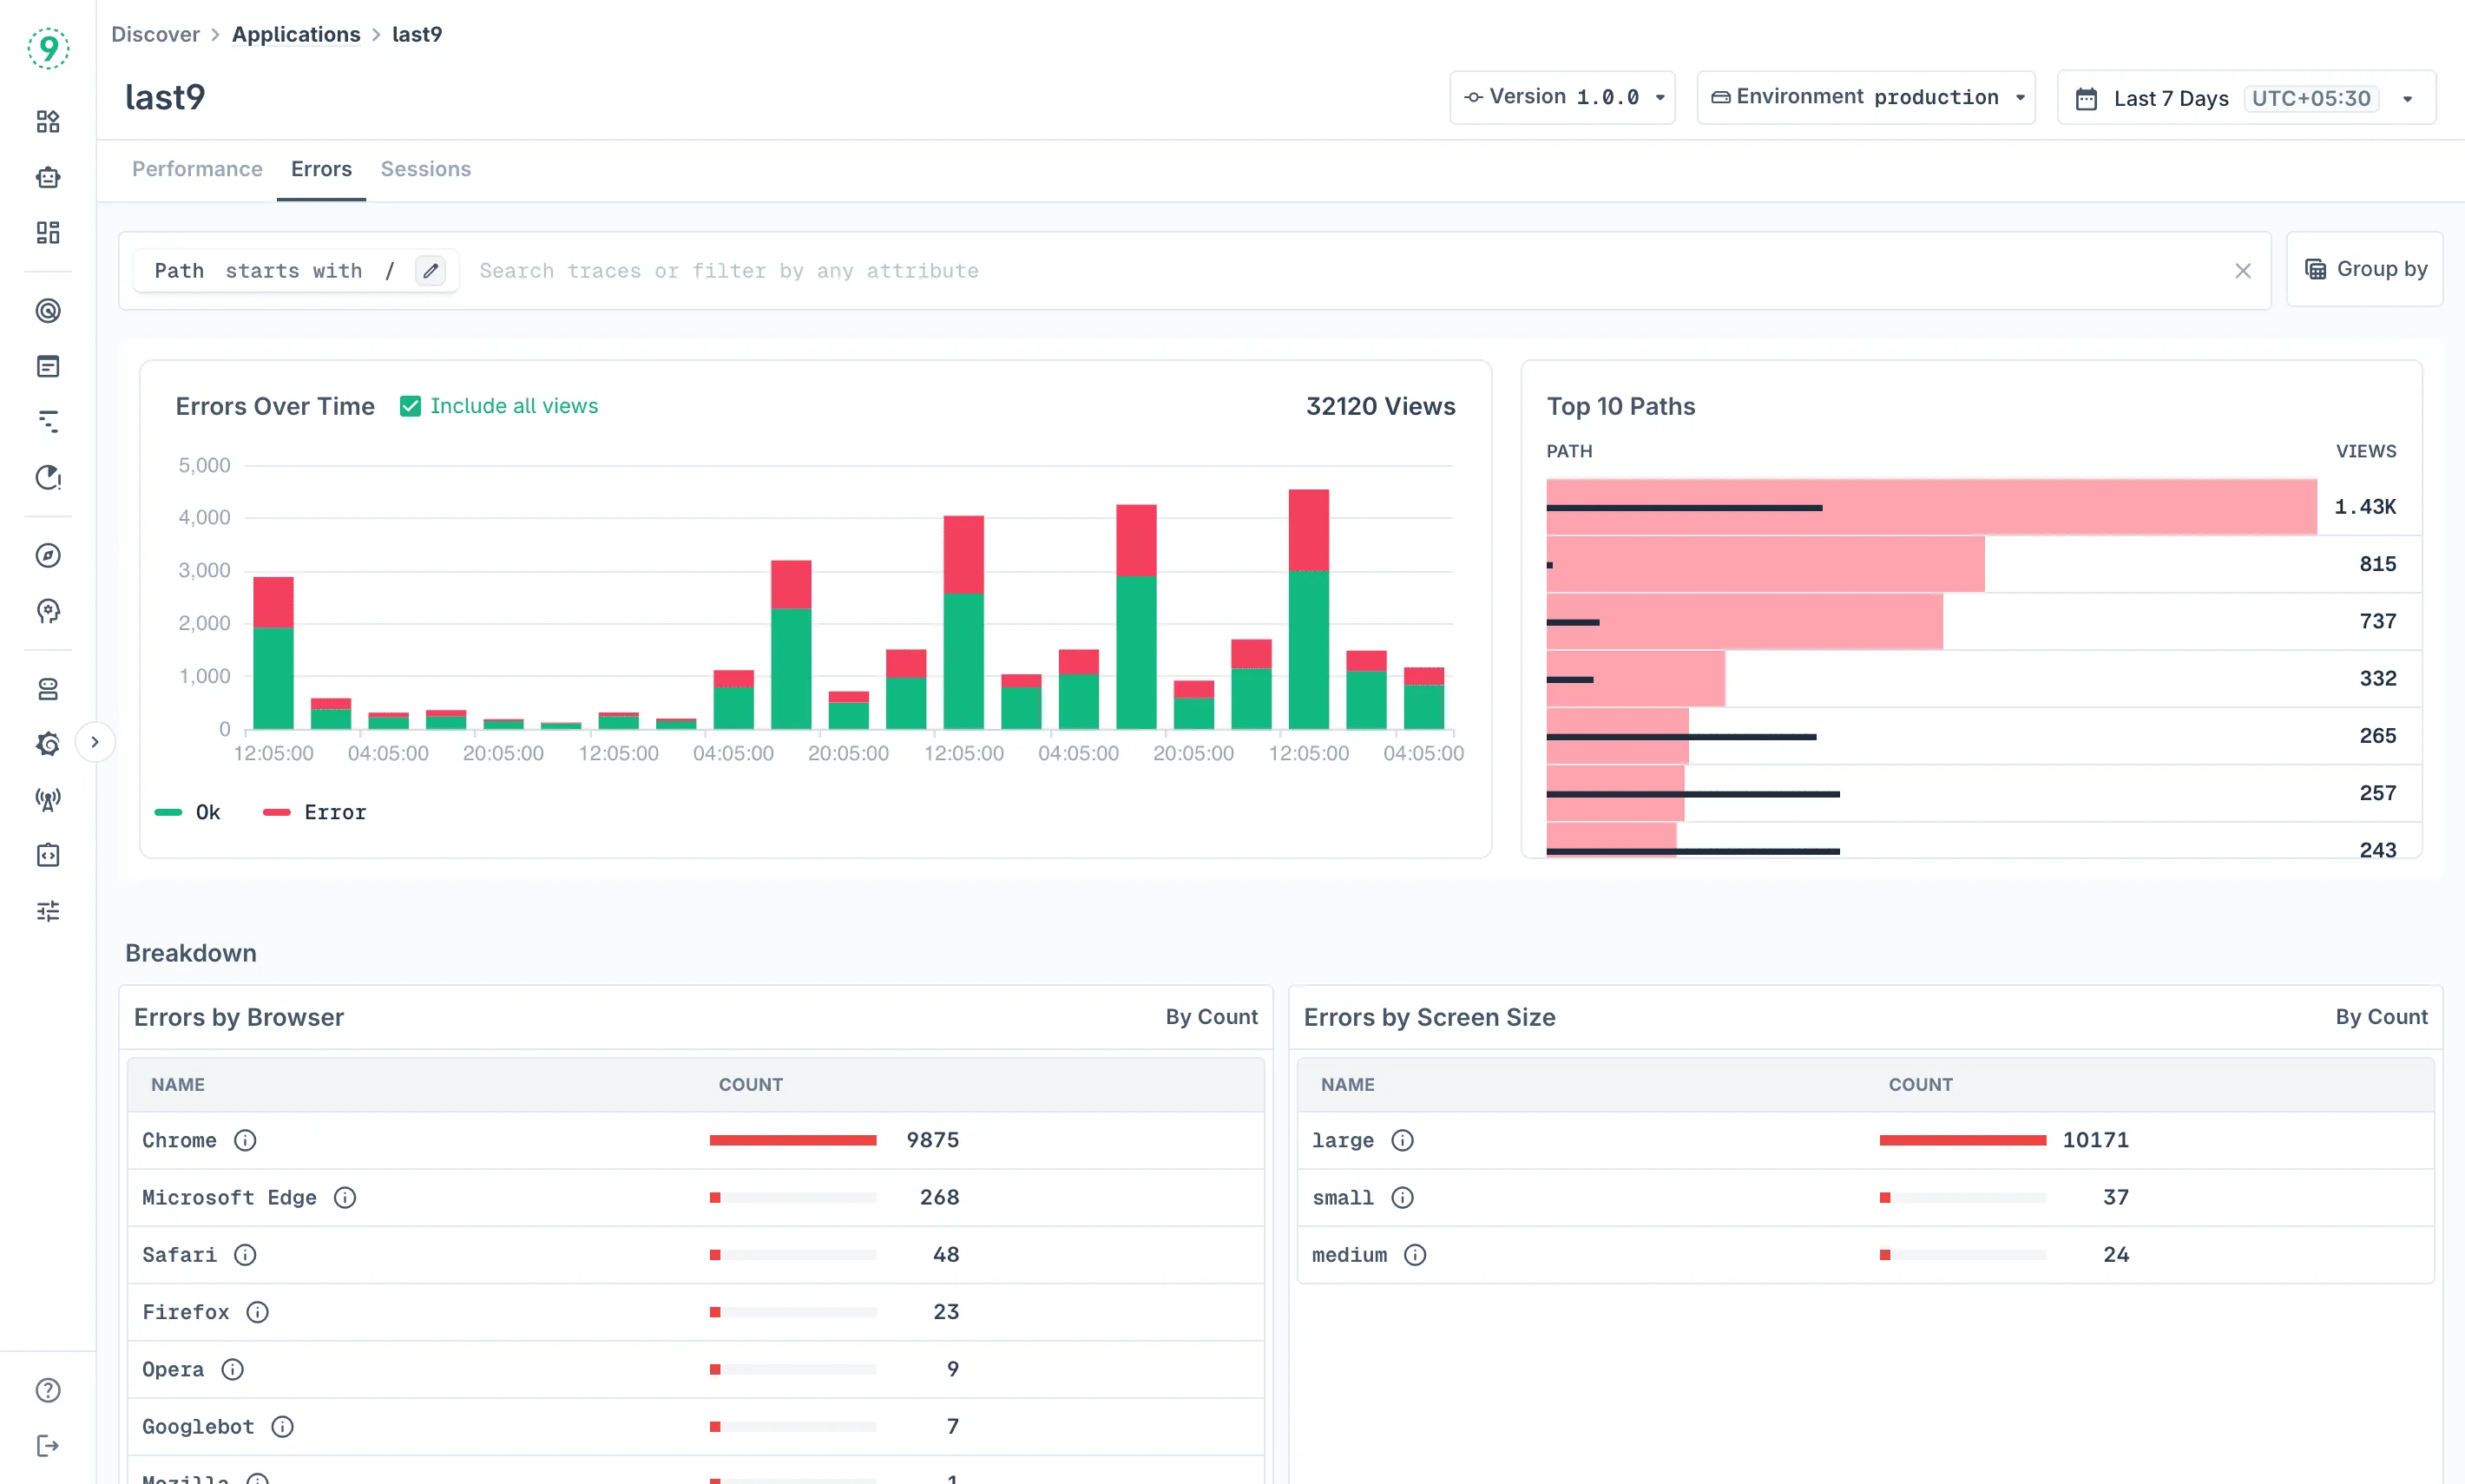
Errors Over Time
Track error frequency throughout your selected time period. The chart shows:
- Error trends and patterns over time
- Spikes that might correlate with deployments or traffic increases
- The option to Include all views to show both error and success rates for context
- Visual distinction between successful pageviews (green) and errors (red)
Top Paths by Error Count
See which pages generate the most errors with total error counts for each path. This ranking helps you:
- Prioritize bug fixes on pages with the highest error impact
- Focus debugging efforts on critical user journeys
- Understand which pages need immediate attention
Error Breakdown Analysis
The dashboard provides multiple breakdown views to help you understand error patterns:
Errors by Browser
Compare error rates across different browsers:
- Chromium: Often the majority of your traffic
- Firefox: May show different error patterns due to engine differences
- Safari: Important for iOS and macOS users
- Other browsers: Edge, mobile browsers, etc.
Browser-specific errors help identify compatibility issues, polyfill requirements, and browser-specific API behaviors.
Errors by Screen Size
Analyze errors across different device categories:
- Large: Desktop and large tablet screens (≥ 1024px)
- Medium: Tablets and small laptops (< 1024px)
- Small: Mobile devices (< 768px)
Screen size patterns reveal mobile-specific errors, responsive design problems, and device-specific failures.
Errors by Network Type
Compare error rates across connection types:
- 4g: Mobile data connections
- Unknown: Network type couldn’t be determined
- 2g: Slower mobile connections
- WiFi/Ethernet: Fixed broadband connections
Network-related patterns show timeout errors on slower connections, loading failures due to connectivity issues, and network-dependent feature problems.
Errors by Device Type
Break down errors by device categories:
- Unknown: Device type couldn’t be determined
- Mobile: Smartphones and mobile devices
- Desktop: Desktop computers and laptops
- Tablet: Tablet devices
Device-specific errors indicate mobile-only functionality issues, touch vs mouse interaction problems, and hardware capability differences.
Detailed Error Investigation

Individual Error Analysis
Click on any error entry to view detailed information:
Each error provides:
- Timestamp: When the error occurred
- View ID: Unique identifier for the pageview
- Path: URL where the error happened
- Browser: User’s browser information
- Screen Size: Device screen category
- Network Type: Connection type when error occurred
Exception Details
- Exception timing: How long after page start the error occurred
- Full stack trace: Complete error stack with file names and line numbers
- Error context: Surrounding code and variable states when available
- Trace link: Click “Trace” to view the complete user session
This detailed information helps developers identify the exact source of errors, understand the user context when errors occur, reproduce issues by following the user’s journey, and prioritize fixes based on error frequency and impact.
Custom Events in Error Context
When you open the error details sidepanel, Last9 also displays any custom events that occurred within the same session view — not just the error itself. This lets you reconstruct what the user was doing immediately before and after the error fired.
Custom events are tracked via L9RUM.addEvent() and are distinct from errors — they carry no exception or stack trace, but they do carry the attributes you attach. Examples include button clicks, checkout steps, feature flag evaluations, or any business action you want to correlate with failures.
L9RUM.addEvent("checkout_attempted", { step: "payment", plan: "pro", amount: 99,});How custom events differ from errors
Errors (captureError) | Custom events (addEvent) | |
|---|---|---|
| Purpose | Capture exceptions and failures | Track user actions and business events |
| Stack trace | Yes | No |
| Appears in error count | Yes | No |
| Shown in error sidepanel | As the primary event | As contextual events within the same view |
Passes beforeSend hook | Yes | No |
Tracking custom events
Call L9RUM.addEvent() with a name and an optional attributes object at any point in your application:
// Track a business actionL9RUM.addEvent("payment_method_selected", { type: "credit_card" });
// Track a feature interactionL9RUM.addEvent("search_performed", {  query_length: query.length,  result_count: results.length,});
// Track a navigation stepL9RUM.addEvent("onboarding_step_completed", {  step: 3,  step_name: "invite_team",});
Events inherit session and view context automatically. Any attributes set via L9RUM.spanAttributes() are also attached, so you do not need to repeat user or organization context on each event call.
Filtering and Grouping
Use the same filtering capabilities as Performance monitoring:
- Path filtering: Focus on specific pages or URL patterns
- Attribute filtering: Filter by browser, device, network, or custom attributes
- Time-based filtering: Analyze errors within specific time windows
- Environment filtering: Compare error rates across different deployments
Best Practices
- Monitor Error Trends: Watch for error spikes after deployments
- Focus on High-Impact Errors: Prioritize errors affecting many users or critical paths
- Correlate with Performance: Slow pages often have higher error rates
- Browser Testing: Pay attention to browser-specific error patterns
- Mobile-First Debugging: Mobile users often experience unique error conditions
- Set Error Budgets: Define acceptable error rates and alert when exceeded
- Regular Review: Check error patterns weekly to catch regressions early
Troubleshooting
- No errors showing? Confirm error toggles in the
errorsconfiguration are enabled andsampleRateis appropriate for your traffic volume. - Manual captures missing context? The SDK automatically includes session and user context. Additional attributes passed to
captureError()are merged with SDK-provided fields. - Network failures missing? Check browser DevTools for CORS issues—failed preflights prevent the SDK from capturing response details.
- Custom events not appearing in sidepanel? Custom events are scoped to the same view as the error. If
L9RUM.addEvent()is called outside an active view (for example, before the first page navigation completes), the event may not be associated with a view and will not appear. Ensure SDK initialization is complete before callingaddEvent().
Please get in touch with us on Discord or Email if you have any questions.