

At 02:10 the checkout error-rate alert fires and the checkout team gets paged. They open their dashboards, find nothing wrong in their own code, and twenty minutes later someone notices that every failing request was waiting on a payments timeout. The alert was correct. The routing was not.
Automated alert triage closes that gap by adding one step between the alert and the page: look at the traces for the alert window, find the service where the failure started, and page the team that owns that service. This post covers the no-code way to do that with Last9 AI, then builds a small triage service for teams that want the routing to happen without a human asking.
Why rule-based alert routing pages the wrong team
Alert routing in most stacks is a tree of label matchers. In Prometheus Alertmanager, a route such as team: frontend sends everything carrying that label to the frontend receiver, and the configuration reference shows how deep those trees can go. That works when the service that fires the alert is the service that broke.
In a request path that crosses five services, it usually is not. Users and synthetic probes usually touch the first hop, so that is where alerts fire. A payments timeout shows up as a checkout 500, and the label on the alert says service: checkout.
The matcher tree is not wrong, it is answering a different question. It knows who owns the alert’s label. It cannot know who owns the cause, because the cause is not on the alert. It is in the trace.
Our incident response automation playbook lists smart routing as a detection-stage job. This post covers the case where “route by ownership” needs to know which service to look up.
Start without code: ask Last9 AI to investigate the alert
If a person triages your alerts, you may not need a service. Configure the Slack notification channel, then mention @Last9 in the alert’s thread and ask it to investigate the alert window. The Last9 AI in Slack docs show the pattern:
@Last9 Investigate the alert. Use the service and time window inthe alert, check supporting telemetry, and list confirmed findingsand remaining questions.Ask which services are affected and whether a change event overlaps the window. The incident investigation guide suggests asking it to separate confirmed findings from possible causes, and to list the evidence it could not query.
This is a human-in-the-loop path. It does not page anyone, and installing the app does not configure recurring checks. If you want the page itself to go to the right team with no one asking, keep reading.
What the alert webhook gives you, and what it leaves out
An alert webhook is the input to a triage service. The Last9 webhook channel sends one JSON POST per alert event. These are the fields a triage service uses:
| Field | Alert type | Use in triage |
|---|---|---|
event_action | all | trigger opens a page, resolve closes it |
dedup_key | all | Matches a resolve to the trigger that opened the page |
payload.metric_alert_labelsets | metric alert groups | Labels of the series that fired, such as {"service": "checkout"}. Omitted when one notification covers several series |
payload.metric_alert_group_labels | metric alert groups | Labels the rule groups by |
payload.metric_alert_timing | metric alert groups | start and end of the alert: your trace lookup window |
log_lines | log alerts | Sample of matched lines, each with timestamp, severity, body |
client_url | all | Link back to the alert, for the page |
Two limits shape the design. First, there is no trace ID in a metric alert payload, so you need a lookup step: search error spans for the alerting service inside the metric_alert_timing window instead of guessing a window.
Second, a resolve event carries only routing_key, dedup_key and event_action. Nothing in it says which team you paged, so your service has to remember that itself, keyed by dedup_key.
Log alerts have a shortcut. If your application logs include a trace_id in the line body, the triage service can read it from log_lines and skip the search. Which field holds it depends on your logging setup, so treat the regex in the example below as a starting point.
Find the origin span for alert correlation
Alert correlation here means one thing: connecting an alert on service A to the failing span in service B. The Traces Query API gives you both halves of it.
- Find failed spans for the alerting service. Query
query_rangeinspanmode with a filter onServiceNameandStatusCodeequal toSTATUS_CODE_ERROR, over the alert window. - Fetch each full trace. Take the
TraceIdof each result and call Get Trace by ID with the same window. The response lists every span withServiceName,ParentSpanIdandStatusCode. - Walk to the deepest error span. Compute each failed span’s depth by following
ParentSpanIdup to the root. The deepest one is where the error started.
The deepest error span’s ServiceName is the candidate culprit, with one caveat the API docs call out: a failing call is not always marked on the service at fault. A gRPC server span can stay STATUS_CODE_UNSET while the calling client span is STATUS_CODE_ERROR. So when the deepest error span is a client span, the culprit is the service of its child span, not the caller. The OpenTelemetry traces concepts page explains span kinds and status if you need a refresher.
For the checkout example, the trace has an error on checkout-frontend, then on checkout-api, then on payments. payments is deepest, so payments is the candidate. One trace is a vote, not a verdict, which is why the example below tallies several.
Map the culprit service to an owning team
Service ownership is the part a triage service cannot infer. Last9 doesn’t define an ownership field for this, so the example below keeps the map in your own code. Treat it as a design choice you own.
A plain file works:
# owners.yamlcheckout-frontend: team-frontendcheckout-api: team-checkoutpayments: team-paymentspayments-db: team-paymentsThree rules keep the map useful:
- Keep it in version control, outside the triage code. A team change becomes a reviewed pull request, not a redeploy.
- Fall back, never drop. If the culprit has no entry, page the alerting service’s team. If that has none either, page a default on-call. An alert must not vanish because a map was stale.
- Audit it against telemetry. Our guide to service catalog observability suggests breaking down errors by service owner to confirm ownership metadata is accurate. The same check works here: a service with errors and no map entry is a gap.
A minimal incident triage service
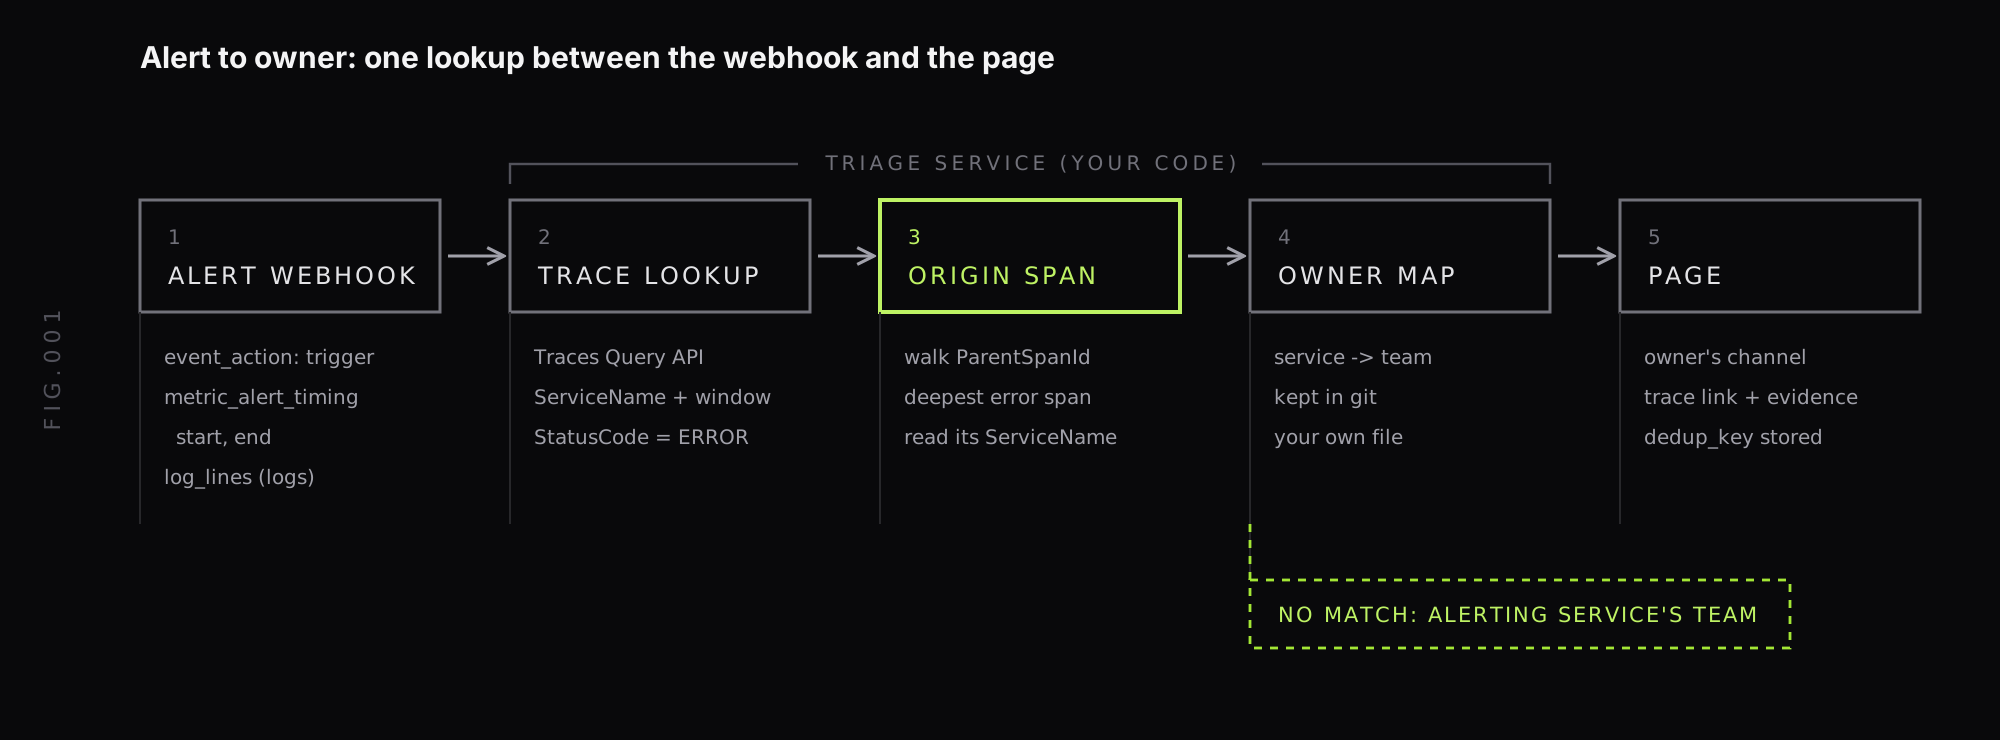
Incident triage here is a single function that takes the webhook body and decides who to page. The sketch below is an example, not a Last9 API or SDK. It uses the documented Traces Query API, with the X-LAST9-API-TOKEN: Bearer <ACCESS_TOKEN> header exactly as the docs show it, and it expects L9_ORG, L9_TOKEN and L9_REGION in the environment. page and close_page stand for your own paging client.
import osimport refrom collections import Counterfrom datetime import datetime, timedelta
import requestsimport yaml
BASE = f"https://app.last9.io/api/v4/organizations/{os.environ['L9_ORG']}"HEADERS = {    "X-LAST9-API-TOKEN": f"Bearer {os.environ['L9_TOKEN']}",    "Content-Type": "application/json",}REGION = os.environ["L9_REGION"]  # for example us-east-1PAD = timedelta(minutes=2)TRACE_ID = re.compile(r"\b[0-9a-f]{32}\b")DEFAULT_TEAM = "team-platform-oncall"
OWNERS = yaml.safe_load(open("owners.yaml"))  # {"payments": "team-payments", ...}OPEN_PAGES = {}  # dedup_key -> page id; the resolve payload carries nothing else

def parse_ts(ts):    return datetime.strptime(ts, "%Y-%m-%dT%H:%M:%S.%f%z")

def window(webhook):    p = webhook["payload"]    timing = p.get("metric_alert_timing", {})    start = parse_ts(timing.get("start", p["timestamp"]))    end = parse_ts(timing.get("end", p["timestamp"]))    return start - PAD, end + PAD

def window_params(start, end):    return {"region": REGION, "start": int(start.timestamp()), "end": int(end.timestamp())}

def failed_trace_ids(service, start, end, limit=20):    body = {"pipeline": [{"type": "filter", "query": {"$and": [        {"$eq": ["ServiceName", service]},        {"$eq": ["StatusCode", "STATUS_CODE_ERROR"]},    ]}}]}    r = requests.post(        f"{BASE}/cat/api/traces/v2/query_range/json",        headers=HEADERS, json=body, timeout=15,        params={**window_params(start, end), "limit": limit, "mode": "span"},    )    r.raise_for_status()    return {s["TraceId"] for s in r.json()["data"]["result"]}

def get_trace(trace_id, start, end):    r = requests.get(        f"{BASE}/cat/api/traces/{trace_id}",        headers=HEADERS, params=window_params(start, end), timeout=15,    )    r.raise_for_status()    return r.json()["traces"]

def culprit(spans):    by_id = {s["SpanId"]: s for s in spans}
    def depth(span):        d = 0        while span["ParentSpanId"] in by_id and d < 100:            span, d = by_id[span["ParentSpanId"]], d + 1        return d
    failed = [s for s in spans if s["StatusCode"] == "STATUS_CODE_ERROR"]    if not failed:        return None    deepest = max(failed, key=depth)    if deepest["SpanKind"] == "SPAN_KIND_CLIENT":        # The failing call is marked on the caller; the callee's server span can stay UNSET.        callee = [c for c in spans                  if c["ParentSpanId"] == deepest["SpanId"]                  and c["ServiceName"] != deepest["ServiceName"]]        if callee:            return callee[0]["ServiceName"]    return deepest["ServiceName"]

def triage(webhook):    key = webhook["dedup_key"]    if webhook["event_action"] == "resolve":        close_page(OPEN_PAGES.pop(key, None))        return
    p = webhook["payload"]    start, end = window(webhook)    alerting = p.get("metric_alert_labelsets", {}).get("service")  # label name depends on your metric
    # Log alerts: a trace_id in a matched line skips the search.    ids = {m for line in webhook.get("log_lines", []) for m in TRACE_ID.findall(line["body"])}    if not ids and alerting:        ids = failed_trace_ids(alerting, start, end)
    votes = Counter(c for c in (culprit(get_trace(t, start, end)) for t in ids) if c)    service = votes.most_common(1)[0][0] if votes else alerting    team = OWNERS.get(service) or OWNERS.get(alerting) or DEFAULT_TEAM
    OPEN_PAGES[key] = page(        team,        summary=p["summary"],        evidence={"alerting_service": alerting, "origin_votes": dict(votes),                  "alert_url": webhook["client_url"]},    )
Wire it to the webhook channel with any HTTP framework:
from fastapi import FastAPI
app = FastAPI()

@app.post("/alerts")def alerts(webhook: dict):    triage(webhook)    return {"ok": True}
What the sketch does and does not do:
- The
servicelabel name is an assumption. Use whichever label your alerting metric carries. Ifmetric_alert_labelsetsis omitted because one notification covers several series, the sketch has no alerting service and pages the default team. Handle that case for your alerts. OPEN_PAGESis in memory. Back it with a durable store, or a restart orphans every open page and a resolve cannot close it.- Only the pure logic is tested. We ran the span-walking, voting and window functions against hand-built traces. The HTTP calls and the paging client are not exercised, so try it against a staging org first.
- Pages carry evidence. The page includes the alerting service, the origin tally and
client_url, so the receiving team can see why they were paged and disagree with it.
Where it goes wrong, and how it cuts alert noise
A triage service routes a page more accurately. It does not reduce how many alerts fire. The ways it fails are worth knowing before you trust it:
- Sampling drops the traces you need. If your pipeline samples errors away, the lookup returns nothing and every page falls back. Our post on consistent probability sampling covers how fragmented traces happen, and keeping error traces is the fix to check first.
- Retries, queues and shared databases blur the origin. Retries can make one dependency the deepest error for unrelated callers. A queue consumer’s span is often linked to its producer rather than parented to it, so the walk stops at the queue. A shared database can look like the culprit for every caller.
- Traces disagree. The tally in the sketch picks the majority service and shows the split in the evidence. A 12 to 8 split is a different page from a 20 to 0 split, so show the numbers.
Where it does cut alert noise is the pages nobody should have received. If four teams are paged for one payments timeout, routing by origin means one team is paged and the other three are only notified. Our post on battling alert fatigue covers grouping dependent alerts, and paging the owning team is the next step after the grouping. Treat any claim about how much noise this removes as something to measure on your own alerts: we have no figure to offer.
Keep a human in the loop
Automatic routing is a guess with evidence attached, so build the safety nets in:
- Page the owner, notify the alerting team. The checkout team still hears about the alert, as information, not a page. If the guess is wrong, they are already awake to correct it.
- Use acknowledgement to record who took it. The Acknowledge Alerts docs describe one acknowledging owner per alert rule in the Alert Monitor. An acknowledgement records the owner and does not stop notifications, so a mute is a separate choice.
- Review misroutes weekly. Each misroute is either a missing map entry, a sampling gap or a span that was marked on the wrong service. Fix the map or the instrumentation, not the triage code.
If you want to go the other way and let Last9 AI do the investigating from the alert thread, the no-code path above is where to start. The custom service is for teams that have decided the routing must be automatic.
FAQ
What is automated alert triage?
Automated alert triage is code that takes a firing alert, gathers the context a responder would look up by hand (which services failed, in which time window, who owns them), and decides who gets paged. In this post that means reading the alert webhook, finding the origin span in your traces, and paging the team that owns that service.
Why does rule-based alert routing page the wrong team?
Rule-based routing matches labels on the alert, such as team: frontend, so it pages whichever service the alert fired on. When a downstream service causes the failure, the alert still fires on the first hop that users and probes touch, so the wrong team is paged.
Does the Last9 alert webhook include a trace ID?
Not for metric alerts. The payload carries the alert group labels and a metric_alert_timing start and end, so a triage service looks traces up by service and time window. Log alerts also send log_lines, and if those lines carry a trace_id you can go straight to the trace.
How do you find the root-cause service from a trace?
Fetch the trace, keep the spans with an error status, and take the deepest one by walking ParentSpanId links to the root. Its ServiceName is the candidate culprit. If that span is a client call, the failing service is usually its callee, because the callee’s own span can stay unset.
What if traces are sampled or missing for the alert window?
Fall back to the alerting service’s own team and say in the page that no origin span was found. Sampling can drop the traces you need, so check your sampling policy for error traces before trusting automatic routing.
Where should the service-to-team ownership map live?
In version control, outside the triage code, so a team change is a reviewed pull request and not a redeploy. Last9 does not define an ownership field for this, so the example keeps the map in a plain file you own.


