

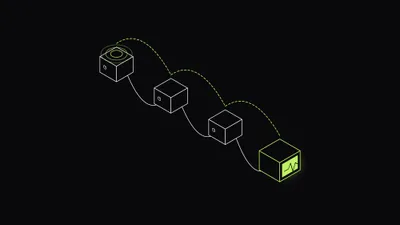
Automated Alert Triage: Route Alerts to the Root-Cause Team
Rule-based routing pages the service that errored. Build a small triage service that reads the alert webhook, finds the origin span in your traces and pages the team that owns it.

Last9
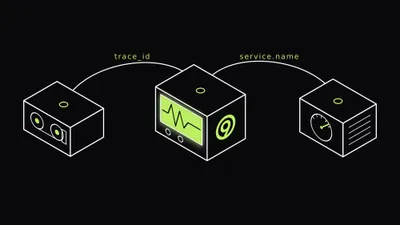
Correlating Logs, Traces and Metrics to Find Root Cause
Correlate logs, traces and metrics with trace_id, span_id, exemplars and shared resource attributes, then pivot from an alert to the root cause.
Last9
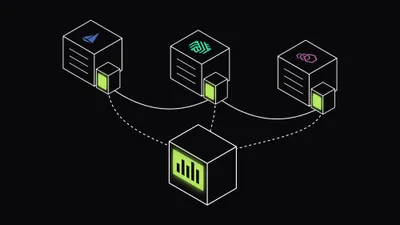
Service Mesh Observability: Istio, Linkerd and Envoy Metrics
Service mesh observability guide: the metrics Istio, Linkerd and Envoy proxies emit, what ambient mode changes, and why tracing still needs app changes.

Sejal Pandey
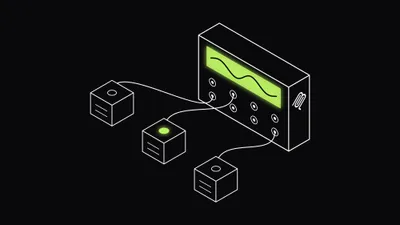
MCP Server Monitoring: Tracing Tool Calls with OpenTelemetry
MCP server monitoring guide: spans, metrics and logs to record for tool calls, why failed tools look healthy, and how to trace requests from client to server.
Sejal Pandey
RAG Pipeline Observability: What to Trace at Every Stage
RAG pipeline observability guide: the spans, attributes and metrics to record for embedding, retrieval, reranking and generation, plus evals for bad answers.
Sejal Pandey
Capturing HTTP Request and Response Bodies in .NET Traces with PHI Redaction
> Standard OTel .NET instrumentation captures headers, status codes, and timing — not request or response bodies. Here's how to add body capture to your traces while keeping PHI out of your observability backend.

Prathamesh Sonpatki
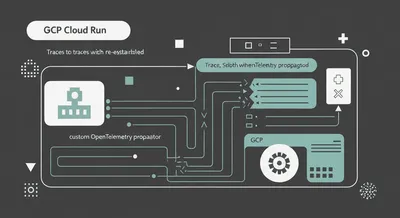
Fixing Broken Traces in GCP Cloud Run: A Custom OpenTelemetry Propagator
GCP's load balancer silently rewrites your traceparent header, orphaning spans in any OTLP backend. Here's the custom propagator that fixes it.
Prathamesh Sonpatki

What is LLM Observability? A Complete Guide (with OpenTelemetry)
> LLM observability is the practice of tracking what goes into an LLM, what comes out, and everything in between — latency, token usage, errors, and model behavior — so you can debug, optimize, and trust AI applications in production.
Prathamesh Sonpatki