


Podman vs Docker 2026: Security, Performance & Which to Choose
Podman vs Docker: Explore key differences in architecture, security, and tooling to choose the right containerization tool for your needs.
Anjali Udasi

Datadog Pricing 2026: Full Cost Breakdown + How to Save 40-90%
See real Datadog pricing for Infrastructure, APM, Logs & Security. Learn the hidden costs that inflate bills and 4 proven ways to cut your observability spend by 40-90%.
Anjali Udasi

Which Observability Tool Helps with Visibility Without Overspend
A detailed look at observability platforms so you can choose tools that keep visibility high and costs steady as your systems scale.
Anjali Udasi

9 Monitoring Tools That Deliver AI-Native Anomaly Detection
A technical guide comparing nine observability platforms built to detect anomalies and support modern AI-driven workflows.
Anjali Udasi

Top 9 Web Application Performance Monitoring Tools for 2025
Explore 2025’s top APM tools — from open-source stacks to enterprise platforms — and see how each helps you monitor smarter.
Anjali Udasi

Grafana Tempo: Setup, Configuration, and Best Practices
A practical guide to setting up Grafana Tempo, configuring key components, and understanding how to use tracing across your services.
Anjali Udasi

Top 11 Ruby APM Tools for 2025: A Performance-Driven Selection
Explore the top Ruby APM tools for 2025 — from open-source to enterprise — to monitor, trace, and optimize your app’s performance.
Anjali Udasi

Choosing the Right APM for Go: 11 Tools Worth Your Time
Explore 11 APM tools built for Go—from lightweight open-source options to enterprise-grade platforms that simplify debugging.
Faiz Shaikh

Top 11 Java APM Tools: A Comprehensive Comparison
Compare 11 top Java APM tools, from open-source options to enterprise platforms, and find the best fit for your applications.
Anjali Udasi

Top 12 LogicMonitor Alternatives for Developers in 2025
LogicMonitor fits traditional infra, but for microservices, high-cardinality data, and Kubernetes, these 12 alternatives work better.
Faiz Shaikh

Elasticsearch with Python: A Detailed Guide to Search and Analytics
Know how to use Elasticsearch with Python for indexing, searching, and analyzing data, complete with code, tips, and integration examples.
Anjali Udasi

11 Best Log Monitoring Tools for Developers in 2025
A technical comparison of 11 log monitoring tools developers use in 2025—features, trade-offs, pricing, and platform compatibility
Anjali Udasi

Graylog vs ELK: Which Log Management Solution Fits Your Stack?
Graylog or ELK? Discover which log management tool fits your team’s needs, from quick setup to deep customization.
Faiz Shaikh

Jaeger vs Zipkin: Which is Right for Your Distributed Tracing
Compare Jaeger and Zipkin to find the best fit for your distributed tracing needs, infrastructure, and observability goals.
Anjali Udasi

Graylog vs Loki: Key Differences and Use Cases
Graylog and Loki offer different logging approaches—full-text search vs. label-based indexing—for varied needs and scale. Know more here!
Anjali Udasi

OpenTelemetry vs Micrometer: Here’s How to Decide
Trying to pick between OpenTelemetry and Micrometer? Here’s a clear look at how they differ and where each one fits best.
Anjali Udasi

Grafana Tempo vs Jaeger: Key Features, Differences, and When to Use Each
Grafana Tempo vs Jaeger: Understand how they differ in storage, querying, and setup—so you can choose the right tracing tool for your stack.
Anjali Udasi

Top 11 Application Logging Tools for DevOps Engineers in 2025
Explore the top 11 logging tools of 2025—compare features, use cases, and pricing to find the perfect fit for your DevOps observability stack.
Faiz Shaikh

Zabbix vs Grafana: Which Monitoring Tool Fits You Best?
Comparing Zabbix and Grafana? Here's a no-fluff look at which monitoring tool fits your stack, your team, and your future needs.
Faiz Shaikh

Loki vs Prometheus: Side-by-Side Comparison for Logs and Metrics
Loki handles logs. Prometheus handles metrics. Here’s a side-by-side look at what they do, how they work, and when to use each.
Anjali Udasi

Getting Started with Elastic Load Balancer (ELB) Metrics
Learn the key ELB metrics that help you monitor traffic, spot issues early, and keep your load balancers running smoothly in production.
Anjali Udasi

How to Connect ELK Stack with Grafana
Learn how to connect ELK with Grafana to bring logs and dashboards together for better visibility across your systems.
Anjali Udasi

Comparing ELK, Grafana, and Prometheus for Observability
A clear-eyed look at ELK, Grafana, and Prometheus—how they handle logs, metrics, and alerts, and which one fits your observability goals best.
Anjali Udasi

9 Best Container Monitoring Tools You Should Know in 2025
Discover the 9 best container monitoring tools of 2025—optimize performance, track issues, and keep your infrastructure running smoothly!
Anjali Udasi

Breaking Down Splunk Costs for SREs and DevOps Teams
Explore Splunk's pricing and how it impacts SREs and DevOps teams. Learn how to manage costs while maintaining performance.
Anjali Udasi

Dynatrace vs. AppDynamics: 2025 Performance Monitoring Guide
Compare Dynatrace and AppDynamics in 2025—features, performance, and real-world usability to help you choose the right monitoring tool.
Anjali Udasi

Getting Started with Golang ORMs: A Beginner's Guide
Learn how Golang ORMs simplify database interactions, explore popular options, and get started with the right choice for your project.
Prathamesh Sonpatki

Apache Monitoring: Setup Guide, Tools, and Best Practices
Learn how to monitor Apache effectively with this guide on setup, essential tools, and best practices for performance optimization.
Anjali Udasi

Your 2025 Guide to the 11 Best Infrastructure Monitoring Tools
Discover the top 11 infrastructure monitoring tools for 2025, from open-source to fully managed solutions, and find the best fit for your stack.
Anjali Udasi

Top 13 Kafka Monitoring Tools You Should Know
Discover the top 13 Kafka monitoring tools for efficient observability, real-time insights, and optimal performance in your data streams.
Anjali Udasi

OpenTelemetry vs. ELK: Key Differences and When to Use Each
Compare OpenTelemetry and ELK to understand their key differences, use cases, and when to use each for effective observability and logging.
Anjali Udasi

Helm vs Terraform: A Detailed Comparison for Developers
Helm and Terraform are powerful tools for managing Kubernetes applications and infrastructure, each serving distinct roles in DevOps workflows.
Anjali Udasi

An Easy Guide to OpenFeature Flagging
Learn how to get started with OpenFeature flagging and manage feature rollouts seamlessly in this easy-to-follow guide.
Anjali Udasi

Elastic vs. Splunk: Which One Is Right for You?
Compare Elastic and Splunk on pricing, scalability, and features to find the best fit for your log management and observability needs.
Anjali Udasi

Everything You Need to Know About Microsoft Sentinel Pricing
Learn how Microsoft Sentinel pricing works, including cost-saving models, data retention fees, and optimization strategies.
Anjali Udasi

A Comprehensive Guide to Heaps in Java
Explore heaps in Java with this comprehensive guide, covering core operations, memory management, and essential concepts for developers.
Preeti Dewani

Apache Solr: Features, Architecture, and Use Cases
Explore Apache Solr’s features, architecture, and use cases to understand how it powers fast, scalable, and flexible search solutions.
Anjali Udasi
Sentry vs Datadog: Which is the Right Tool for Your DevOps Needs
Sentry is perfect for error tracking, while Datadog offers full-stack observability. Choose based on your DevOps needs and system complexity.
Anjali Udasi

10 Kubernetes Monitoring Tools You Can't-Miss in 2025
Discover the top 10 Kubernetes monitoring tools in 2025 that help optimize performance, ensure reliability, and provide comprehensive observability.
Anjali Udasi

Top 11 API Monitoring Tools You Need to Know
Discover 11 top API monitoring tools to track performance, uptime, and reliability—helping you keep your APIs running smoothly.
Anjali Udasi
![Website Performance Benchmarks: What You Should Aim For [with Examples]](https://last9.ghost.io/content/images/2025/02/monitoring-927906281a0979ff.webp)
Website Performance Benchmarks: What You Should Aim For [with Examples]
Learn how to set realistic website performance benchmarks with examples, and discover what goals you should aim for to improve your site’s speed and UX.
Anjali Udasi

git fetch vs pull: Key Differences Explained
Learn the key differences between git fetch and git pull, and understand when to use each command for better control over your workflow.
Anjali Udasi

Your Go-To Git Commands CheatSheet
Master Git with this cheat sheet! Learn essential and advanced commands to simplify your workflow and fix mistakes.
Prathamesh Sonpatki

8 Leading Network Monitoring Tools for Enterprises
Explore 8 top network monitoring tools that help enterprises ensure performance, reliability, and security across their networks.
Anjali Udasi

SIEM Architecture: Key Components, Integrations, and More
Explore the key components, integrations, and best practices for building a resilient SIEM architecture to safeguard your organization’s security.
Anjali Udasi

Apdex Score 101: Definition, Calculation, and Limitations
Learn what the Apdex score is, how to calculate it, and its limitations. A quick guide to measuring user satisfaction effectively.
Anjali Udasi

A Complete Guide to Threat Hunting: Tools and Techniques
Discover everything you need to know about threat hunting, including the best tools and techniques to keep your organization safe from cyber threats.
Anjali Udasi

How to Use the Laravel Scheduler for Task Management
Learn how to automate and manage your tasks efficiently with the Laravel Scheduler, making repetitive processes easier to handle in your app.
Anjali Udasi

Getting Started with Bun.js: A Quick Guide
Learn how to quickly get started with Bun.js, a fast and efficient JavaScript runtime, and optimize your development workflow.
Prathamesh Sonpatki

How to Build a Cloud Strategy That Works for Your Business
Learn to craft a cloud strategy tailored to your business—align goals, optimize resources, and embrace the cloud confidently.
Anjali Udasi

Node.js Worker Threads Explained (Without the Headache)
Learn how Node.js worker threads can boost performance by offloading tasks to background threads—simple, efficient, and headache-free!
Prathamesh Sonpatki

Cloudcraft: A Simple Tool for Cloud Architecture Design
Cloudcraft simplifies cloud architecture design with an easy-to-use interface, helping you visualize and plan your cloud infrastructure.
Anjali Udasi

7 Best DigitalOcean Alternatives for Developers in 2025
Discover the top 7 DigitalOcean alternatives for developers in 2025, offering scalability, advanced features, and cost-effective solutions.
Anjali Udasi

gRPC vs HTTP vs REST: Which is Right for Your Application?
Explore the key differences between gRPC, HTTP, and REST to choose the best protocol for your application's performance and scalability.
Anjali Udasi

Splunk vs. Datadog: A Side-by-Side Comparison
Compare Splunk and Datadog in this detailed guide to understand their features, strengths, and key differences for your monitoring needs.
Anjali Udasi

npm Commands Cheatsheet: List, Install, Update & Troubleshoot
Complete npm cheatsheet with commands for listing packages, installing dependencies, fixing errors, and managing versions. Copy-paste examples for npm list, npm outdated, npm update & more.
Preeti Dewani

What Makes Azure WAF Essential for Web Apps?
Discover why Azure WAF is crucial for securing web applications, with features like bot protection, DDoS defense, and customizable security rules.
Anjali Udasi

Monolithic vs. Microservices: The Great Architecture Debate
Explore the pros and cons of monolithic vs. microservices architectures to find the best fit for your project's needs and scalability.
Anjali Udasi

Why You Need Server Monitoring Tools and How to Choose
Discover the importance of server monitoring tools and how to choose the best one to optimize performance, prevent downtime, and ensure security.
Anjali Udasi

Top 5 Firebase Alternatives for 2024: Best Picks
Explore the top 5 Firebase alternatives for 2024, offering flexibility, scalability, and ease of use to meet your app development needs.
Anjali Udasi

Linux Syslog Explained: Configuration and Tips
Learn how to configure and manage Linux Syslog for better system monitoring, troubleshooting, and log management with these helpful tips.
Faiz Shaikh

The Best Heroku Alternatives for Developers in 2024
Discover the top Heroku alternatives in 2024 with options for scalability, pricing, and flexibility to suit your development needs.
Anjali Udasi

The Best Linux Monitoring Tools for 2024
Discover the top Linux monitoring tools for 2024 to optimize performance, prevent downtime, and keep your systems running smoothly.
Anjali Udasi

A Guide to Database Optimization for High Traffic
Learn how to optimize your database for high traffic, ensuring performance, scalability, and reliability under heavy load.
Prathamesh Sonpatki

Datadog vs Dynatrace: A Comprehensive Comparison
Compare Datadog and Dynatrace to find the right observability solution for your team, balancing flexibility, scalability, and automation.
Anjali Udasi
MongoDB vs Elasticsearch: Key Differences Explained
Learn the key differences between MongoDB and Elasticsearch, and understand when to use each for your database and search needs.
Anjali Udasi

Fluentd vs Fluent Bit – A Comprehensive Overview
Fluentd vs Fluent Bit: Discover the key differences, use cases, and how to choose the right tool for your log processing needs.
Prathamesh Sonpatki
Anjali Udasi

Top 5 Open Source SIEM Tools for Security Monitoring
Explore open-source SIEM tools to enhance your security monitoring. Learn about features, deployment, and how they compare to commercial solutions.
Anjali Udasi

Filebeat vs Logstash: Key Differences for Your Logging Needs
Explore the key differences between Filebeat and Logstash to choose the right tool for your logging setup and optimize performance.
Anjali Udasi
Kibana vs Grafana: Key Differences and Use Cases
Kibana and Grafana offer unique strengths: Kibana excels in log analysis, while Grafana shines in time-series data and infrastructure monitoring.
Anjali Udasi

Extracting Account-Level CDN Metrics from Akamai Logs with Last9
Learn how to extract and analyze account-level CDN metrics from Akamai logs using Last9 for real-time insights and better customer tracking.
Prathamesh Sonpatki
Aditya Godbole

Your Guide to the 7 Best Tracing Tools in Observability
Discover the top tracing tools in observability to monitor, analyze, and troubleshoot your systems for better performance and reliability.
Anjali Udasi

What is ELK: Core Components, Ecosystem & Setup Guide
Learn about the ELK Stack’s core components, extended ecosystem, and setup guide for efficient log management and data analysis.
Anjali Udasi

9 Datadog Alternatives Worth Considering in 2026
Explore eight options for different monitoring needs and budgets. Whether for microservices or APM, these alternatives enhance observability affordably.
Anjali Udasi
Prometheus Alternatives: Monitoring Tools You Should Know
What are the alternatives to Prometheus? A guide to comparing different Prometheus Alternatives.
Gabriel Diaz

Top 10 Platform Engineering Tools in 2024
Check out these 10 tools that are making a real difference in how teams build, manage, and scale their platforms in 2024.
Prathamesh Sonpatki

2024's Best Cloud Monitoring Tools: Updated Insights
Get a detailed look at the top cloud monitoring tools of 2024. Compare leading solutions to understand their features and performance, helping you choose the best fit for your cloud infrastructure.
Anjali Udasi
Rethinking Anomaly Detection: Focus on business outcomes
From the trenches at Games24x7 — Sanjay, on how Reliability engineering should drive core business metrics
Sanjay Singh
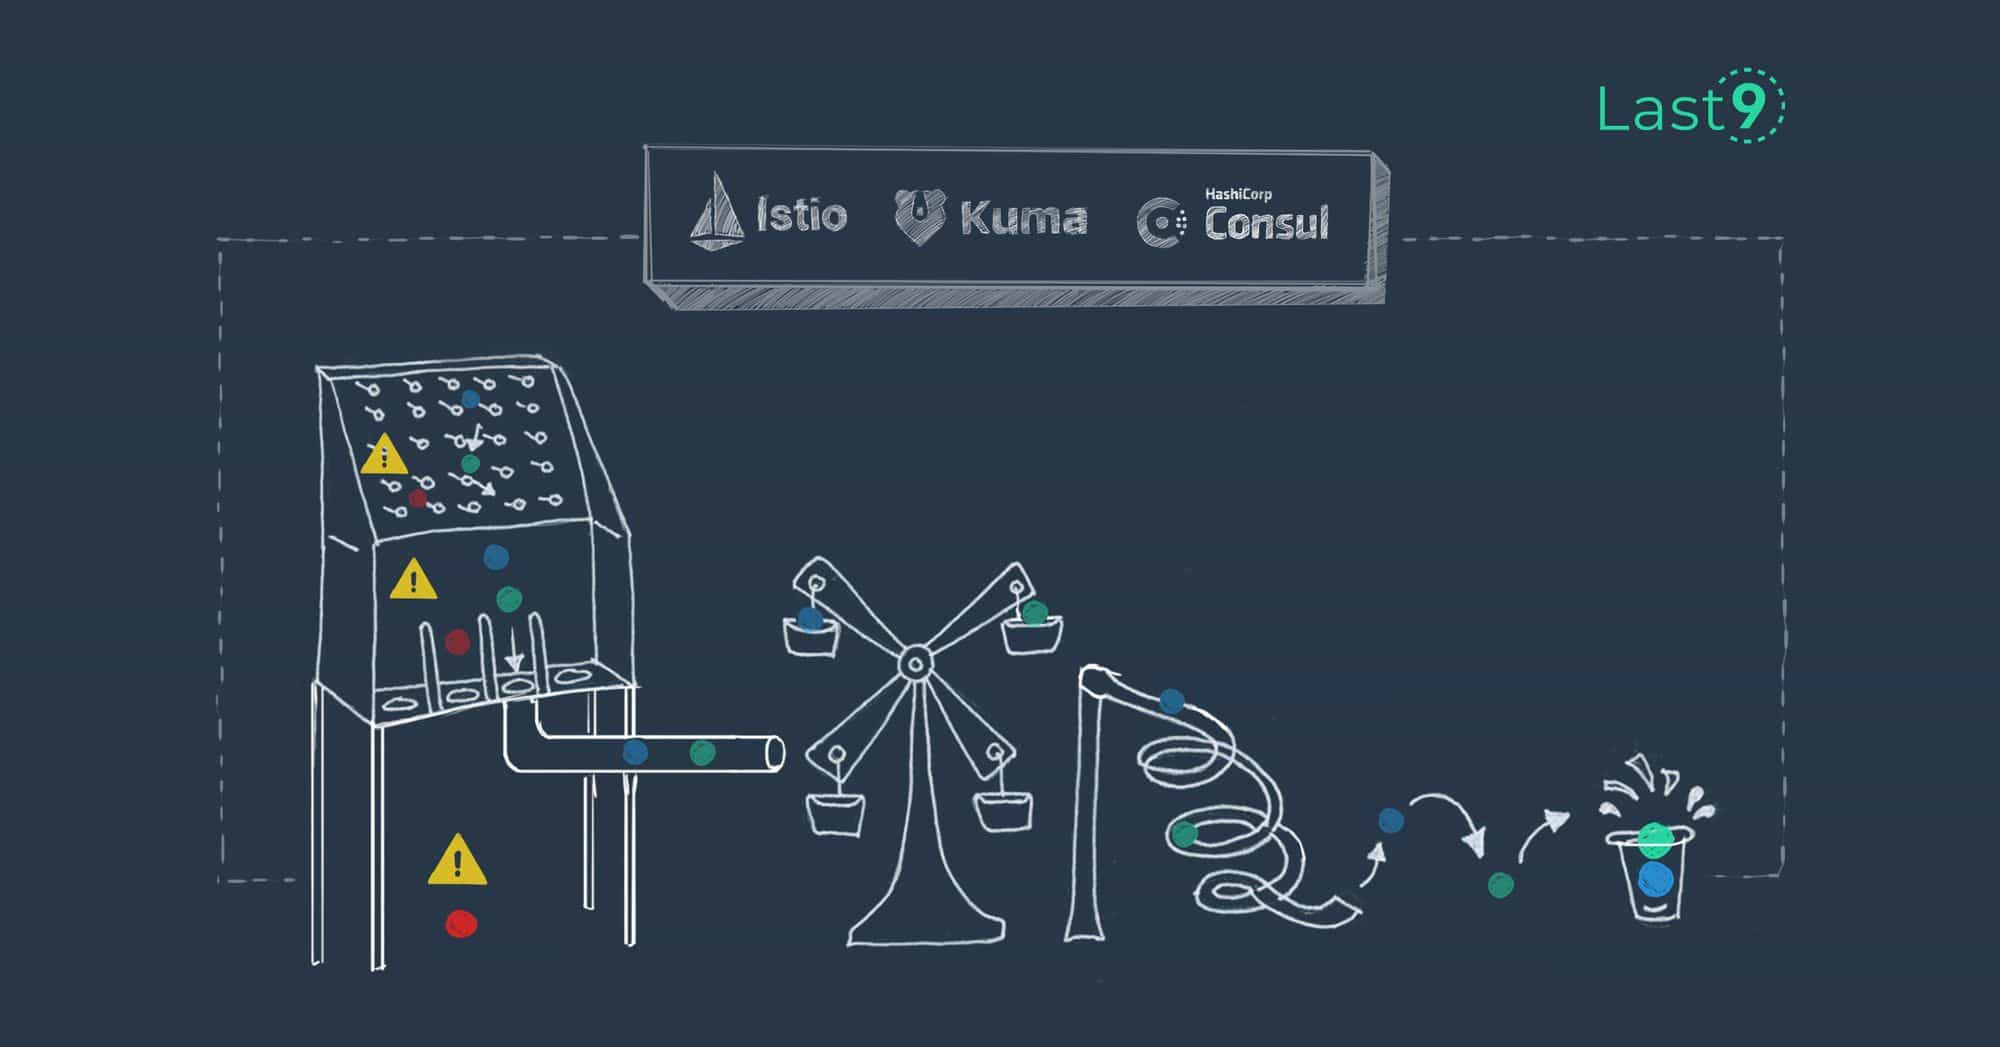
Comparing Popular Service Mesh Offerings
An in-depth look at several service mesh offerings and comparison based on their features, licensing and pricing, architecture, and user experience.
Last9
Introducing Levitate: Uplift Your Metrics Management
Managing time series databases is hard. We've evolved to services, yet monitoring lags. Our solution powers critical workloads at a lower cost.
Nishant Modak

Battling Alert Fatigue
What is Alert Fatigue and techniques to reduce it
Last9
SLOs, SLIs, and SLAs: Understanding Key Service Metrics
A guide to set practical Service Level Objectives (SLOs) & Service Level Indicators (SLIs) for your Site Reliability Engineering practices.
Last9

Sample vs Metrics vs Cardinality
When dealing with Time Series databases, I always got confused with Sample vs Metrics vs Cardinality. Here’s an explanation as I have understood it.
Piyush Verma
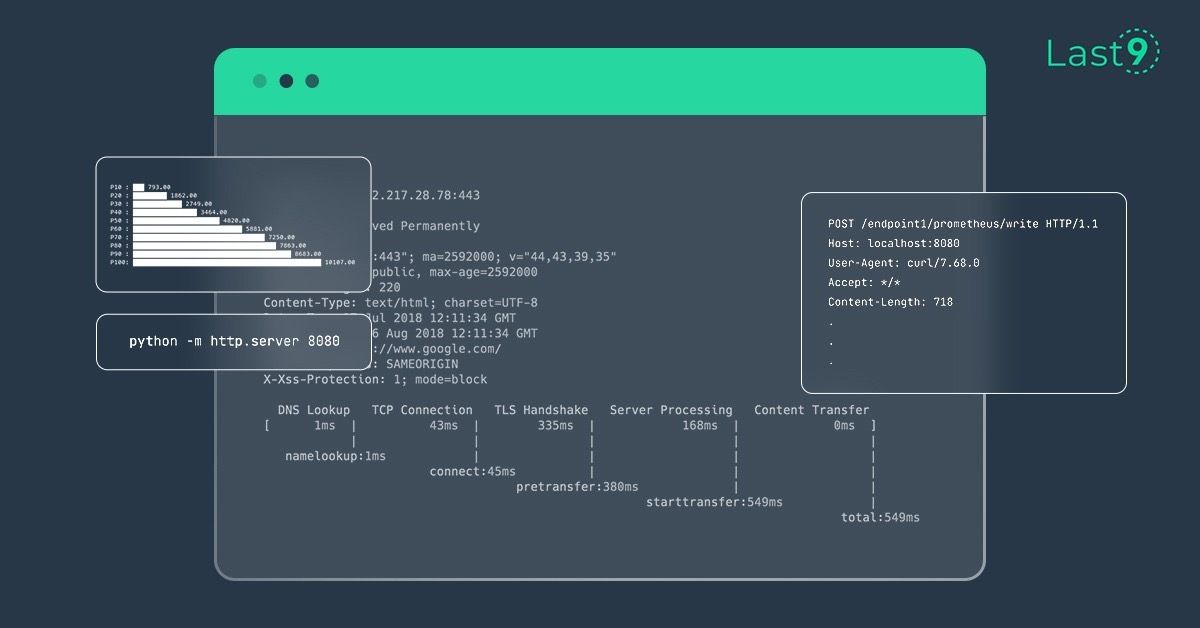
How to calculate HTTP content-length metrics on cli
A simple guide to crunch numbers for understanding overall HTTP content length metrics.
Saurabh Hirani

Comparing Popular Time Series Databases
A comparison of all the popular time series databases. Prometheus, Influx, M3Db, Last9.
Abhi Puranam
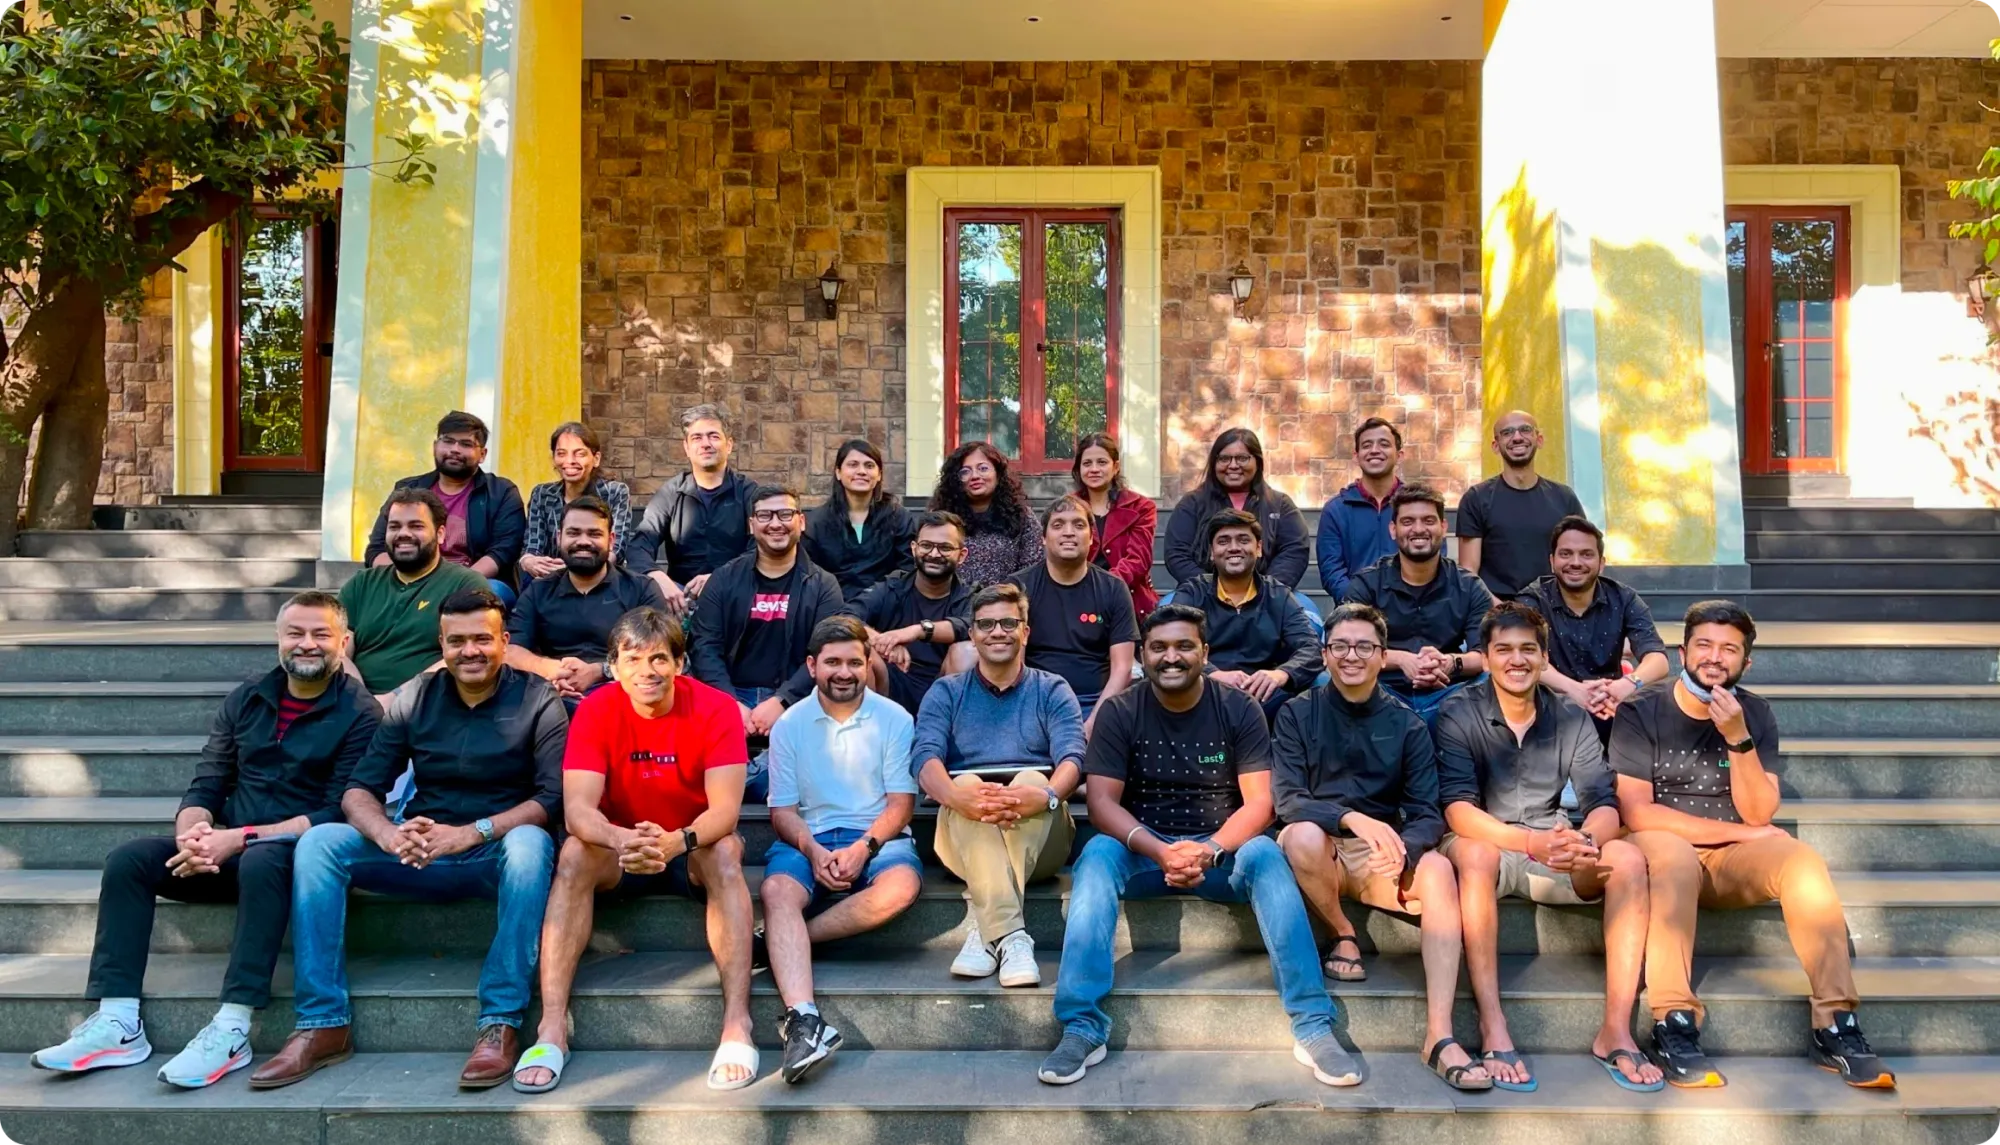
We’ve raised a $11M Series A led by Sequoia Capital India!
Exciting news! We've secured an $11M Series A funding round led by Sequoia Capital India to fuel our growth and innovation at Last9!
Nishant Modak

How to Improve On-Call Experience!
Better practices and tools for management of on-call practices
Prathamesh Sonpatki

Best Practices for Postmortems: A guide
The ins and outs of conducting an effective postmortem. Ready templates and examples from leading organizations around the world!
Prathamesh Sonpatki

Choosing Effective SLIs
Practical advice to choose an effective SLI.
Akshay Chugh

The origin of Service Level Objectives
Service Level Objectives (SLOs) dominate the software industry, but where did they come from?
Akshay Chugh
Piyush Verma

Latency SLO
How do you set latency-based alerts? A common approach is 95% of requests completed in 350ms, but is it really that simple?
Piyush Verma
Services; not Server
Gone are the days of yore when we named are our servers Etsy, Betsy, and Momo, fed them fish, and cleaned their poop.
Nishant Modak
Piyush Verma

Much That We Have Gotten Wrong About SRE
An illustrated summary of Developers ➡ DevOps ➡ SRE
Piyush Verma

Latency Percentiles are Incorrect P99 of the Times
What are P90, P95, and P99 latency? Why are they incorrect P99 of the times? Latency is for a unit of time and the preferred aggregate is percentile.
Piyush Verma
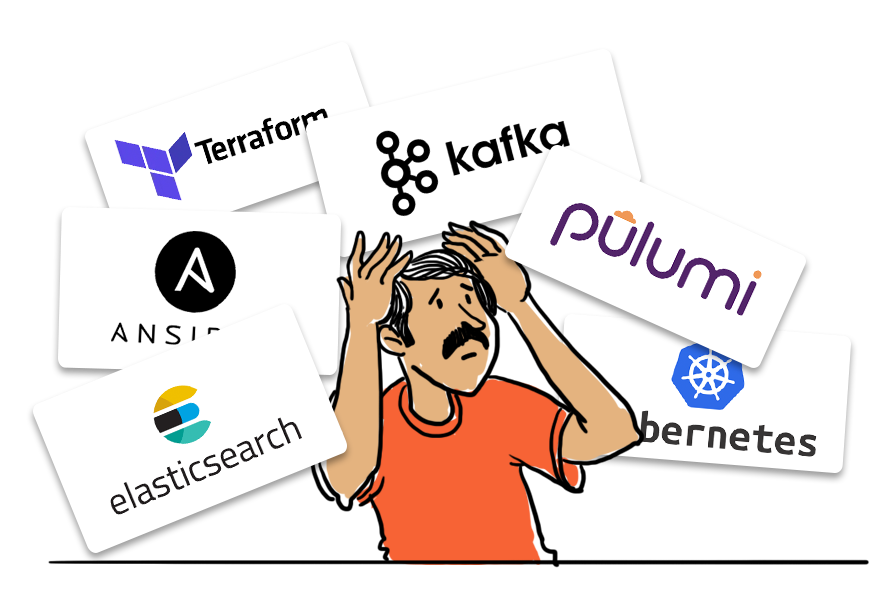
SRE Tooling – the Clever Hans fallacy
Chef or Ansible? Terraform or Pulumi? Python or Ruby? Last9 or Last9? Discover how building new tools links to the tale of a horse that could do math!
Piyush Verma