
Traces Query Builder
Visual query builder to filter, aggregate, and analyze traces without writing TraceQL
The Traces Query Builder provides a visual interface for constructing trace analysis queries through operation stages. Each stage represents a specific data manipulation function, allowing you to build complex queries without writing TraceQL syntax.
Accessing the Query Builder
Navigate to Traces in Last9 and use the Span or Trace tabs to begin building queries.
Understanding Trace vs Span Mode
The Query Builder operates in two distinct modes that determine how results are displayed and what operations are available:
Trace Mode shows root spans of traces matching your query criteria:
- The results table displays one entry per trace (showing the root span)
- Clicking a result reveals the complete trace with all its spans
- Useful for understanding full request flows and overall trace characteristics
- Limited to FILTER operations only
Span Mode shows the exact spans matching your query criteria:
- The results table displays individual spans as separate entries
- Multiple spans from the same trace can appear as different rows
- Clicking a result shows a truncated view focused on the matching span, its children, and sibling spans from the same service
- Essential when you need to see specific spans in results (e.g., when querying particular span names or using negative filters)
- Enables advanced query capabilities: Click ADD STAGE to access AGGREGATE and TRANSFORM operations, create visualizations, save queries to dashboards, and set up streaming aggregations—all powered by TraceMetrics
Core Stages
Filter
The FILTER stage allows you to narrow down traces and spans based on specific conditions using various operators:
Supported Operators:
- =: Exact match
- !=: Not equal to
- exists: Field exists with any value
- not exists: Field does not exist
- contains: String contains substring
- not contains: String does not contain substring
- matches: Matches a pattern/regular expression
Parameters:
- Field name: The span or trace attribute to filter on
- Operator: One of the supported operators
- Value: The comparison value or pattern (not required for exists operators)
A single field and operator can have multiple values. These values are “ORed” together. To achieve AND logic, use multiple filter stages.
Examples:
Service Name existsTrace Status = STATUS_CODE_ERRORhttp.method != POSTspan.name contains "database"user.id matches "user-[0-9]+"Aggregate
The AGGREGATE stage supports various statistical computations with optional grouping and timeslicing:
-
Zero or One Argument Functions:
- count
- Usage without argument:
count as total_count - Usage with argument:
count field_name as field_count
- Usage without argument:
- count
-
Single Argument Functions:
-
sum: Calculate sum of values
-
min: Find minimum value
-
max: Find maximum value
-
avg: Calculate average
-
median: Find median value
-
stddev: Calculate sample standard deviation
-
stddev_pop: Calculate population standard deviation
-
variance: Calculate sample variance
-
variance_pop: Calculate population variance
-
Usage Syntax:
function_name field as result_name
-
-
Two Argument Functions:
-
quantile: Calculate approximate quantile (value between 0 and 1)
-
quantile_exact: Calculate exact quantile (value between 0 and 1)
-
Usage:
quantile(0.99, duration) as p99_duration
-
Additional Features:
- groupby: Group results by specified fields, similar to SQL GROUP BY
- Example:
groupby Service Name as service_name
- Example:
- timeslice: Define time bucket intervals for time-series aggregation
- When specified, creates time-series visualization
- Without timeslice, displays only table view
- Example:
timeslice 15 minutes
Example Query:
count as _countgroupby Service Name as service_nametimeslice 15 minutesTransform
The TRANSFORM stage provides data transformation methods for manipulating span and trace attributes:
-
split
-
Parameters:
- from: Source field
- on: Delimiter character
- select part: Part number to select (0-indexed)
- as: Output field name
-
Example:
split from http.url on / select part 2 as endpoint
-
-
splitInto
-
Parameters:
- from: Source field
- on: Delimiter character
- into: Comma-separated list of output field names
-
Example:
splitInto from trace.id on - into region, service, request_id
-
-
replaceRegex
-
Parameters:
- from: Source field
- pattern: Regex pattern to match
- with: Replacement string
- as: Output field name
-
Example:
replaceRegex from user.email /[<>]/ with - as sanitized_email
-
-
concat
-
Parameters:
- from: First field to concatenate
- Additional fields/literals to concatenate
- as: Output field name
-
Example:
concat http.method, ' ', http.route as full_endpoint
-
-
join
-
Parameters:
- field: Field to join
- separator: String to use between values
- as: Output field name
-
Example:
join error.type , as error_types
-
-
if
-
Parameters:
- Condition:
isEqual,!isEqual,isEmpty,!isEmpty - then: Value if condition is true
- else: Value if condition is false
- as: Output field name
- Condition:
-
Example:
if isEmpty error.message then 'No Error' else error.message as error_display
-
Visualization Modes
The Query Builder provides two visualization modes:
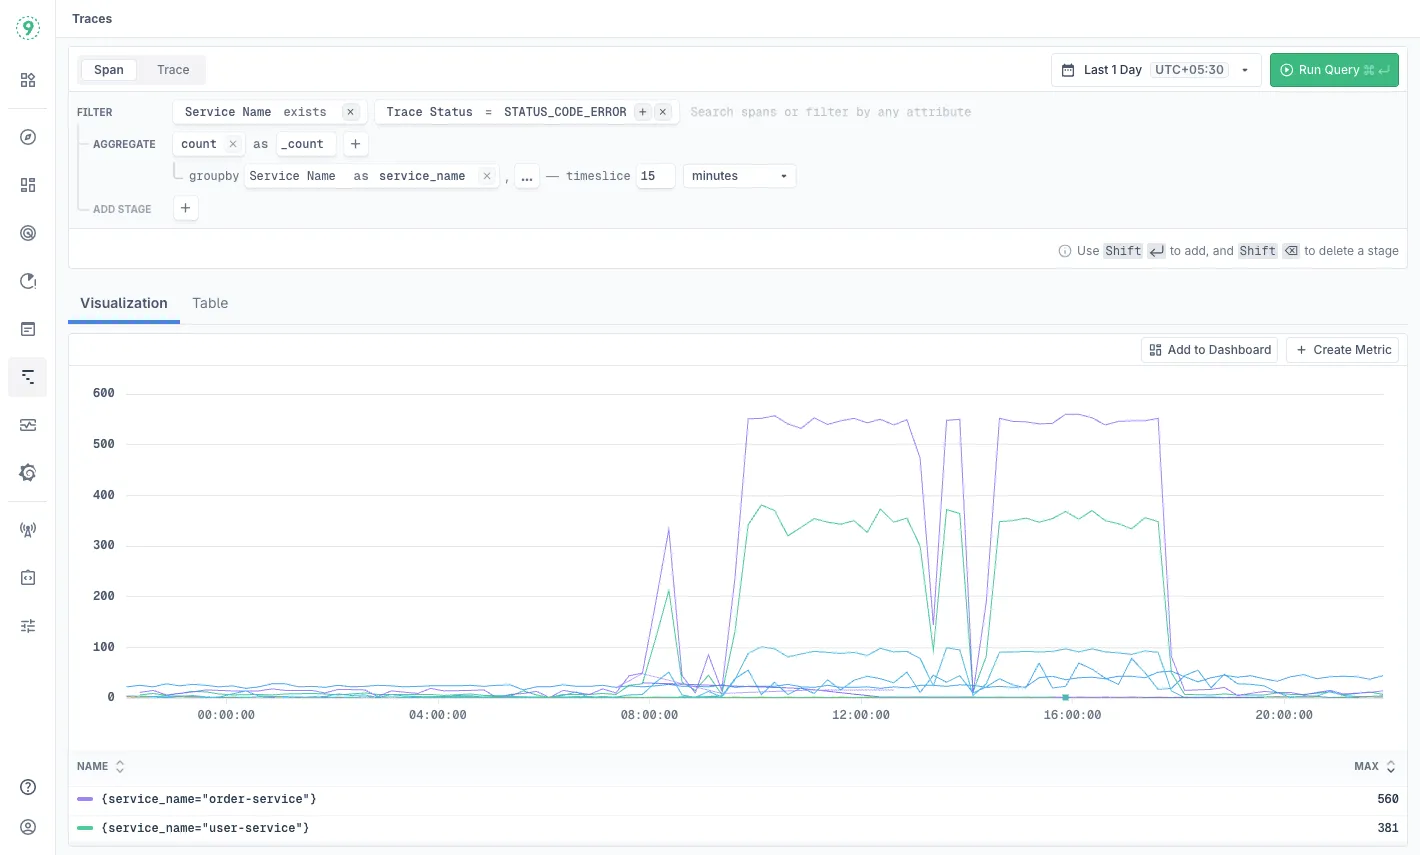
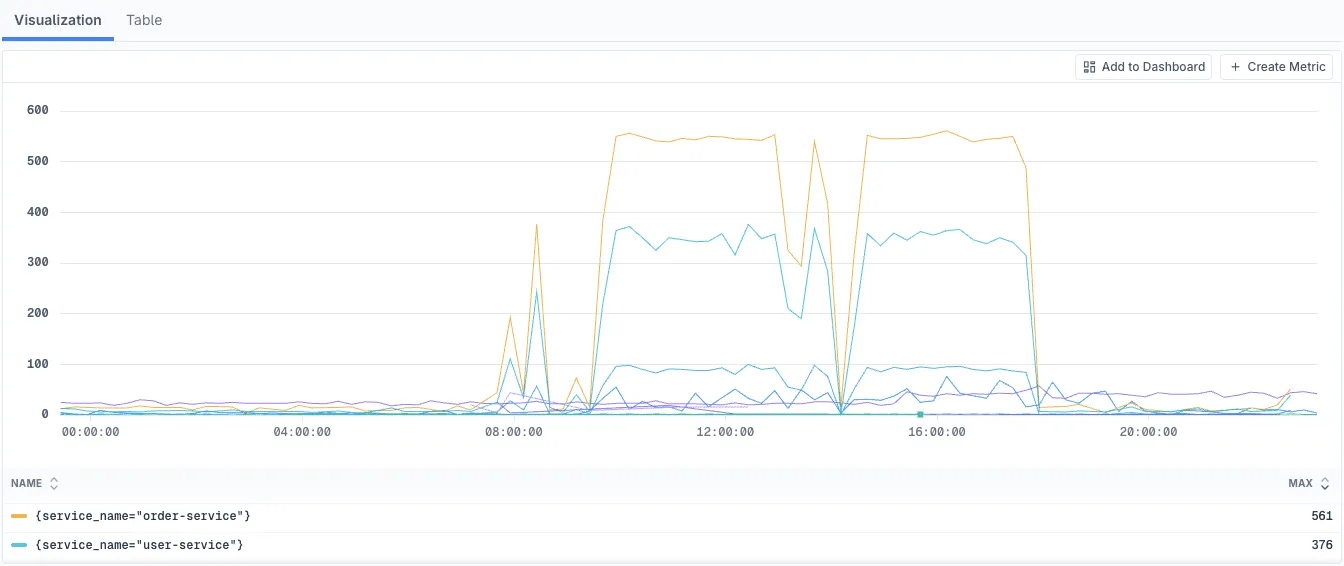
Visualization (Chart)
Time-series chart visualization is displayed when your query includes a timeslice parameter in the AGGREGATE stage. This mode shows trends over time and is ideal for monitoring patterns and anomalies.
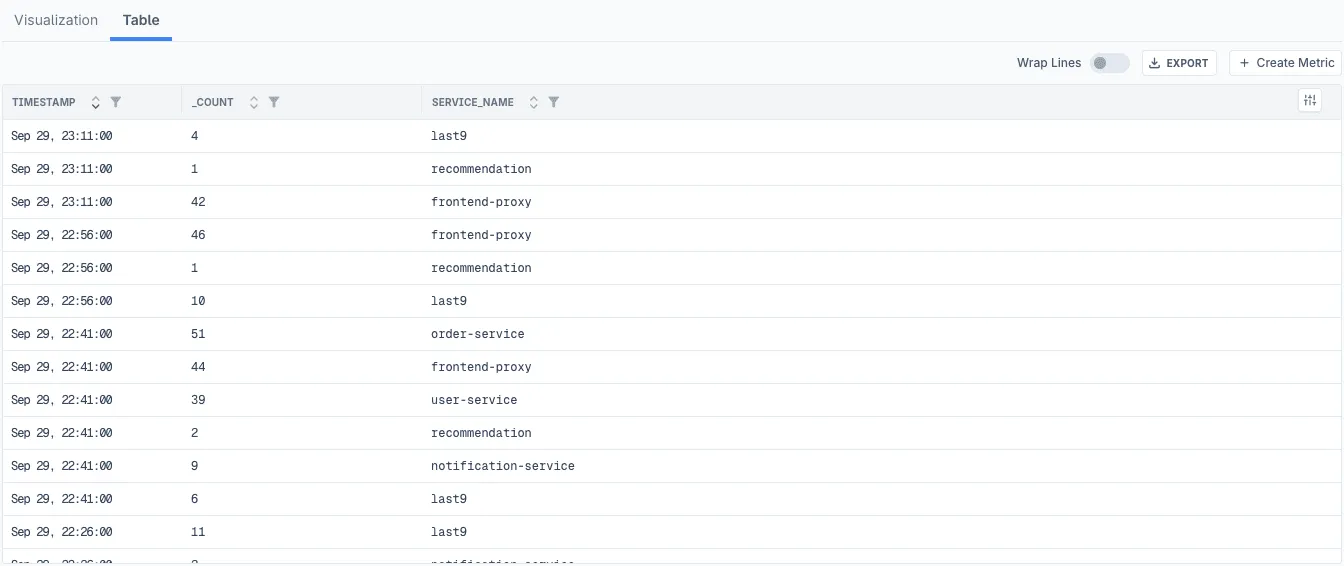
Table
Table view displays aggregated results in tabular format. This is the only view available when no timeslice is specified, or you can switch to it manually when both modes are available.
Query Construction Best Practices
-
Operation Order
- Start with FILTER operations to reduce data volume early
- Apply TRANSFORM operations to prepare fields for aggregation
- Use AGGREGATE operations last to summarize data
- Apply additional FILTER stages after AGGREGATE to filter aggregated results
-
Field Naming
- Use descriptive names for output fields in
asclauses - Maintain consistent naming conventions (snake_case recommended)
- Avoid special characters in field names
- Use meaningful prefixes for grouped fields
- Use descriptive names for output fields in
-
Performance Optimization
- Keep time ranges reasonable (avoid queries spanning months)
- Filter on indexed fields like Service Name for faster execution
- Use
existsoperator for field presence checks rather than string matching - Filter early in the query chain to minimize data processing
- Use
=operator on Service Name for significantly faster query execution
-
Timeslice Guidelines
- Match timeslice intervals to your time range:
- 1-hour range: 1-5 minute intervals
- 1-day range: 5-30 minute intervals
- 1-week range: 1-4 hour intervals
- Shorter intervals provide more detail but slower queries
- Longer intervals are faster but may miss short-lived patterns
- Match timeslice intervals to your time range:
-
Error Prevention
- Use
existschecks before accessing optional fields - Validate regex patterns before using them (tools like regex101.com)
- Test queries on shorter time ranges before expanding
- Use
!isEmptychecks before transformations - When filtering by status (e.g.,
Trace Status = STATUS_CODE_ERROR), remember that filters apply at the span level in both modes - you may see traces marked “OK” that contain error spans
- Use
Using Query Builder with Streaming Aggregation
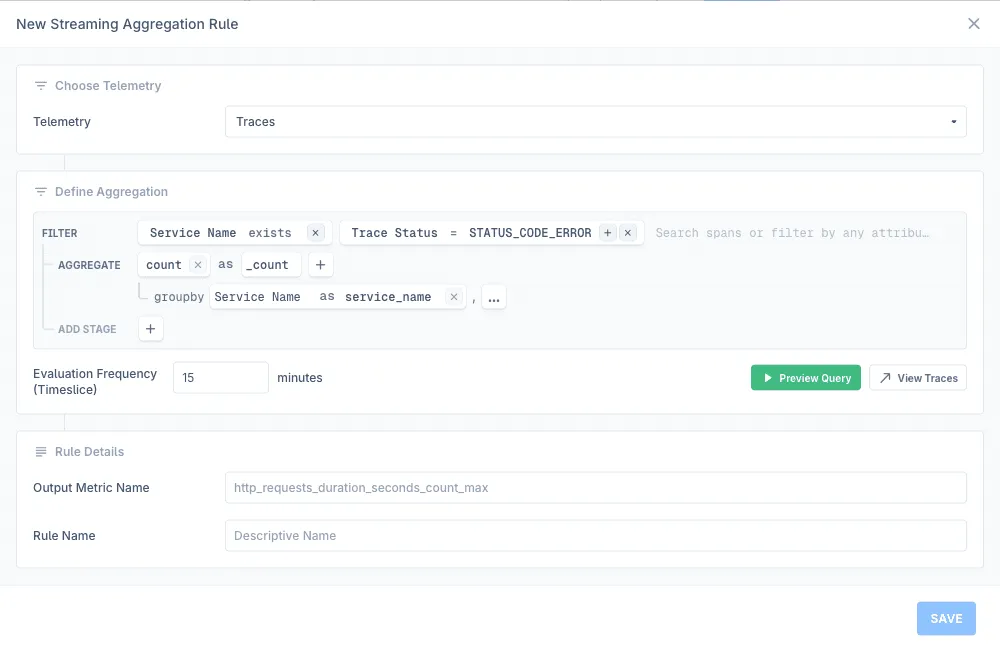
Queries built in the Query Builder can be saved as Streaming Aggregation rules to generate TraceMetrics and continuously compute metrics from your trace data. This is particularly useful for creating custom metrics without impacting query performance.
- Build your query in the Query Builder with FILTER and AGGREGATE stages
- Click Create Metric to open the Streaming Aggregation configuration
- Configure the evaluation frequency (timeslice) and provide a descriptive rule name
- Save the rule to begin generating metrics
Your saved query will now run continuously, creating metrics you can query without processing raw trace data. Learn more about Streaming Aggregation.
Field Handling
Common Trace Attributes
Access standard trace and span attributes using their exact names:
Service NameTrace Statushttp.methodhttp.status_codehttp.routeerror.typeerror.messagedurationCustom Attributes
Access custom attributes and tags added by your instrumentation:
user.idtenant.idfeature.flagenvironmentNested Fields
For nested attributes, use dot notation:
http.request.headers.user_agentresource.attributes.service.versionKeyboard Shortcuts
The Query Builder supports keyboard shortcuts for faster query construction:
- Shift + Enter: Add a new stage
- Shift + Delete: Remove the current stage
- Tab: Navigate between fields in a stage
Troubleshooting
Please get in touch with us on Discord or Email if you have any questions.