
Discover Services
Monitor and analyze service performance, operations, and dependencies across your infrastructure
The Services feature in Discover serves as Last9’s comprehensive Application Performance Monitoring (APM) solution, providing deep visibility into your application’s health, performance, and user experience. Monitor critical APM metrics including throughput, response times, error rates, and APDEX scores across all your services, with the ability to drill down into individual operations, traces, and dependencies.
This full-featured APM platform helps you proactively identify performance bottlenecks, track application health trends, and maintain optimal user experience across your entire service architecture.
Prerequisites
To fully utilize the Services APM capabilities, ensure you have the following integrations configured:
Required:
- Traces: Distributed tracing data is mandatory for service discovery, dependency mapping, and operation-level analysis. Configure OpenTelemetry or other tracing instrumentation for your applications. See all traces integrations.
Optional:
- Logs: Application and infrastructure logs provide detailed troubleshooting context. Configure log forwarding from your applications and infrastructure. See all logs integrations.
- Infrastructure Metrics: Container and host metrics enable infrastructure monitoring. Set up Docker or Kubernetes for container and host-level metric collection.
- Process Metrics: JVM and application runtimes such as Node.js provide deep process insights. Configure runtime metrics via OpenTelemetry SDK for Java and Node.js applications. See all Java integrations, See all Node.js integrations.
Without traces, the Discover Services feature will have limited functionality. Logs and metrics enhance the experience but are not required for basic service monitoring and APM capabilities.
Understanding the Services Dashboard
Access the Services dashboard at Discover > Services in Last9.
The Services dashboard displays all monitored services in your environment with key performance indicators at a glance. Each service shows critical metrics including throughput (requests per minute), error rate percentage, availability, and response time.
The main dashboard includes:
- Service Names: Organized by environment and runtime technology
- Throughput: Requests per minute for each service
- Error Rate: Percentage of failed requests
- Availability: Service uptime percentage
- Response Time: p95 response time in milliseconds
Use the sidebar filters to narrow down your view:
- Click on any filter category in the left sidebar
- Select specific values to filter the services list
- Click Apply Filters to update the view
- Use Clear to reset all applied filters
Analyzing Individual Services
Click on any service name to access detailed performance analysis and monitoring capabilities.
Overview
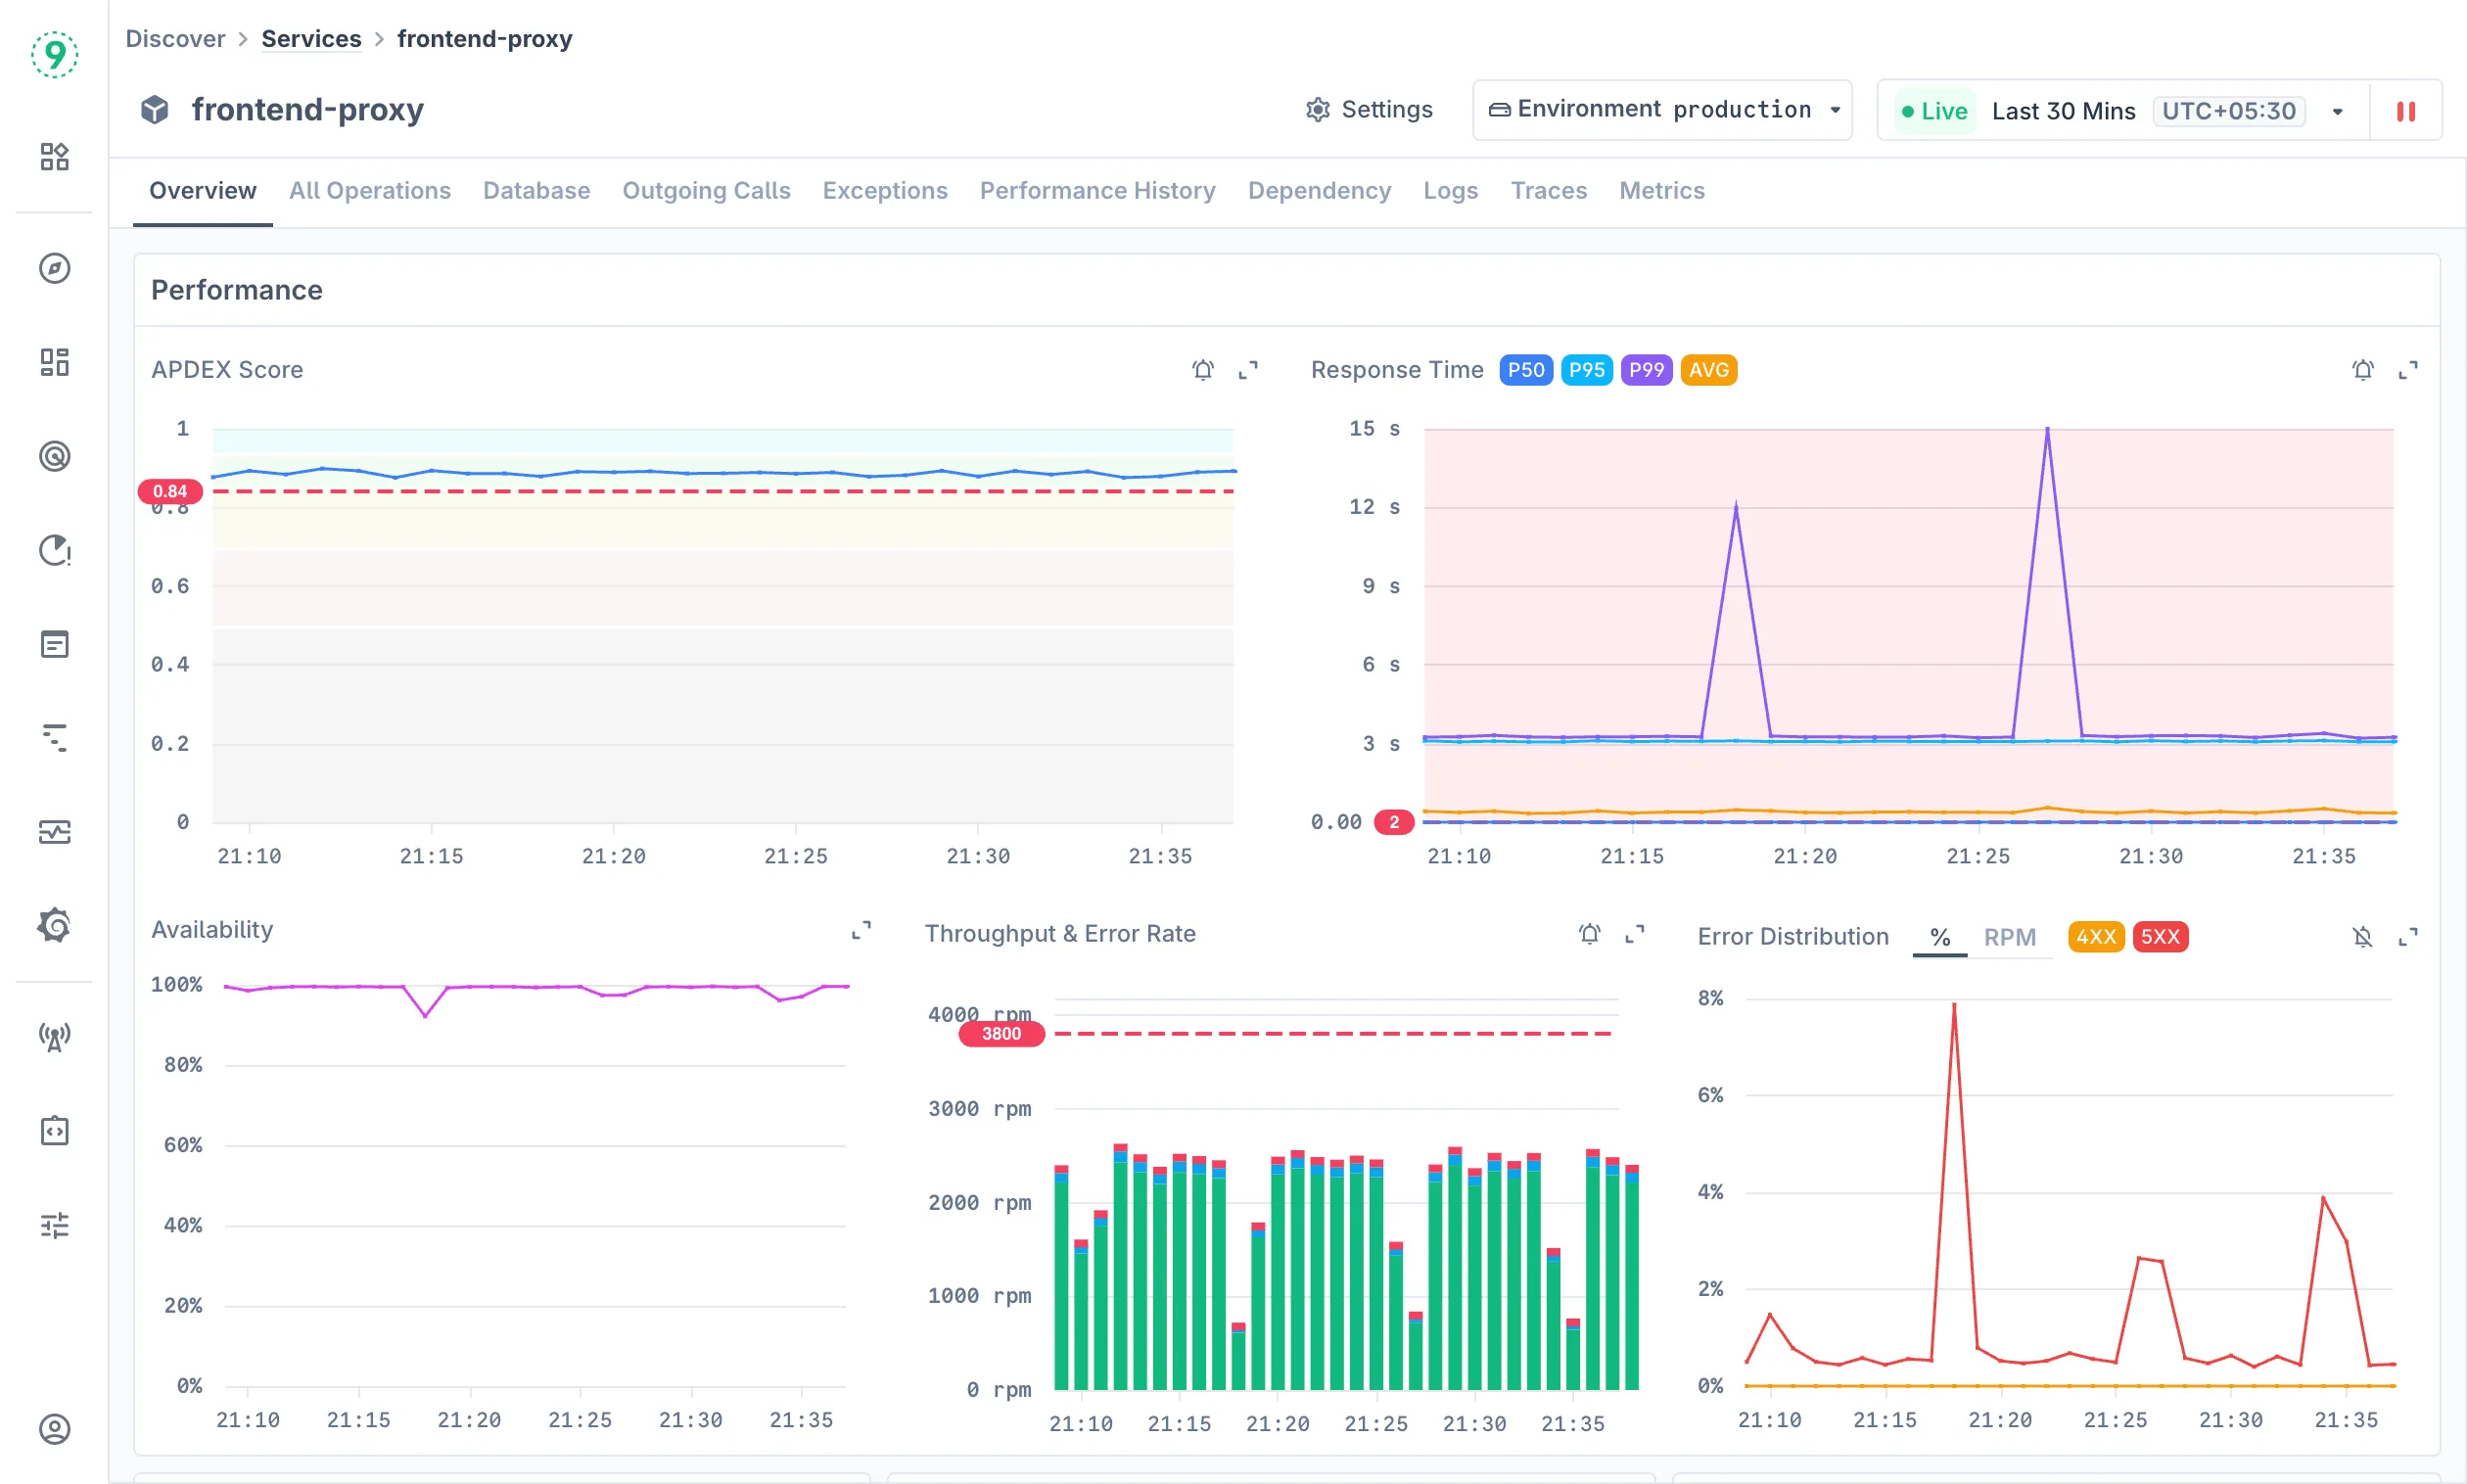
The Overview tab provides a comprehensive performance dashboard with multiple visualization panels:
Performance Metrics Include:
- APDEX Score: Application Performance Index showing user satisfaction
- Response Time: P50, P95, P99, AVG, and Max percentiles with alert threshold reference lines
- Availability: Service uptime tracking
- Throughput & Error Rate: Request volume and failure rates over time
- Error Distribution: Breakdown of error types and their frequency

Key Performance Tables:
- Top 10 Web Operations: Slowest operations by response time
- Top 10 Operations with Errors: Operations with highest error counts
- Top 10 Errors: Most frequent error types and their occurrence
You can also click on each of the rows in the key performance tables to view more details.
Setting Up Alerts
Configure performance-based alerts directly from the service overview:
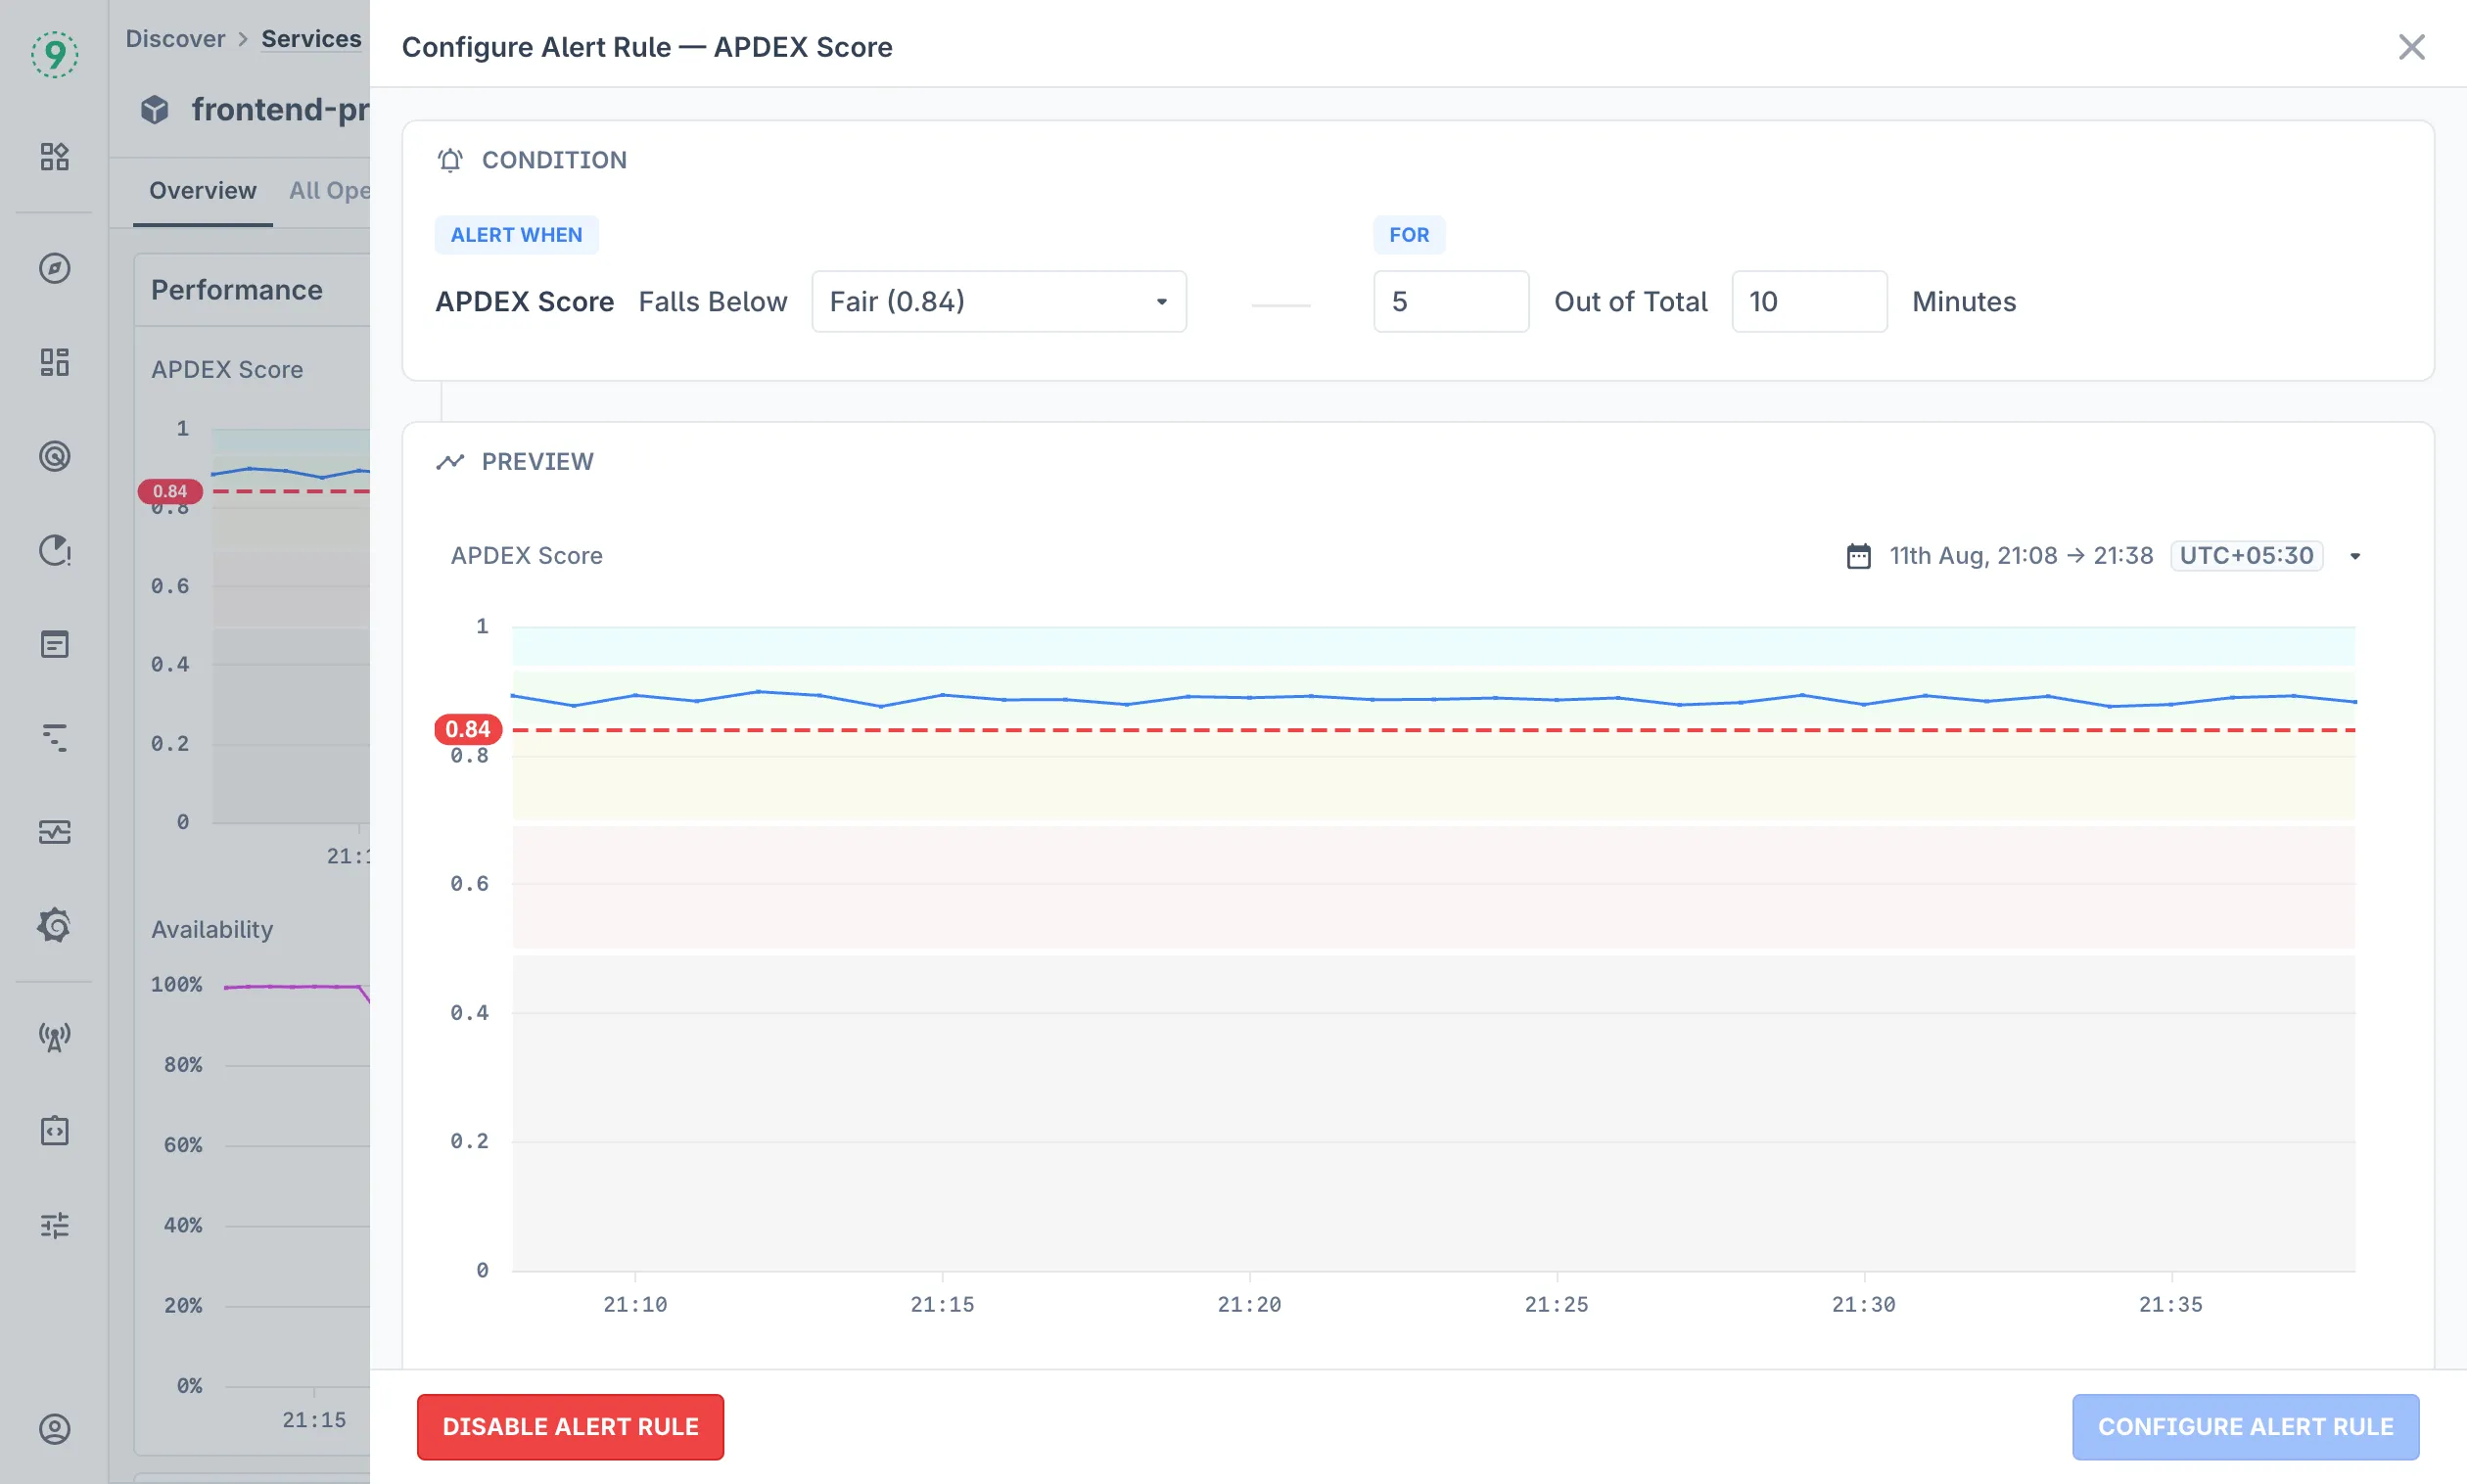
- Click Enable Alert Rule in the Performance section
- Configure the alert condition (e.g., APDEX Score falls below threshold, or Max Response Time exceeds threshold)
- Set the threshold value and time window
- Preview the alert behavior with the visual timeline
- Click Configure Alert Rule to finalize
The alert preview shows how the rule would have triggered based on historical data, helping you validate the threshold settings.
Available alert metrics:
- APDEX Score
- Response Time (P50, P95, P99, AVG, Max)
- Error Rate
- Throughput
Notification Channels
Configure where alerts are delivered by setting up notification channels. Access this through the No Notification Channels button (when no channels are configured) or the Settings button.
Available notification channels include Slack, PagerDuty, Opsgenie, Webhook, and Email integrations. For detailed setup instructions, see the Alerting documentation.
Operation Analysis
All Operations
View detailed performance metrics for all operations within a service. The operations view includes filters for:
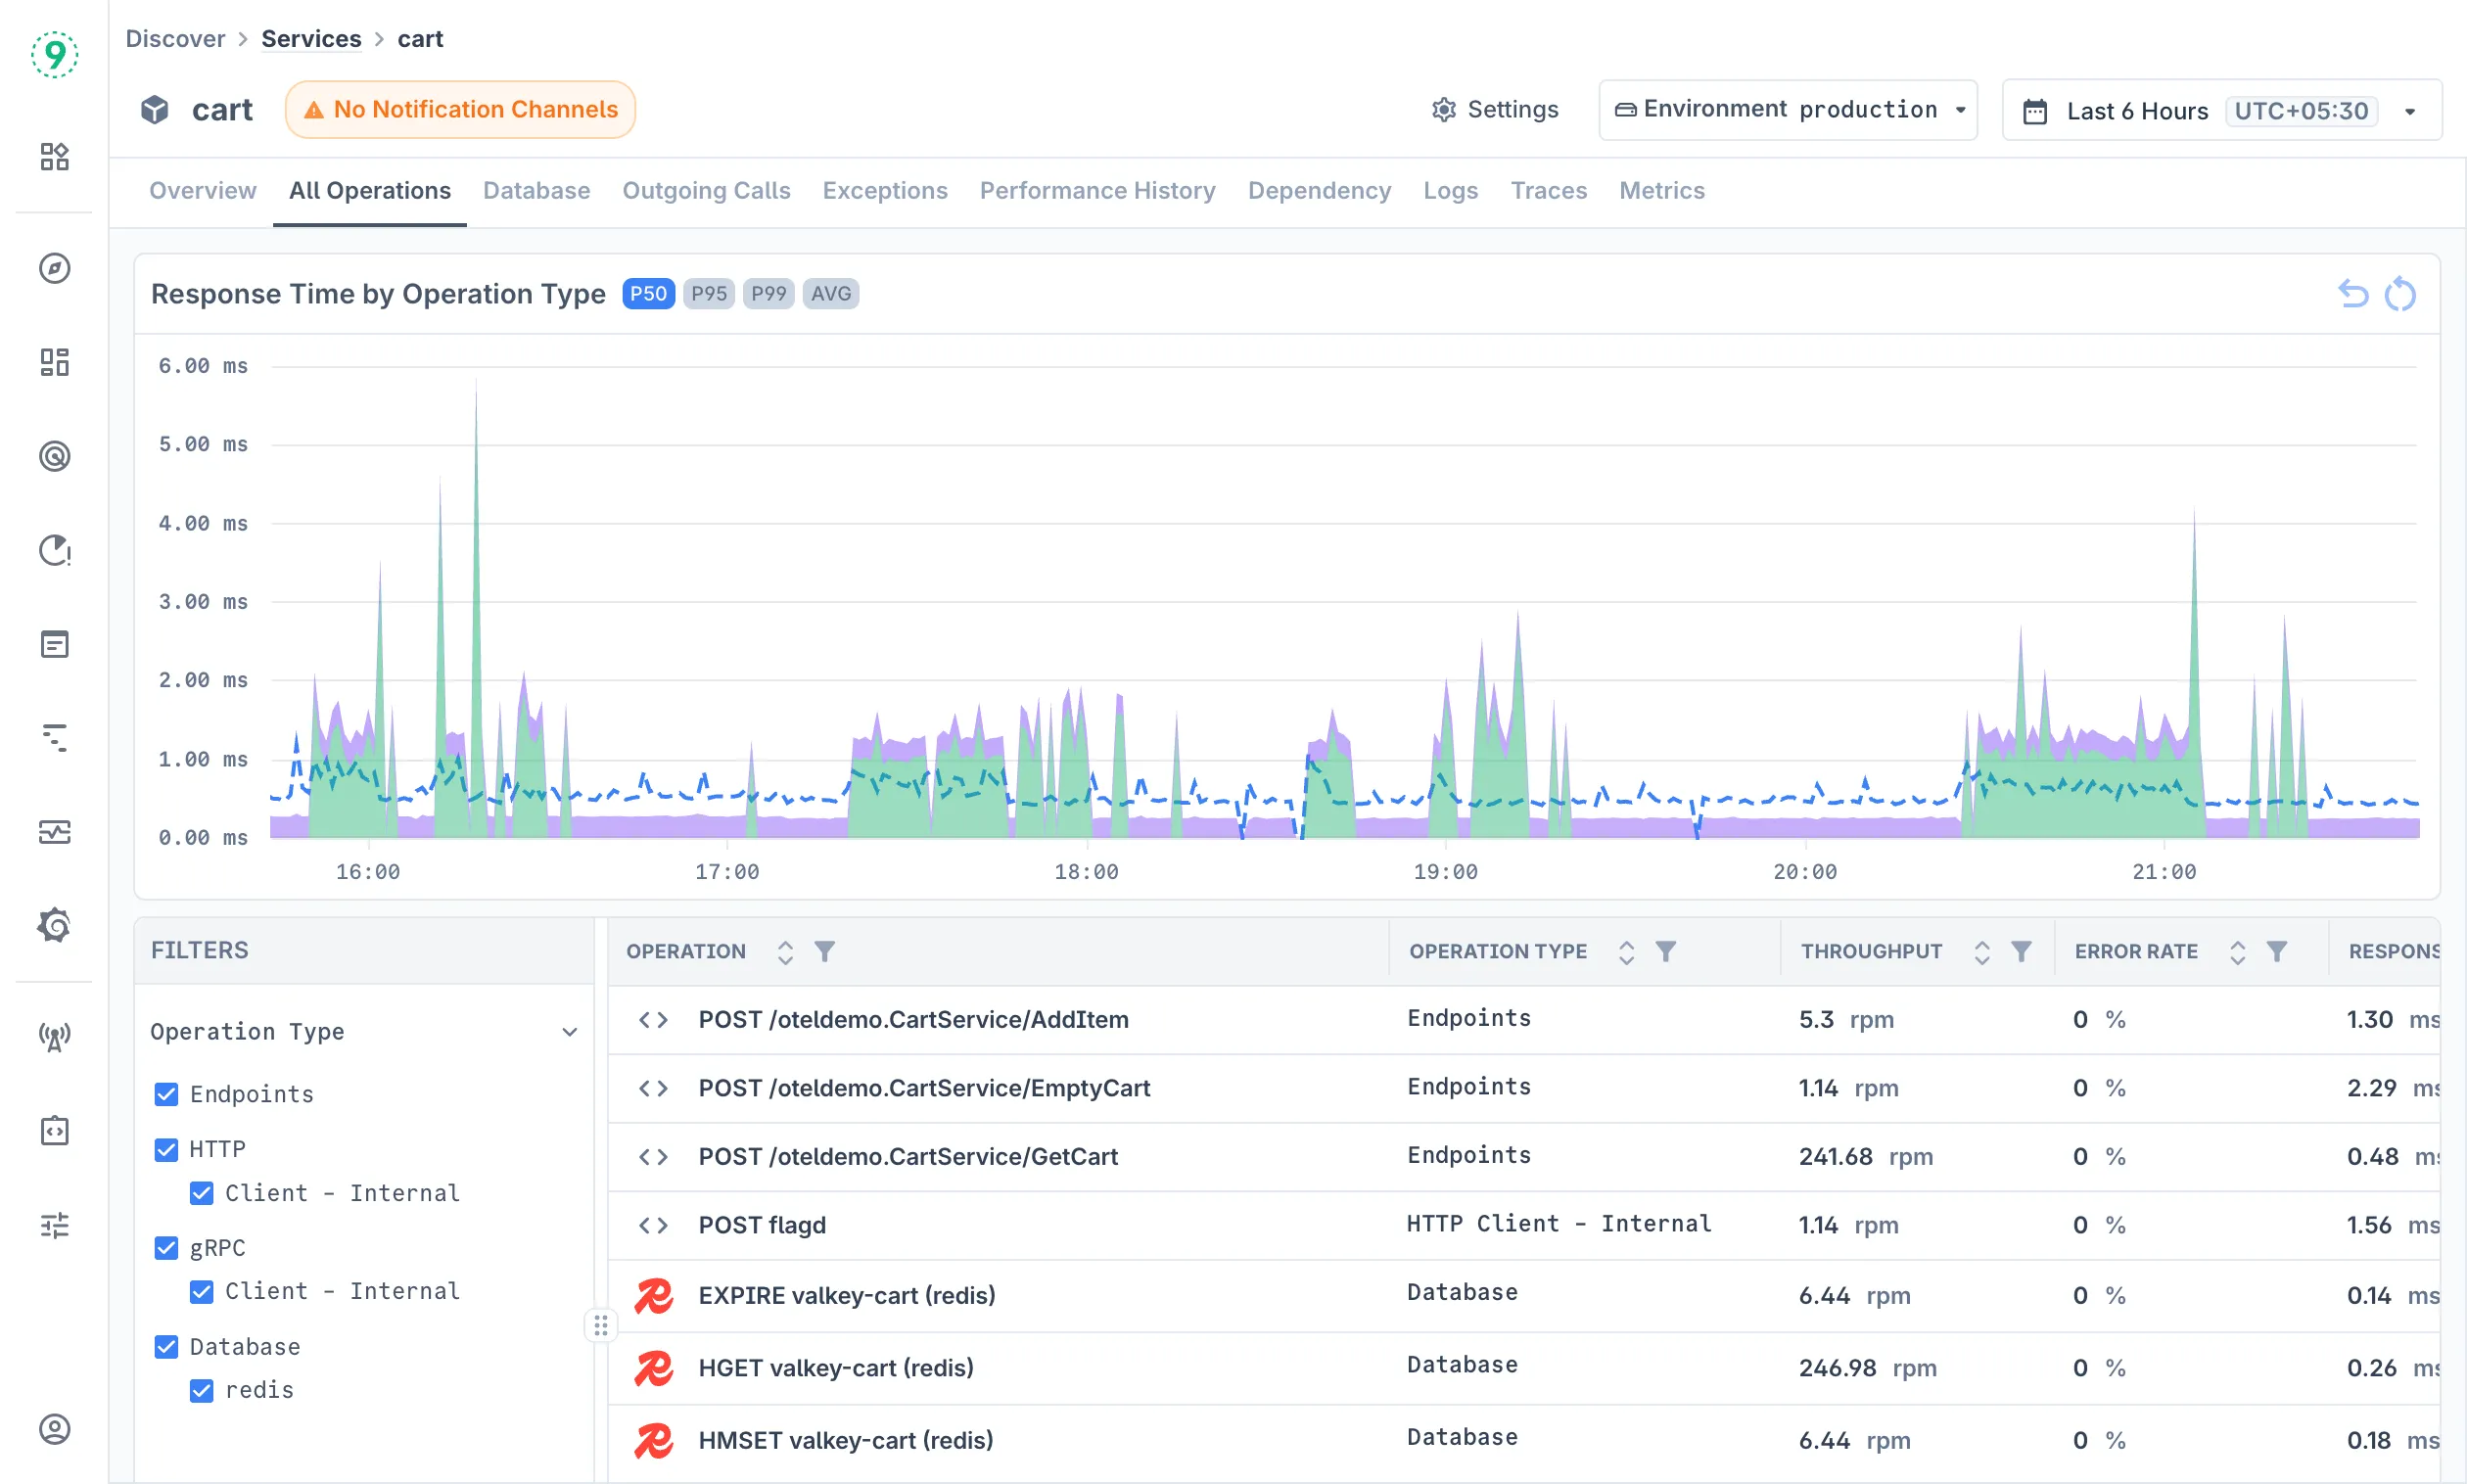
- Operation Type: Filter by Endpoints, HTTP types, Database operations
- Operation Categories: Client-Internal, Client-External, Messaging, etc.
Each operation shows:
- Throughput: Requests per minute
- Error Rate: Failure percentage
- Response Time: P95 latency metrics by default
- Operation Type: Classification of the operation
Viewing Individual Operation Details
Click on any operation name to open the detailed operation view. In the operation detail panel, you can:
- Select Response Time Metrics: Choose from P50, P95, P99, AVG, or Max to analyze different latency percentiles
- View Correlated Traces: See all traces where this operation executed, with filtering and sorting options
- Monitor Trends: Visualize response time patterns over the selected time range
The Max metric selector is particularly useful for identifying worst-case latency scenarios and performance outliers that may not be visible in percentile metrics.
Database
Monitor database-specific operations and queries across different database technologies:
- Multi-Database Support: Automatically detects and monitors operations across MySQL, MongoDB, Redis, PostgreSQL, and other database technologies
- Query Performance Tracking: Monitor throughput (RPM), error rates, and P95 response times for SELECT, INSERT, UPDATE, and other database operations
- Time-Series Visualization: Identify slow queries, high-volume operations, and performance trends with detailed graphs
- Operation-Level Details: View specific queries and statements with individual performance characteristics and metrics
Outgoing Calls
Monitor external dependencies and third-party service calls:
- External API Monitoring: Track HTTP calls to third-party services, cloud APIs, and external endpoints with detailed performance metrics
- Internal Service Communication: Monitor microservice-to-microservice communication and internal network calls
- Client Type Classification: Distinguish between Client-Internal and Client-External operations for better dependency analysis
- Dependency Performance Impact: Analyze how external service latency and availability affect your application’s overall performance
- Service Reliability Tracking: Monitor throughput, error rates, and response times for all outgoing dependencies to identify unreliable external services
Exception Monitoring
Using the Exceptions tab, track and analyze application errors and exceptions:
- Error Trend Visualization: Monitor error frequency over time with multiple trend analysis views (Error Type, Operation)
- Exception Type Filtering: Filter by specific exception classes like ReadTimeout, UnknownHostException, SQLIntegrityConstraintViolation, and HTTP error codes (400, 404, 500, 502, 503)
- Operation-Level Error Analysis: Identify which specific operations (Database queries, HTTP Client calls, Endpoints) are generating the most errors
- Error Count Tracking: See total error occurrences for each exception type to prioritize troubleshooting efforts
- Multi-Dimensional Analysis: Analyze errors by operation type (Database, HTTP Client - Internal/External, Endpoints) to understand error patterns across your application stack
Performance History
Analyze performance trends over time with historical comparisons:
- Operation Type Filtering: Switch between Endpoints, Consumer, and Database operations to analyze specific operation categories
- Period Comparison: Compare current performance against previous periods (Last 24 Hours, Previous 24 Hours, Last Monday, 7 Day Average)
- Color-coded Performance: Green indicates improvements, red shows degradation in throughput and response times
- Trend Analysis: Track throughput (RPM), response time (P95), error rates, and APDEX scores across different time periods
- Operation-Level Insights: See performance changes for individual operations like API endpoints, database operations, and health checks
Service Dependencies
Using the Dependency tab, Visualize service relationships and dependencies:
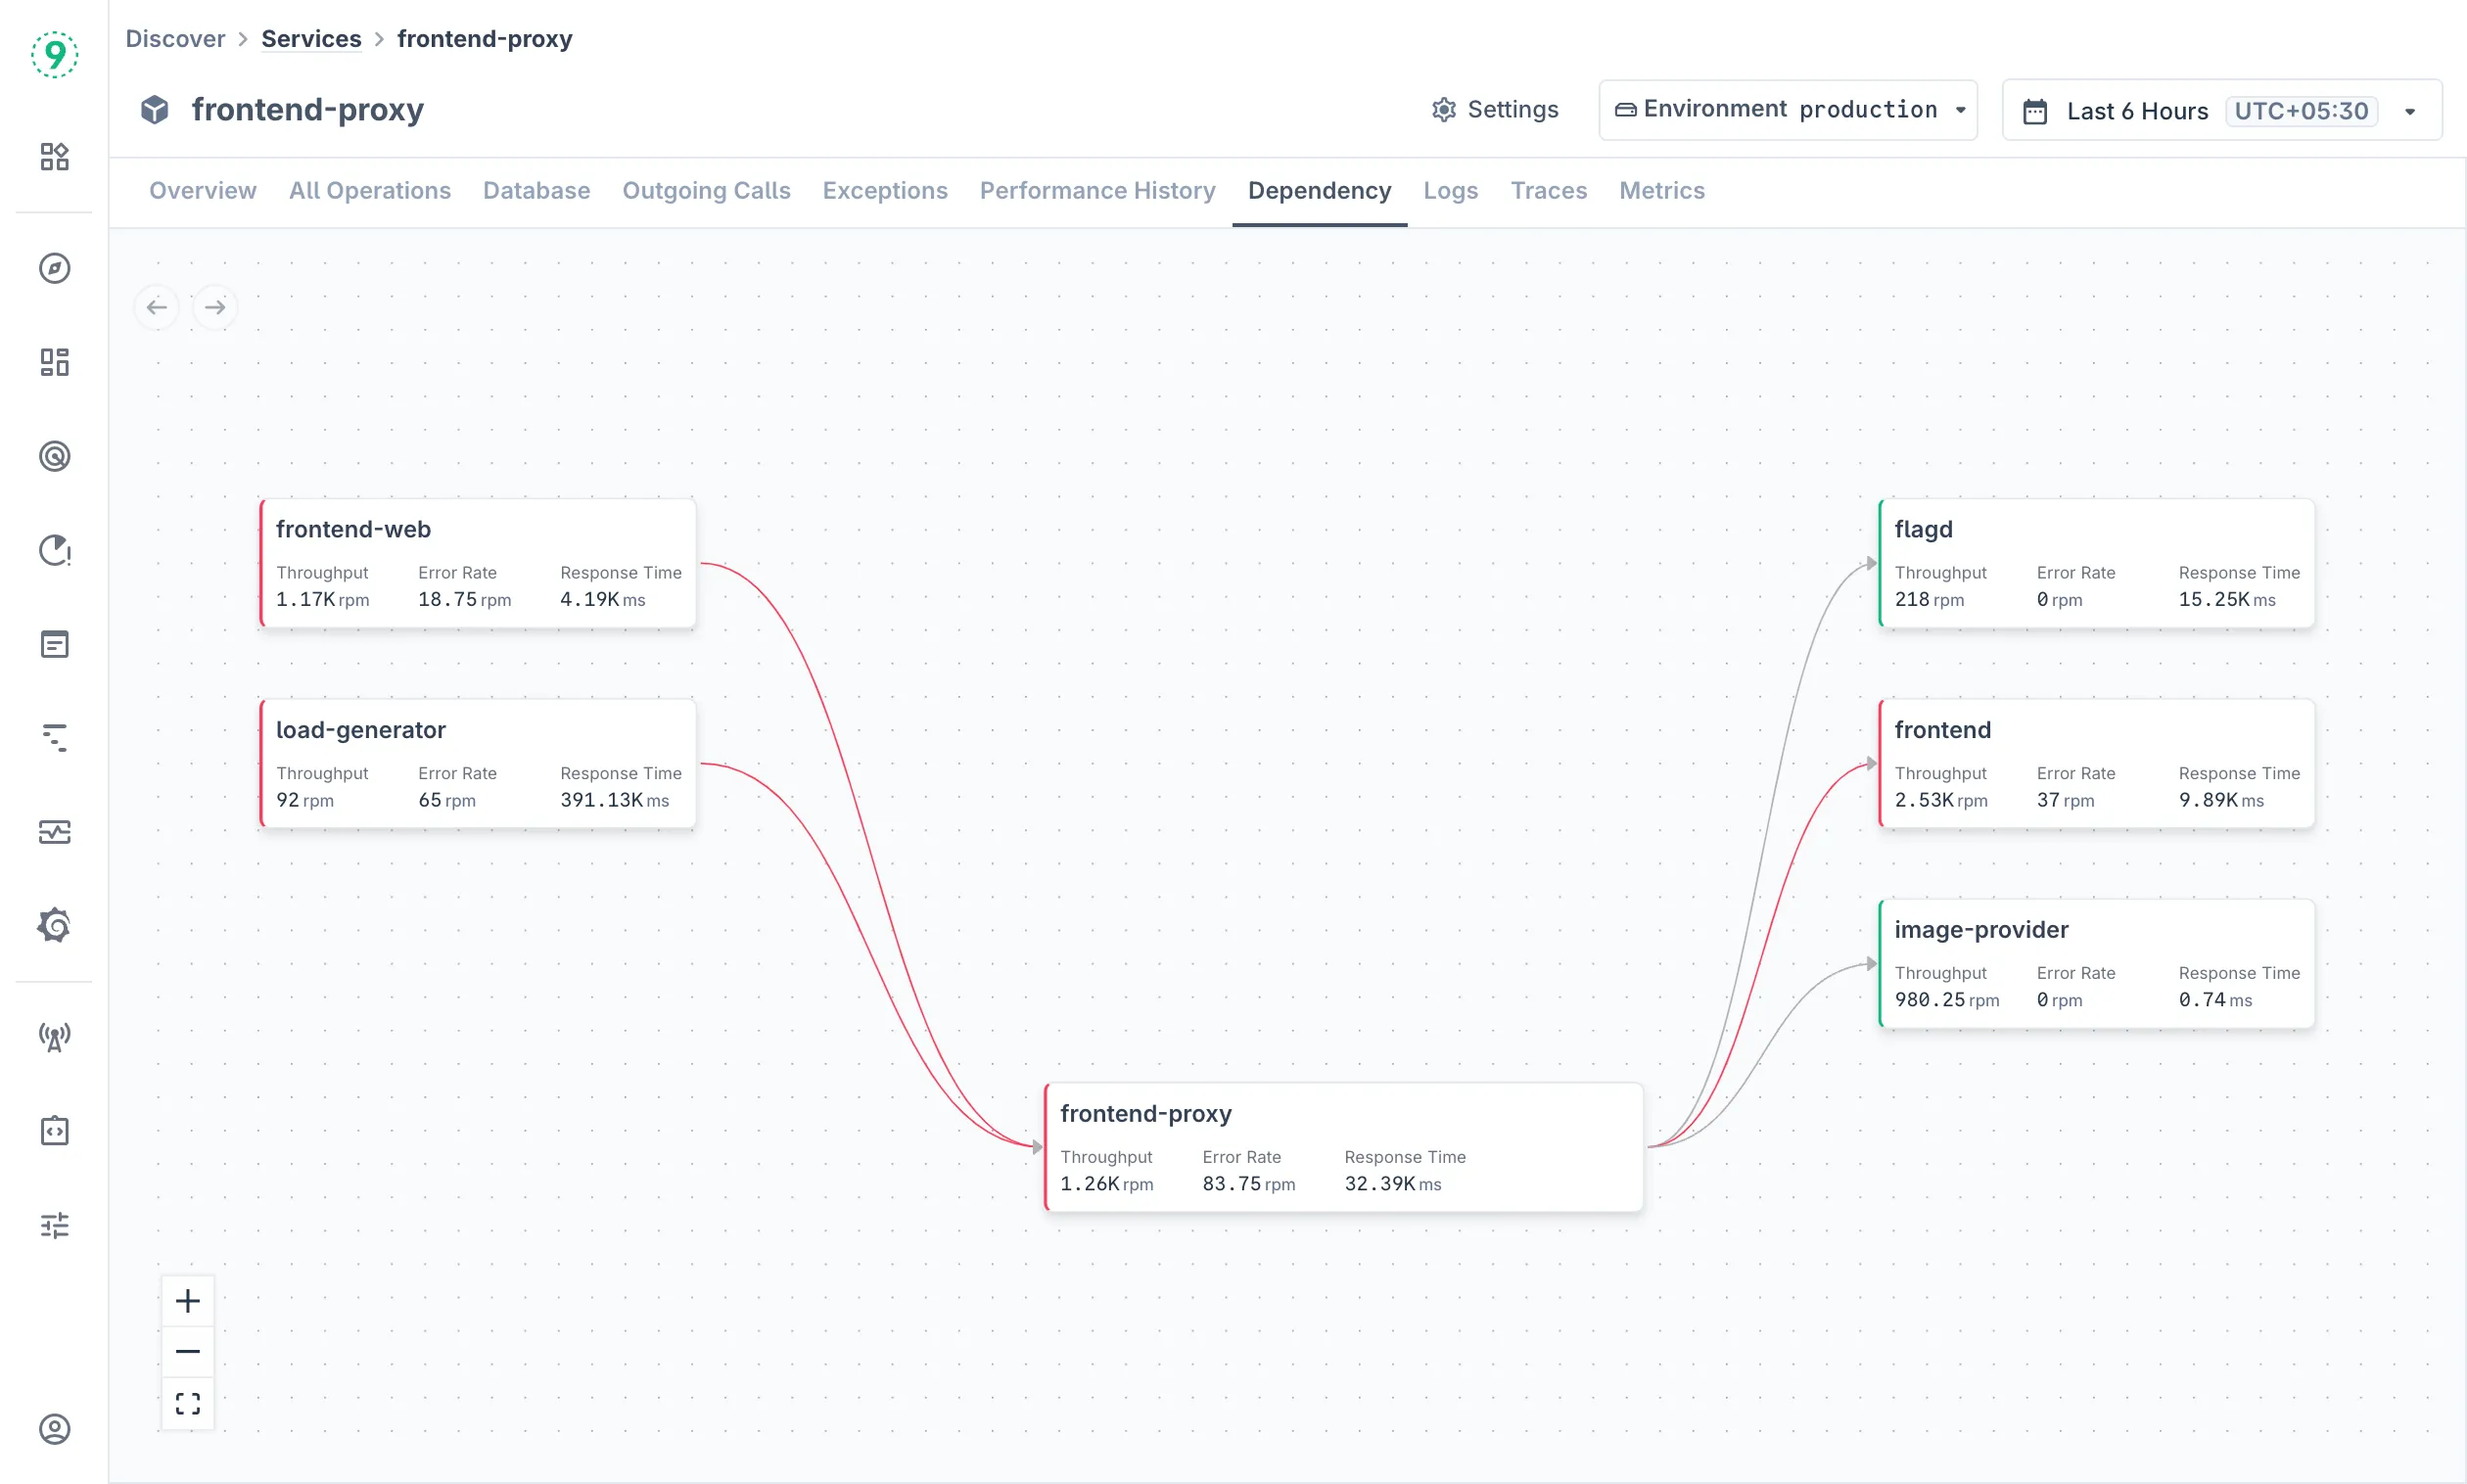
The dependency map shows:
- Service Connections: How services communicate with each other
- Infrastructure Dependencies: Database and external service connections
- Performance Impact: Metrics for each dependency relationship
- Dependency Health: Red nodes and arrows indicate services/relationships with errors, green indicates healthy services
Navigate the dependency map using:
- Zoom Controls: Use + and - buttons to adjust view
- Pan: Click and drag to move around the map
Related Logs
Access service-specific logs for troubleshooting:
- Pre-filtered Logs: Automatically filtered to the selected service
- Time Range Alignment: Logs correspond to the selected time window
- Volume Indicator: Visual representation of log volume over time
- Click on any log line to view more details
Related Traces
Examine distributed traces for the selected service:
- Operation Filtering: Filter traces by specific operations
- Span Analysis: Examine individual spans within traces
- Performance Correlation: Connect traces to performance metrics
- Duration Tracking: Analyze request flow and timing
- Click on any trace or span to view distributed tracing visualization and more details
Related Metrics
Services may have one or both of the following, depending on their monitoring configuration and deployment type:
- Infrastructure metrics monitor container-level resources (CPU, memory, network, disk)
- Process metrics focus on application runtime performance (JVM, memory management, garbage collection)
Infrastructure Metrics
Monitor underlying infrastructure performance. Infrastructure monitoring covers:
- Container Overview: High-level dashboard showing total containers, average CPU and memory usage, and network traffic (incoming and outgoing)
- CPU Monitoring: Processor utilization per container with breakdowns by user mode and kernel mode
- Memory Monitoring: RAM usage percentage by container, memory limits, and cache utilization patterns
- Network I/O Monitoring: Network traffic analysis including data transfer rates and packet statistics
- Block I/O Monitoring: Disk I/O operations for storage performance analysis
Process Metrics
Monitor JVM and application-level performance metrics. Process monitoring provides deep insights into application runtime performance:
- Memory Health Overview: Track memory usage after garbage collection and memory growth patterns
- Heap Pool Analysis: Monitor different heap space regions (Eden, Survivor) for garbage collection optimization
- GC Performance Metrics: Analyze garbage collection overhead, frequency, duration, and efficiency
- CPU and System Analysis: Monitor JVM and system CPU utilization, load, and thread management
- Buffer Pool Intelligence: Track I/O buffer usage, limits, and utilization for performance optimization
- Class Loading Monitoring: Monitor dynamic class loading and unloading behavior
- Advanced Analysis: Detect memory leaks, performance degradation, and thread issues with predictive monitoring
Best Practices
Service Monitoring Strategy:
- Set up alerts for critical services using APDEX scores below 0.8
- Monitor both throughput trends and error rate spikes for early issue detection
- Use dependency maps to understand service impact during incidents
- Configure notification channels before alerts to ensure proper incident response
Performance Optimization:
- Focus on operations with high response times in the “Top 10 Web Operations” table
- Monitor error distribution to identify systemic vs. isolated issues
- Use the Performance History tab to validate the impact of deployments
- Correlate infrastructure metrics with application performance during capacity planning
Troubleshooting Workflow:
- Start with the Overview tab to identify performance anomalies
- Use the Exceptions tab to understand error patterns
- Examine specific operations in the All Operations tab
- Check dependencies to identify upstream or downstream impact
- Access logs and traces for detailed root cause analysis
Troubleshooting
Please get in touch with us on Discord or Email if you have any questions.