

How to Exclude Health Check Endpoints from Python OTel Traces
Health check endpoints generate thousands of identical, useless spans per day. Here are two production-ready approaches to filter them from your Python OTel traces — and the correctness trap most implementations miss.
Prathamesh Sonpatki

Argo Rollouts Canary Monitoring: Metrics, Gotchas, and Automated Gates with Last9
Argo Rollouts exposes Prometheus metrics on port 8090 — but the docs lie about which labels exist. Here's how to scrape them into Last9, build a canary dashboard, and use Last9 as an automated AnalysisTemplate gate, including the auth and base64 gotchas.
Prathamesh Sonpatki
What is AI SRE? The Complete Guide to AI-Assisted Site Reliability Engineering
It's 2:47 AM. PagerDuty fires. You open a Slack alert and see: p99 latency spike on checkout-service. You SSH into the host, check dashboards in four tabs, grep logs for the last 20 minutes, and eventually find a slow query introduced in a deploy six hours ago. It took 34 minutes. You resolved it, w
Prathamesh Sonpatki
Capturing HTTP Request and Response Bodies in .NET Traces with PHI Redaction
> Standard OTel .NET instrumentation captures headers, status codes, and timing — not request or response bodies. Here's how to add body capture to your traces while keeping PHI out of your observability backend.
Prathamesh Sonpatki
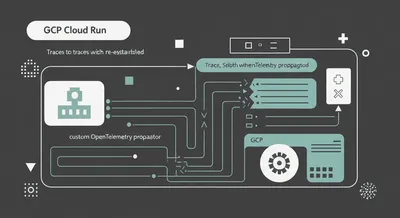
Fixing Broken Traces in GCP Cloud Run: A Custom OpenTelemetry Propagator
GCP's load balancer silently rewrites your traceparent header, orphaning spans in any OTLP backend. Here's the custom propagator that fixes it.
Prathamesh Sonpatki
Why Your PromQL Availability Query Returns Nothing When Services Are Healthy
Your SLI query shows 100% availability as No Data. Here's why PromQL returns empty results instead of zero — and the label-preserving fix.
Prathamesh Sonpatki

Instrumenting WordPress with OpenTelemetry: PHP Tracing, Browser RUM, and Error Capture in Production
WordPress powers 40% of the web but has no native observability story. Here's how to instrument it end-to-end with OpenTelemetry - PHP, browser RUM, and errors.
Prathamesh Sonpatki
10,000 GPUs, One TSDB: Cardinality at GPU Scale
1,000 nodes × 8 GPUs × 60 metrics = 1.4M time series - before you add pod names or Slurm job IDs. GPU monitoring is a cardinality problem disguised as a metrics problem. How to design for it before production OOMs your Prometheus.
Shekhar
From GPU Silicon to Business Metrics: The 8 Layers of GPU Observability
GPU observability isn't one thing - it's eight connected layers from silicon to cost. See why correlation across layers is what cuts debugging from 2 hours to 2 minutes, and why most teams instrument only one or two
Shekhar