


The GPU Metrics That Actually Matter
Most teams monitor three GPU metrics - utilization, temperature, memory. There are 50+ that matter, and the ones you skip cause your worst outages. A vendor-neutral guide across NVIDIA, AMD, and Intel Gaudi
Shekhar

Your LLM Is Slower Than You Think
60% GPU utilization and 3-second response times? GPU utilization is the wrong signal for LLM inference. Here's why TTFT, KV-cache pressure, and queue depth - not utilization - predict user-facing latency.
Shekhar

Predicting GPU Failures Before They Cost You
Predict GPU hardware failures 48–72 hours in advance. A guide to the five rate-based signals — ECC error trends, XID events, thermal ramp, row remap exhaustion, PCIe downtraining — and how to combine them into a composite health score.
Shekhar
Every Token Has a Price: Per-Request GPU Cost Attribution
Flat per-token pricing is wrong by 10–50× per request. Prefill vs decode, batch sharing, and cache effects break the math. How to attribute real GPU cost - compute, energy, and dollars - to each inference request.
Shekhar

Best Incident Management Software for Engineering Teams (2026)
Compare 9 incident management tools: PagerDuty, Opsgenie, Incident.io, Rootly, FireHydrant, BetterStack, Grafana OnCall, Squadcast, and Last9. Features, pricing, and which fits your team.
Sahil Khan
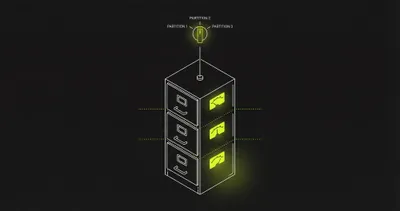
Database Partitioning: Types, Strategies, and When to Use Each
How database partitioning works in PostgreSQL and MySQL. Range, list, and hash partitioning with SQL examples and guidance on when to partition vs shard.
Prathamesh Sonpatki
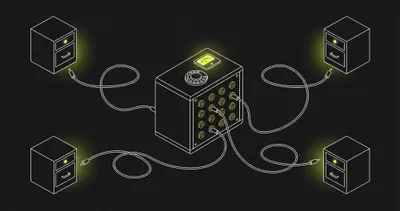
Database Sharding: How It Works and When You Actually Need It
How database sharding works, common strategies (hash, range, directory), shard key selection, and the operational cost of running a sharded database in production.
Prathamesh Sonpatki

Database Performance Tuning: A Practical Guide for Production Systems
Tune PostgreSQL and MySQL for production with connection pooling, memory configuration, write path optimization, vacuum management, and lock contention fixes.
Preeti Dewani

Traces Are Not Your Business Logic
Distributed traces track how your system processed a single request — not what your customers did over time. Confusing the two leads to poorly instrumented systems.
Mukta Aphale