1,000 nodes. 8 GPUs each. 60 metrics per GPU. 3 label dimensions per metric.
That's 1.4 million unique time series from hardware metrics alone. Now add per-pod workload identity — pod names with random suffixes that change on every restart. Add Slurm job IDs — monotonically increasing integers, thousands per day. Add model names, inference engine versions, ECC memory block identifiers.
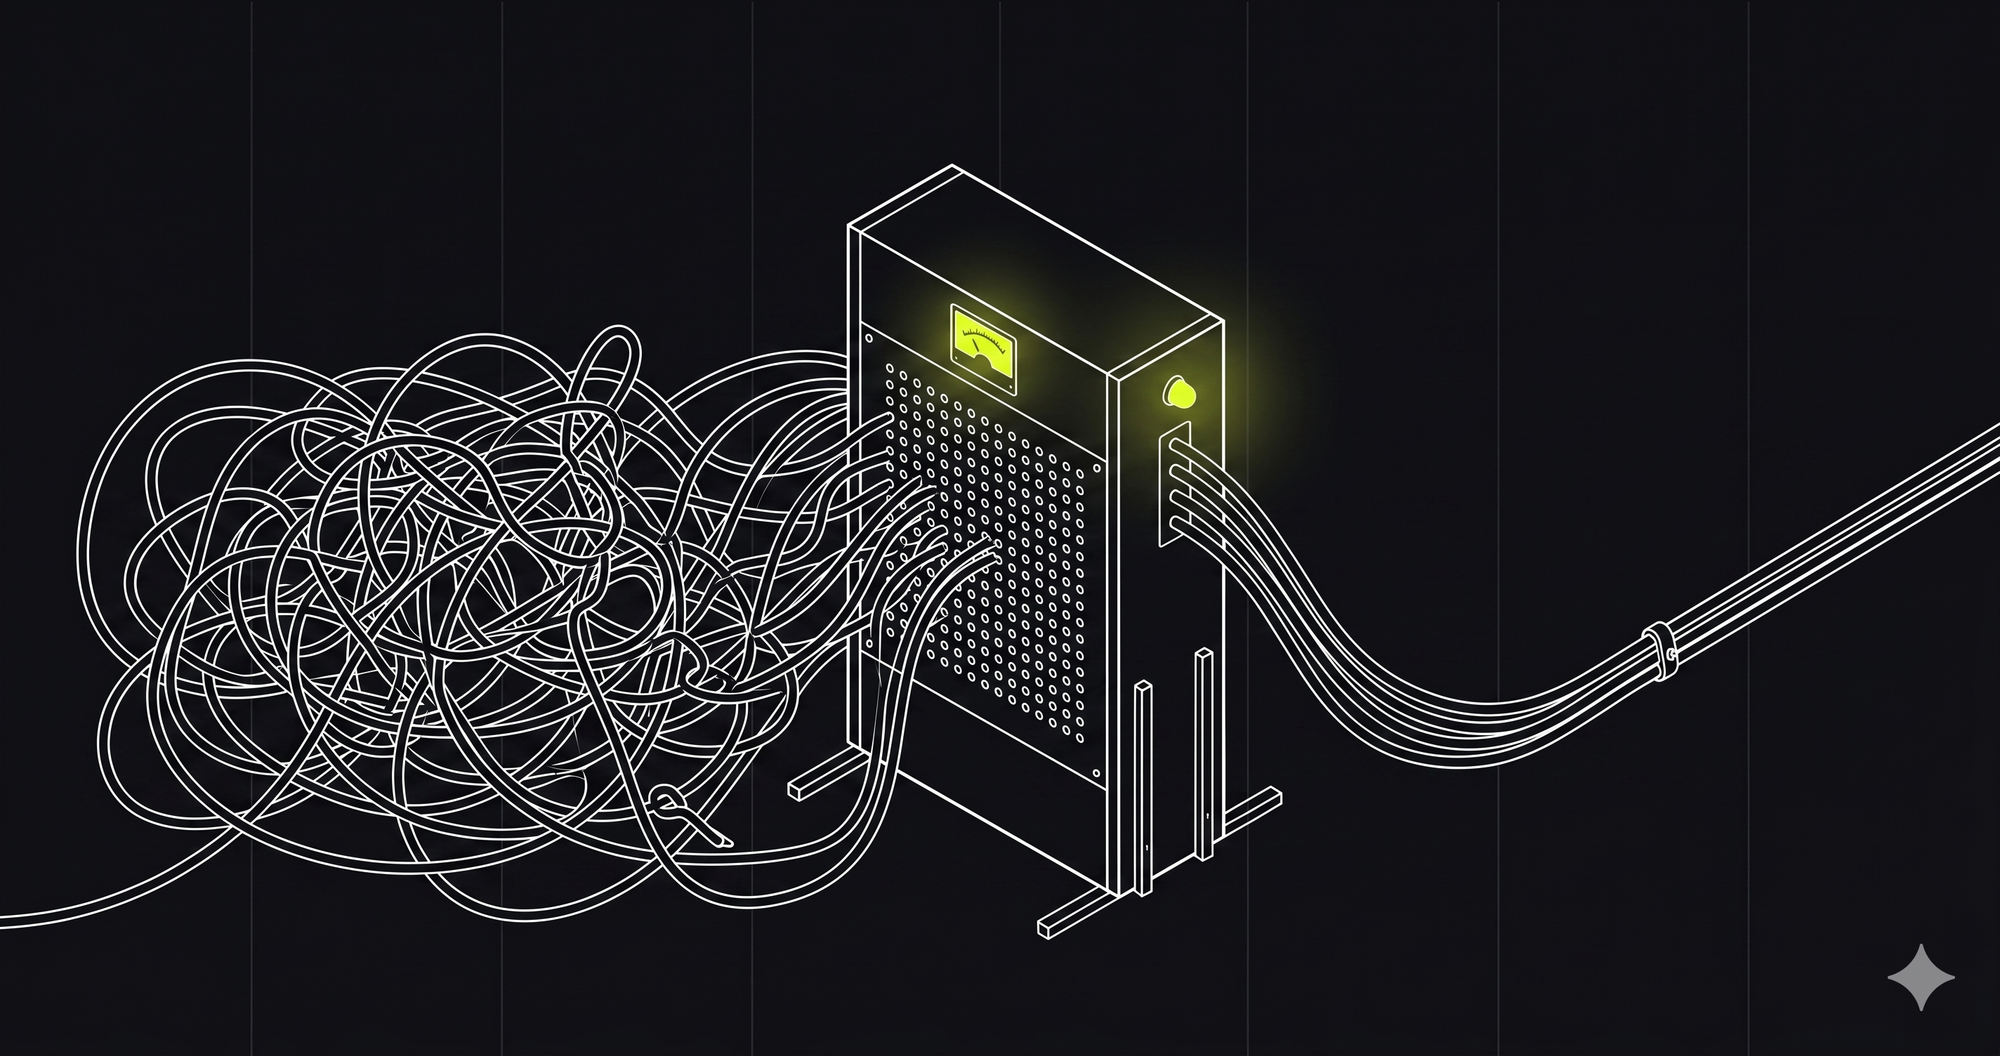
Congratulations. Your Prometheus just OOMed.
GPU monitoring is a cardinality problem disguised as a metrics problem. And if you don't design for it from the start, you'll discover it in production — when your monitoring backend falls over under the very load it was supposed to observe.
Why GPU Monitoring Explodes Cardinality
Traditional application monitoring has a relatively stable set of label values. A web service has a fixed number of endpoints, a fixed number of HTTP status codes, a fixed number of deployment versions. The cardinality — the number of unique combinations of label values — grows slowly.
GPU monitoring violates this. Every dimension that makes GPU metrics useful for debugging also makes them expensive to store:
Pod names (k8s.pod.name) have random suffixes generated by Kubernetes. vllm-prod-7f6d9c8b4-x9k2z. Every pod restart generates a new name. On a busy inference cluster with autoscaling, pods churn every few minutes. Each new pod name creates a new set of time series — and the old ones sit in your TSDB as abandoned series, still consuming memory and compaction resources.
Slurm job IDs (slurm.job.id) are monotonically increasing integers. A busy HPC cluster runs thousands of jobs per day. If job ID is a metric label, you create thousands of new unique series per day, each active for the duration of one job (minutes to hours) and then abandoned forever. Your cardinality grows linearly with time and never shrinks.
Model names and versions change with deployments. Llama-3-70B-Instruct-v2.1 is a different label value from Llama-3-70B-Instruct-v2.2. Every model update creates a new set of series.
ECC memory blocks are the hidden killer. AMD MI300X GPUs have 40+ individual ECC memory blocks per GPU, each with separate error counters. If you naively label each ECC metric with the block identifier:
40 blocks × 8 GPUs × 1,000 nodes = 320,000 series from one metricThat's 320K series just for per-block ECC counters. On NVIDIA GPUs, ECC is reported at the device level (one value per GPU), so this isn't an issue. But the moment you add AMD MI300X nodes to your fleet, the cardinality budget you planned for doesn't hold.
The Logs vs Metrics Split
The most important design decision in GPU observability cardinality management is deceptively simple: high-cardinality fields go on logs, not metrics.
Metrics are for dashboards, alerts, and trending. They need low, stable cardinality because every unique label combination creates a time series that persists in the TSDB index. Metrics are the signal you query continuously.
Logs are for investigation and attribution. They're append-only — a new pod name doesn't create a persistent series, it just creates a new log line. Log storage scales linearly with volume, not with the number of unique label combinations. Logs are the signal you search when you're debugging.

The split:
| Signal | Goes On Metrics | Goes On Logs |
|---|---|---|
| GPU index | Yes | Yes |
| GPU model | Yes | Yes |
| Host name | Yes | Yes |
| Cluster name | Yes | Yes |
| Temperature, utilization, power | Yes (gauge) | Yes (snapshot) |
| Pod name | No | Yes |
| Job ID | No | Yes |
| User name | No | Yes |
| Model version | No | Yes |
| Request ID | No | Yes |
| ECC per-block counters | No (aggregate only) | Yes (per-block) |
Metrics carry stable, low-cardinality labels: gpu.index, gpu.model, host.name, k8s.cluster.name. These dimensions don't change during a GPU's lifetime on a node. The number of unique series is bounded by (GPUs × metrics × clusters) — a number you can predict and budget for.
Logs carry everything else. Every scrape cycle emits a structured log record per GPU with the full attribution context: pod name, job ID, user, model version, all 65+ metric values as structured fields. This gives you full debuggability without cardinality tax.
How correlation works: Logs and metrics share gpu.index and host.name as common keys. When you see a temperature spike for gpu.index=3 on host.name=node-42 in your metric alert, you query logs for the same GPU and time range to find the pod name, job ID, and full metric snapshot. The join happens at query time, not at ingestion time. No cardinality penalty.
Dimension Pruning
Not every metric needs every label.
gpu.temperature is a hardware property. It doesn't need k8s.pod.name because temperature doesn't change based on which pod is running. A pod restart doesn't affect the GPU's temperature. Adding the pod label to temperature metrics would create unnecessary cardinality — one temperature series per pod lifecycle, instead of one per GPU.
vllm.cache.usage is an application metric. It does benefit from model_name because different models have different cache profiles. But it doesn't need gpu.uuid because the cache is a per-engine resource, not a per-GPU resource.
The principle: add labels that the metric's consumer (dashboard or alert) actually needs to GROUP BY or filter on. Drop everything else.
In practice, this means defining label propagation rules at collection time:
- Hardware metrics (L1):
gpu.index,gpu.model,host.name,k8s.cluster.name - Inference metrics (L6): add
model_name - Training metrics (L5): add
nccl.rank(for straggler detection only) - Cost metrics (L8):
host.name,k8s.cluster.name(aggregated, not per-GPU)
This is cheaper than collecting all labels on all metrics and stripping them later — you avoid creating the series in the first place.
Interval Processing and Aggregation
Raw GPU metrics are collected every 10-15 seconds. For most monitoring use cases, 60-second resolution is sufficient and reduces data volume by 4-6x.
The OTel Collector's interval processor aggregates data points within a time window before exporting:
processors:
  interval:
    interval: 60s  # aggregate to 1-minute resolution
At 1,000 GPUs, this reduces the export rate from ~6,000 data points/second to ~1,000 data points/second. The difference matters for network bandwidth, backend ingestion cost, and query performance.
Pre-aggregation is the next lever. Per-node aggregate metrics — min, max, and average GPU utilization across all GPUs on a node — eliminate the per-GPU dimension for fleet-level dashboards. A fleet overview panel doesn't need per-GPU data; it needs per-node or per-cluster summaries. Computing these at collection time means the fleet dashboard queries touch hundreds of series (one per node) instead of thousands (one per GPU).
Backend recording rules are the final optimization. For queries that run on every dashboard refresh (e.g., "average fleet utilization"), a Prometheus recording rule pre-computes the result and stores it as a new, low-cardinality metric:
# Recording rule: fleet-level average utilization by cluster
avg by (k8s_cluster_name) (gpu_utilization_ratio)
This converts an expensive fan-out query (read all GPU series, aggregate) into a cheap lookup (read one pre-computed series).
What Breaks at Scale
These are the failure modes we've seen at 1,000+ GPU deployments:
TSDB memory exhaustion from abandoned series. Prometheus keeps series in the head block for 2 hours after the last sample. Pod churn means thousands of series enter the head block, receive a few samples, then sit in memory for 2 hours waiting to be compacted. On a 1,000-GPU cluster with active pod churn, the head block can grow to several gigabytes. The fix: keep pod names off metrics (the logs vs metrics split) and tune --storage.tsdb.min-block-duration.
Query timeouts on high-cardinality aggregations. A dashboard panel that does sum by (model_name) (gpu_utilization_ratio) seems innocent. But when model_name has been a metric label for 6 months and you've deployed 50 model versions, Prometheus has to touch 50 × 8,000 = 400,000 series to compute the sum. Switch to recording rules for commonly-queried aggregations.
AMD ECC block explosion. The first time a team adds MI300X nodes to a cluster that was previously NVIDIA-only, their cardinality budget is immediately blown. 40 ECC blocks per GPU × 8 GPUs per node × number of MI300X nodes. The fix: aggregate ECC per-block into per-GPU totals at collection time. Store per-block detail in logs only.
NCCL rank cardinality. In a distributed training job with tensor parallelism, each GPU has a rank (0 to N-1). Adding nccl.rank as a metric label is fine for straggler detection during a single training job. But across multiple jobs with different rank assignments, it creates unique series for each (job, rank) combination. The fix: only add rank labels when actively profiling training performance. Drop them in steady-state monitoring.
Design for Scale on Day One
Cardinality problems are architectural. They can't be fixed by adding more storage or upgrading to a bigger Prometheus instance. By the time you hit the wall, you have months of high-cardinality data that's expensive to migrate and dashboards that depend on labels you need to remove.
The guidelines:
| Deployment Size | Estimated Series | Strategy |
|---|---|---|
| < 100 GPUs | ~10K | No special handling needed |
| 100-1,000 GPUs | ~100K | 60s interval processing, logs vs metrics split |
| 1,000-10,000 GPUs | ~1M | All of the above + dimension pruning + recording rules |
| > 10,000 GPUs | ~10M+ | All of the above + per-cluster sharding + high-cardinality backend |
The single most impactful decision is the logs vs metrics split. Make it on day one, before you have dashboards that depend on pod-name metric labels. Everything else is optimization — this one is architecture.
Last9 is built for high-cardinality observability. GPU labels — including the ones that would blow up a traditional TSDB — stay on data points without cardinality penalties. Logs and metrics live in the same query engine, so the logs vs metrics split doesn't mean losing correlation. Ten thousand GPUs is a configuration problem, not an architecture problem. Get started with Last9.