Grafana Loki in Last9
Use Last9's embedded Grafana Loki to view logs.
Using Grafana Loki
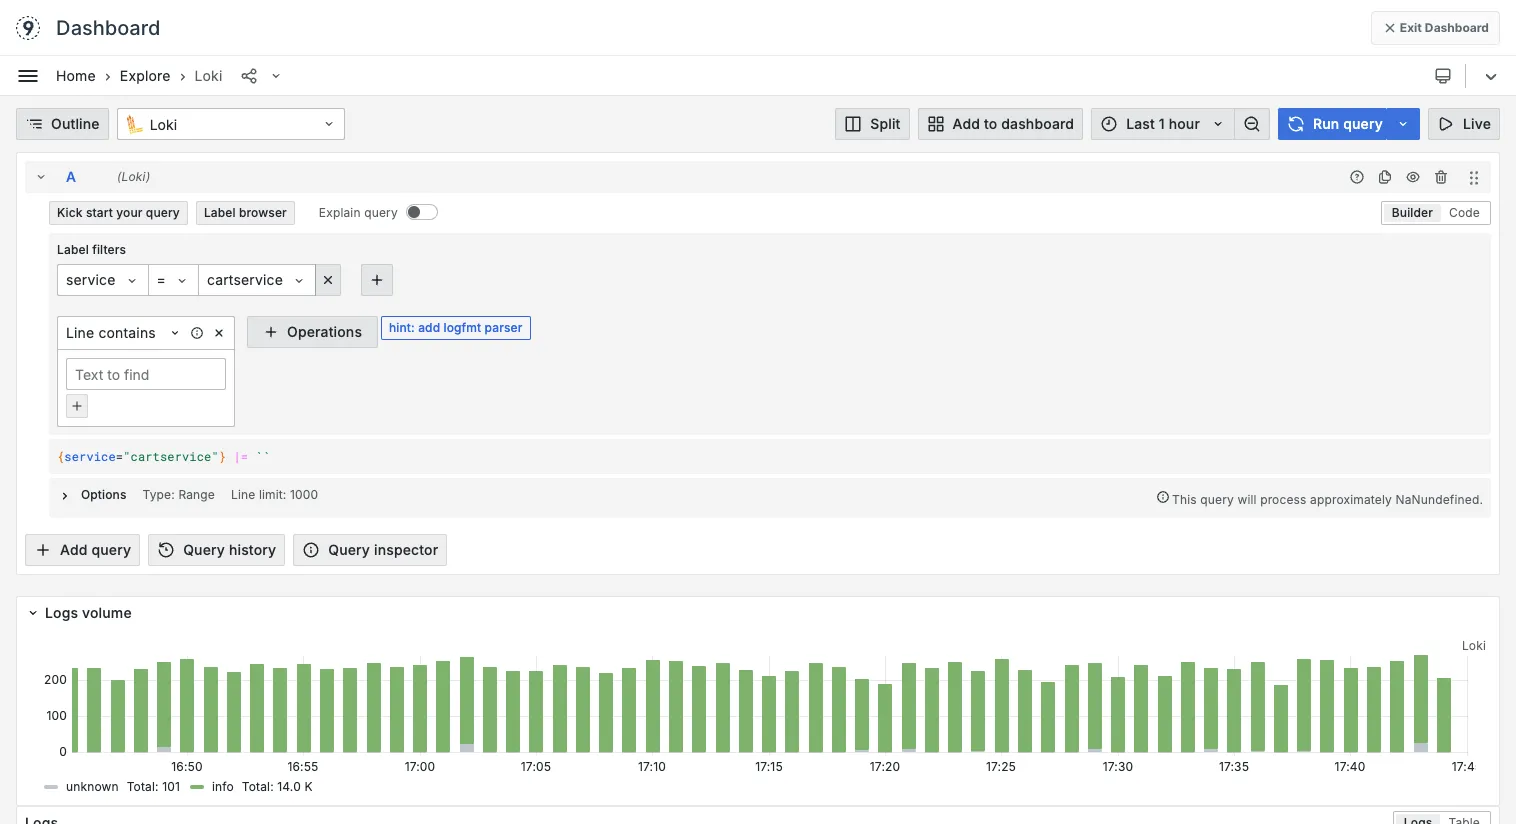
Last9 provides a Grafana Loki interface using LogQL to explore your logs data.

- Access the Loki UI by visiting Grafana Explore and selecting Loki as the datasource.
- You can perform LogQL queries to explore logs in this interface. This is useful for structured exploration of logs data for people who are familiar with Grafana and Loki.
LogQL Compatibility
Following functions in LogQL are supported:
RATECOUNT_OVER_TIMESUM_OVER_TIMEAVG_OVER_TIMEMAX_OVER_TIMEMIN_OVER_TIMESUMAVGCOUNTMAXMINSTDDEVMEDIANSTDVAR
Following parsers in LogQL are supported:
jsonregexp
Read more about the documentation for each function here.
Creating Dashboards
Accessing Grafana
- Navigate to the Grafana section in Last9
- Create a new dashboard by clicking Create Dashboard
- Add a new panel to begin visualizing your data
Selecting Loki Data Source
The Loki data source comes pre-configured in Last9’s embedded Grafana, so you can start querying immediately.
Query Construction Methods
Using Builder Mode
Builder mode provides a visual interface for constructing Loki queries without writing LogQL. Here’s how to use it:
-
Label Selection
- Click Add label to start building your query
- Select labels (e.g., service, severity) from the dropdown
- Choose operators (=, !=, =
, !) - Select or type values for the labels
-
Operations
- Add operations using the Operations button
- Common operations include:
- Line contains
- Line does not contain
- Line contains regex
- Line does not contain regex
- JSON
-
Aggregations
- Click Add range function
- Select functions like:
- Rate
- Count over time
- Sum over time
- Avg over time
- Set time windows ([1m], [5m], [1h])
-
Examples Using Builder Mode:
Basic Query:
- Label:
service = "auth-service" - Operation:
Line contains "error" - Range:
count_over_time [5m]
Advanced Query:
- Label:
service =~ "api.*" - Label:
severity = "error" - Operation:
JSON - Operation:
Line contains "timeout" - Range:
sum by (status_code)
- Label:
-
Builder to Code Mode
- Switch between modes to see the LogQL equivalent
- Learn LogQL syntax through the Builder interface
- Fine-tune queries in Code mode
Writing LogQL Queries
For advanced users or complex queries, you can write LogQL directly:
Basic Query Structure:
{service="your-service"}Common Aggregation Patterns:
sum by (severity) (count_over_time({service="your-service"}[5m]))Key Query Components
- Label matchers:
{label="value"} - Line filters:
|= "error" - Aggregation functions:
sum,avg,max - Time windows:
[1m],[1h],[1d]
Understanding Window Behavior
Remember that Last9’s window behavior differs from standard Loki:
- Last9 uses tumbling windows (window size = step size)
- Both window and step size are defined by the
[]parameter - For instant queries, match time range to window size
Creating Visualizations
Panel Types
-
Time Series
- Best for tracking metrics over time
- Suitable for rate and count queries
-
Bar Charts
- Good for comparing values across categories
- Works well with
sum byaggregations
-
Tables
- Useful for detailed log analysis
- Can show multiple columns of log data
Panel Configuration
- Set appropriate panel title and description
- Configure axes and legends
- Set up thresholds and alerts if needed
- Choose color scheme for better visibility
Advanced Query Techniques
Using Multiple Queries
sum(rate({service="auth-service"} |= "error" [5m])) by (severity)sum(rate({service="auth-service"} |= "warning" [5m])) by (severity)Pattern Matching
{service=~"auth.*"} |= "error" != "timeout"Metric Extraction
sum by (status_code) (count_over_time({service="api"} | json | status_code != "" [5m]))Complex LogQL Examples
Example 1: Cart validation mismatches observed in incoming requests
Counts occurrences (per 10m tumbling window) where service = "your-service" logs include any of several generic validation patterns and also include the phrase “received in the request”.
count_over_time({service="your-service"} |~ "validation error|missing field|missing parameter|mismatch id|mismatch sku|sample sku" |= "received in the request" [10m])Example 2: Cart fetch errors for userId, excluding unrelated variant
Counts occurrences (per 10m tumbling window) where service = "your-service" logs match either a generic fetch error pattern or an “Invalid” condition, while excluding logs that match the broader “Unexpected error while fetching the … response” variant.
count_over_time({service="your-service"} |~ "Unexpected error while fetching .* response for .*|.*exception.*Invalid.*No .* found .*" !~ "Unexpected error while fetching .* response" [10m])Example 3: Processing errors for large item counts (50–100)
Counts occurrences (per 15m tumbling window) where service = "your-service" and label item_count is between 50 and 100 (inclusive), and the log line indicates a processing/serviceability error.
count_over_time({service="your-service", item_count=~"50|51|52|53|54|55|56|57|58|59|60|61|62|63|64|65|66|67|68|69|70|71|72|73|74|75|76|77|78|79|80|81|82|83|84|85|86|87|88|89|90|91|92|93|94|95|96|97|98|99|100"} |~ "Error in (default|source) .* (processing|serviceability)" [15m])LogQL boolean logic and symbols (quick primer)
- AND (combine conditions): Chain filters with
|. All stages must match.- Example:
{service="your-service"} |= "error" !~ "timeout".
- Example:
- OR (alternatives): Use regex alternation
foo|barinside|~or label regex=~.- Example:
{service=~"api|auth"} |~ "(fail|error)".
- Example:
- NOT (exclude): Use
!=for literal or!~for regex.- Example:
!= "error" !~ "(debug|test)".
- Example:
- Literal vs regex line filters:
|= "text"matches literal.|~ "pattern"uses regex. Group with( ), alternate with|, wildcard with.*.
- Label matchers:
{key="value"},{key!="value"},{key=~"a|b"},{key!~"a|b"}.- Multiple label matchers inside
{...}are ANDed.
- Escaping:
- Escape special regex chars like
.as\\.. In docs, escapes may appear doubled.
- Escape special regex chars like
- Range functions and windows:
count_over_time(<log stream | filters> [10m])counts matches in a 10m window.
Dashboard Organization
Best Practices
- Group related panels logically
- Use consistent time ranges across related panels
- Add descriptive titles and documentation
- Consider user permissions and sharing settings
Layout Tips
- Arrange panels in order of importance
- Use rows to group related visualizations
- Consider different screen sizes and resolutions
Performance Optimization
Query Efficiency
- Use label filters before line filters
- Start with Service and Severity filters for better performance
- Avoid processing unnecessary data
Time Range Considerations
- Start with smaller time ranges during development
- Consider data retention policies
- Use appropriate aggregation intervals
Troubleshooting
Please get in touch with us on Discord or Email if you have any questions.