Creating Log Analytics Dashboards
Guide to creating Log Analytics Dashboards from aggegragated queries in Logs Explorer
Introduction
Creating custom log analytics dashboards in Last9 allows you to visualize and monitor log data through aggregated metrics. This guide explains how to create and promote log queries into dashboard visualizations.
Starting with Logs Explorer
Using Editor Mode
-
Navigate to the Logs Explorer in Last9
-
Switch to Editor Mode — this enables writing advanced LogQL-compatible queries
-
Write a normal query to explore your data
{service="adservice"} -
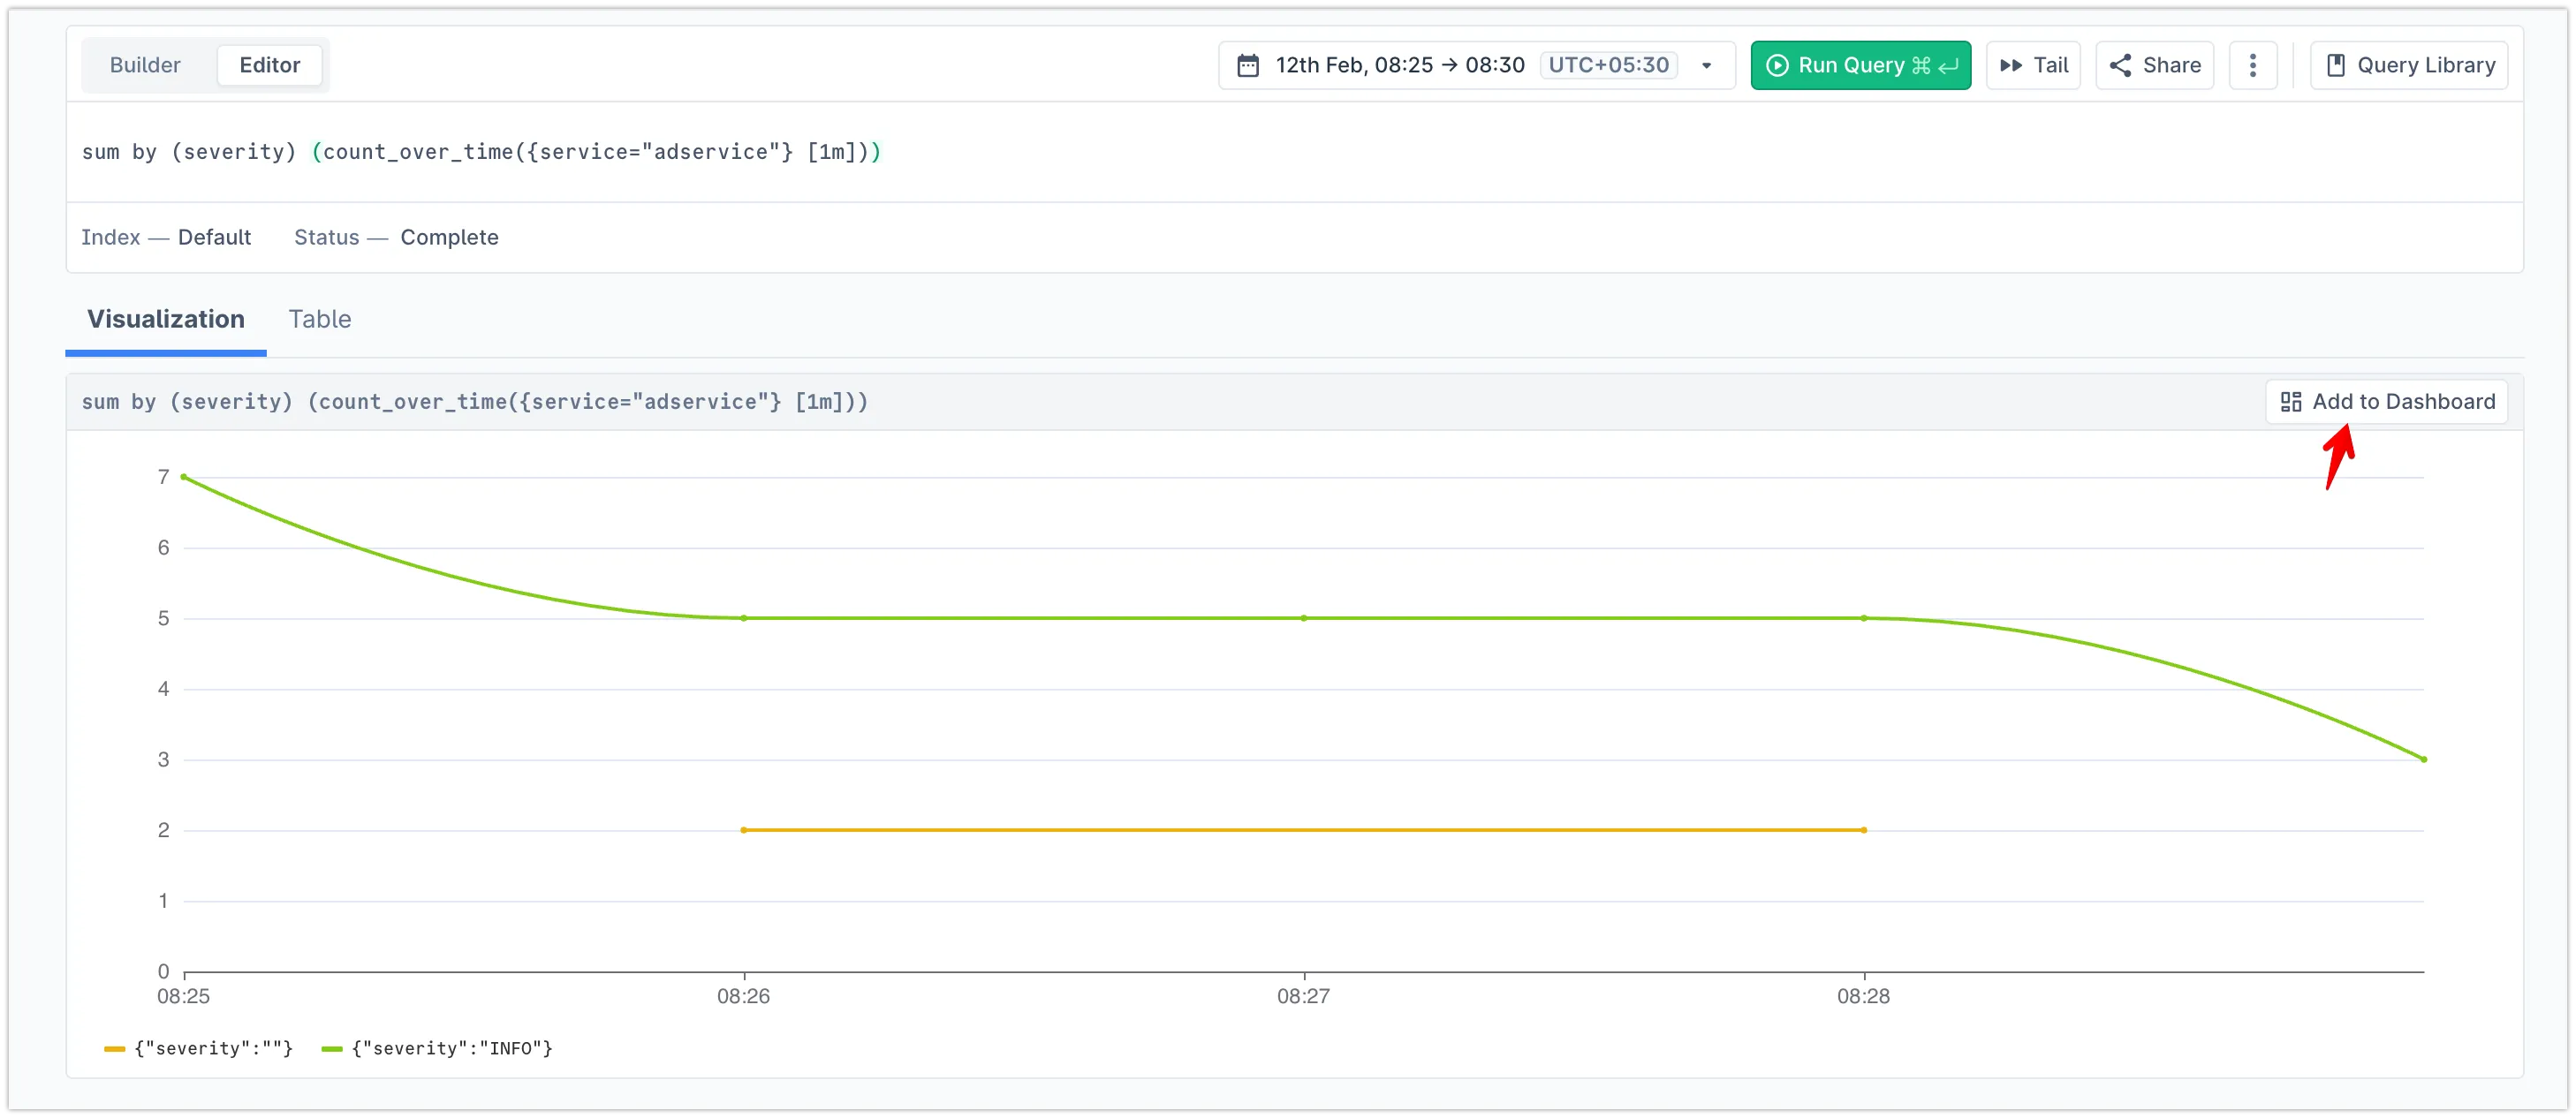
Convert it into an aggregation query by adding an aggregation function
sum by (severity) (count_over_time({service="adservice"} [1m])) -
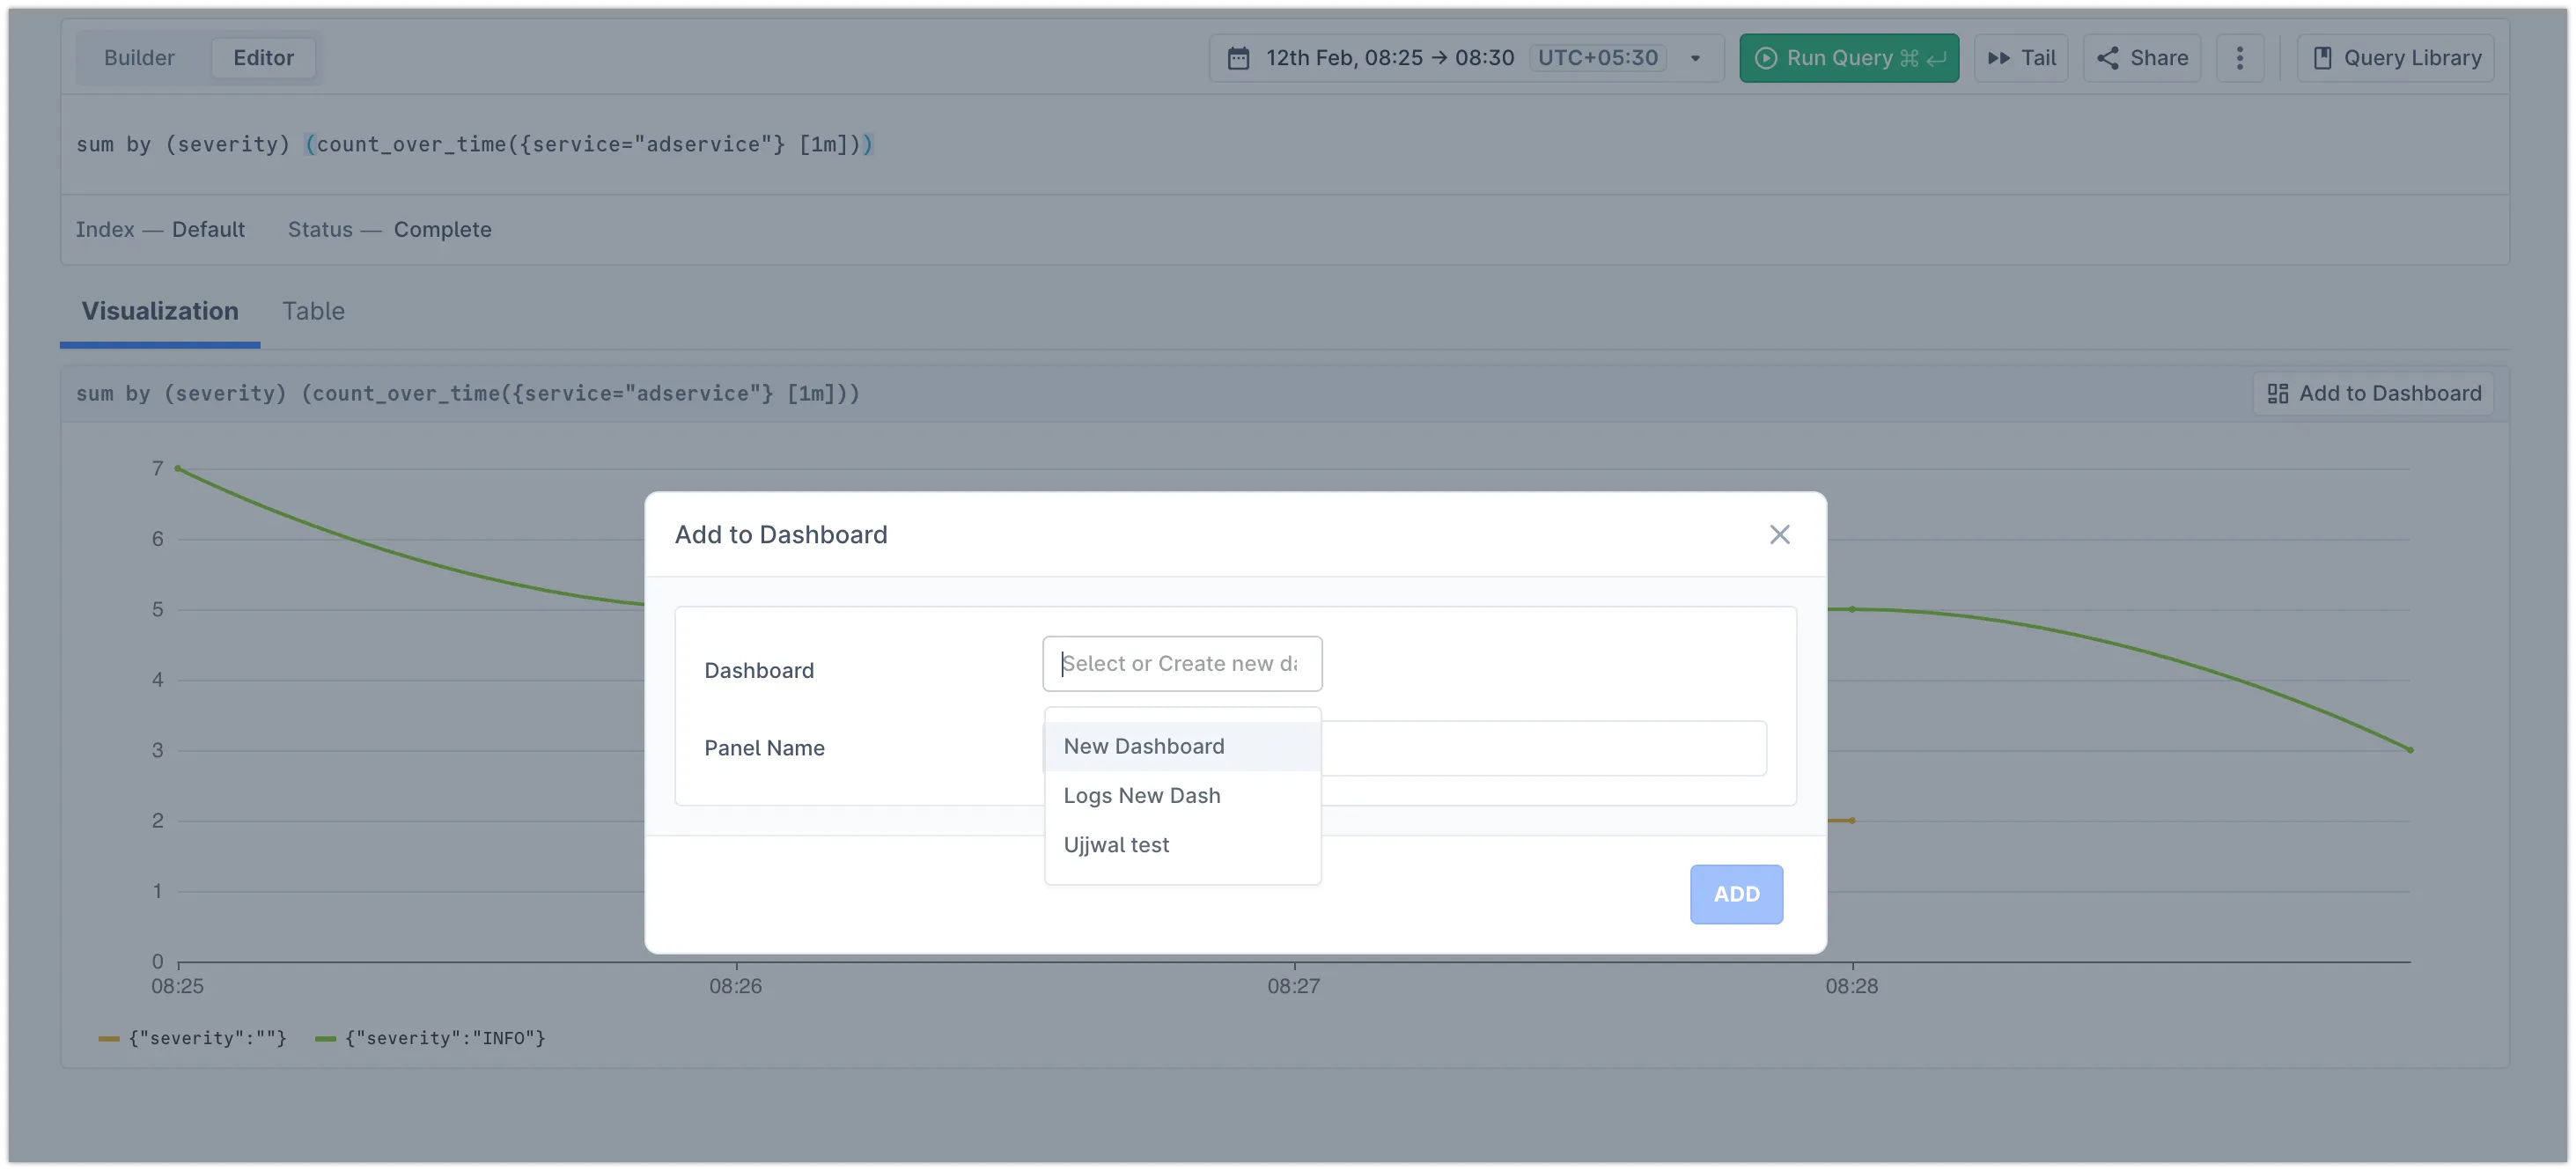
Promote the query to a dashboard by clicking the Add to Dashboard button

-
Create a new dashboard or add it to an existing dashboard by adding a unique panel name

-
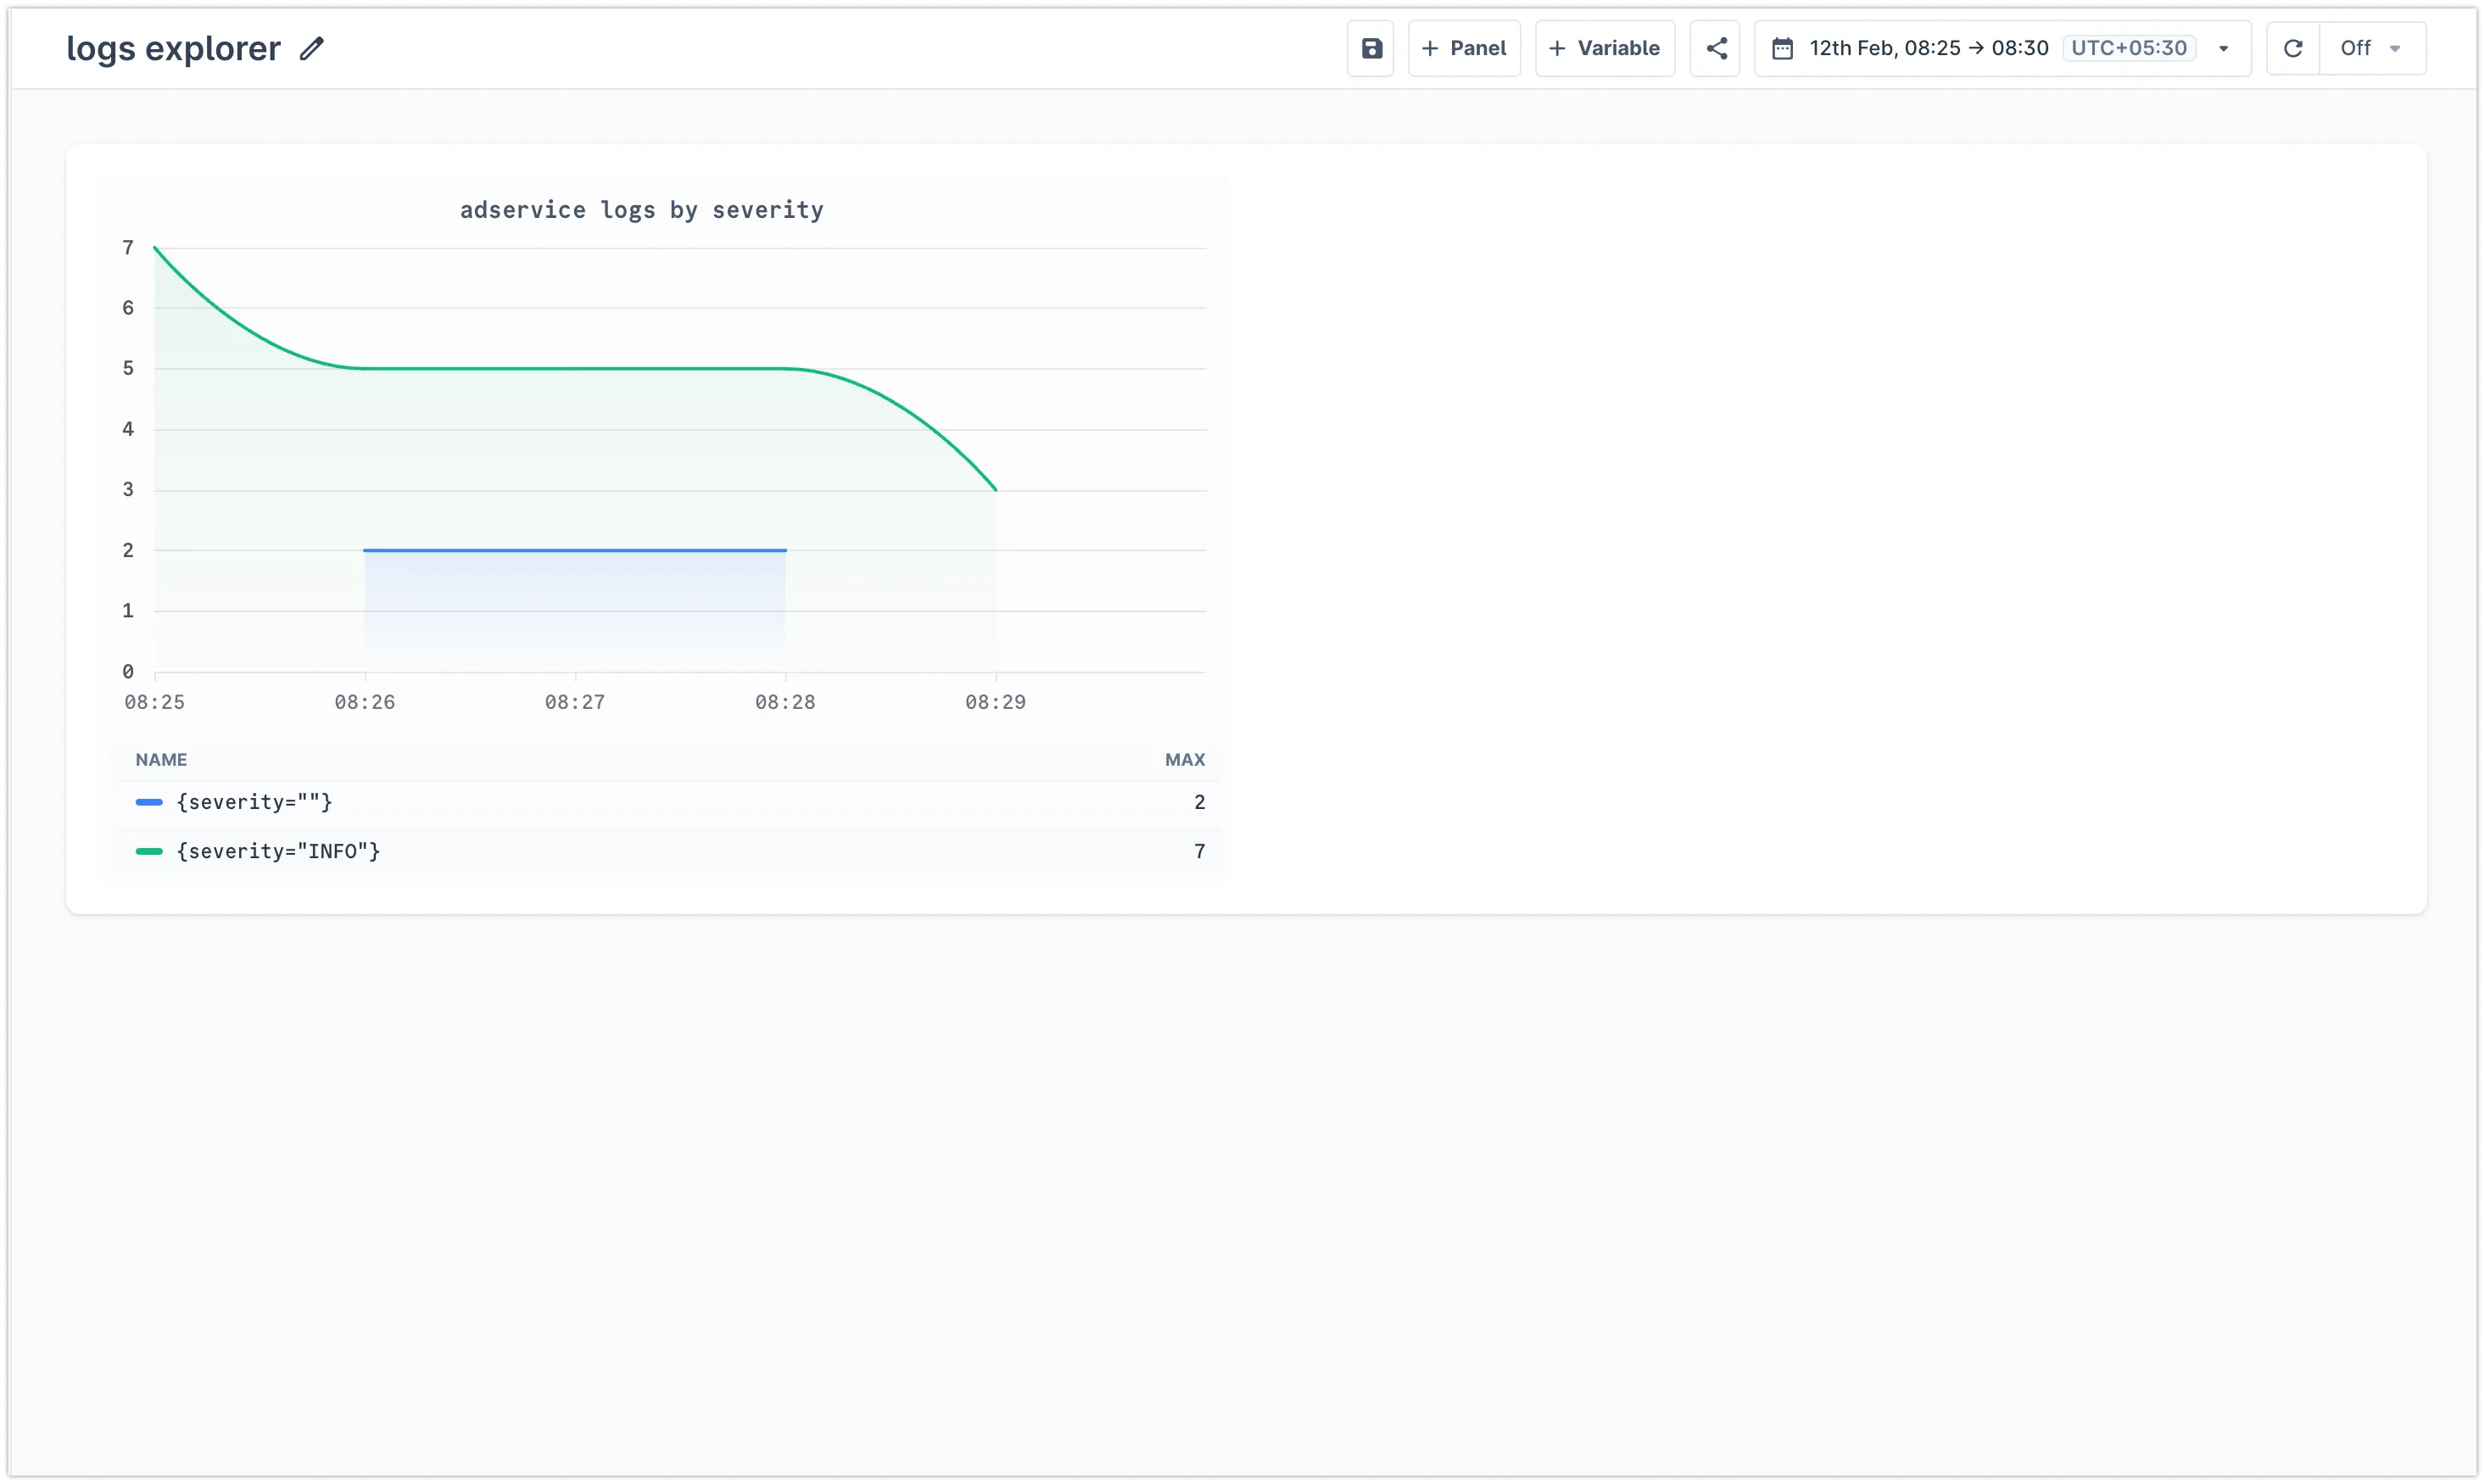
You will be redirected to the new dashboard with your query added as a panel

-
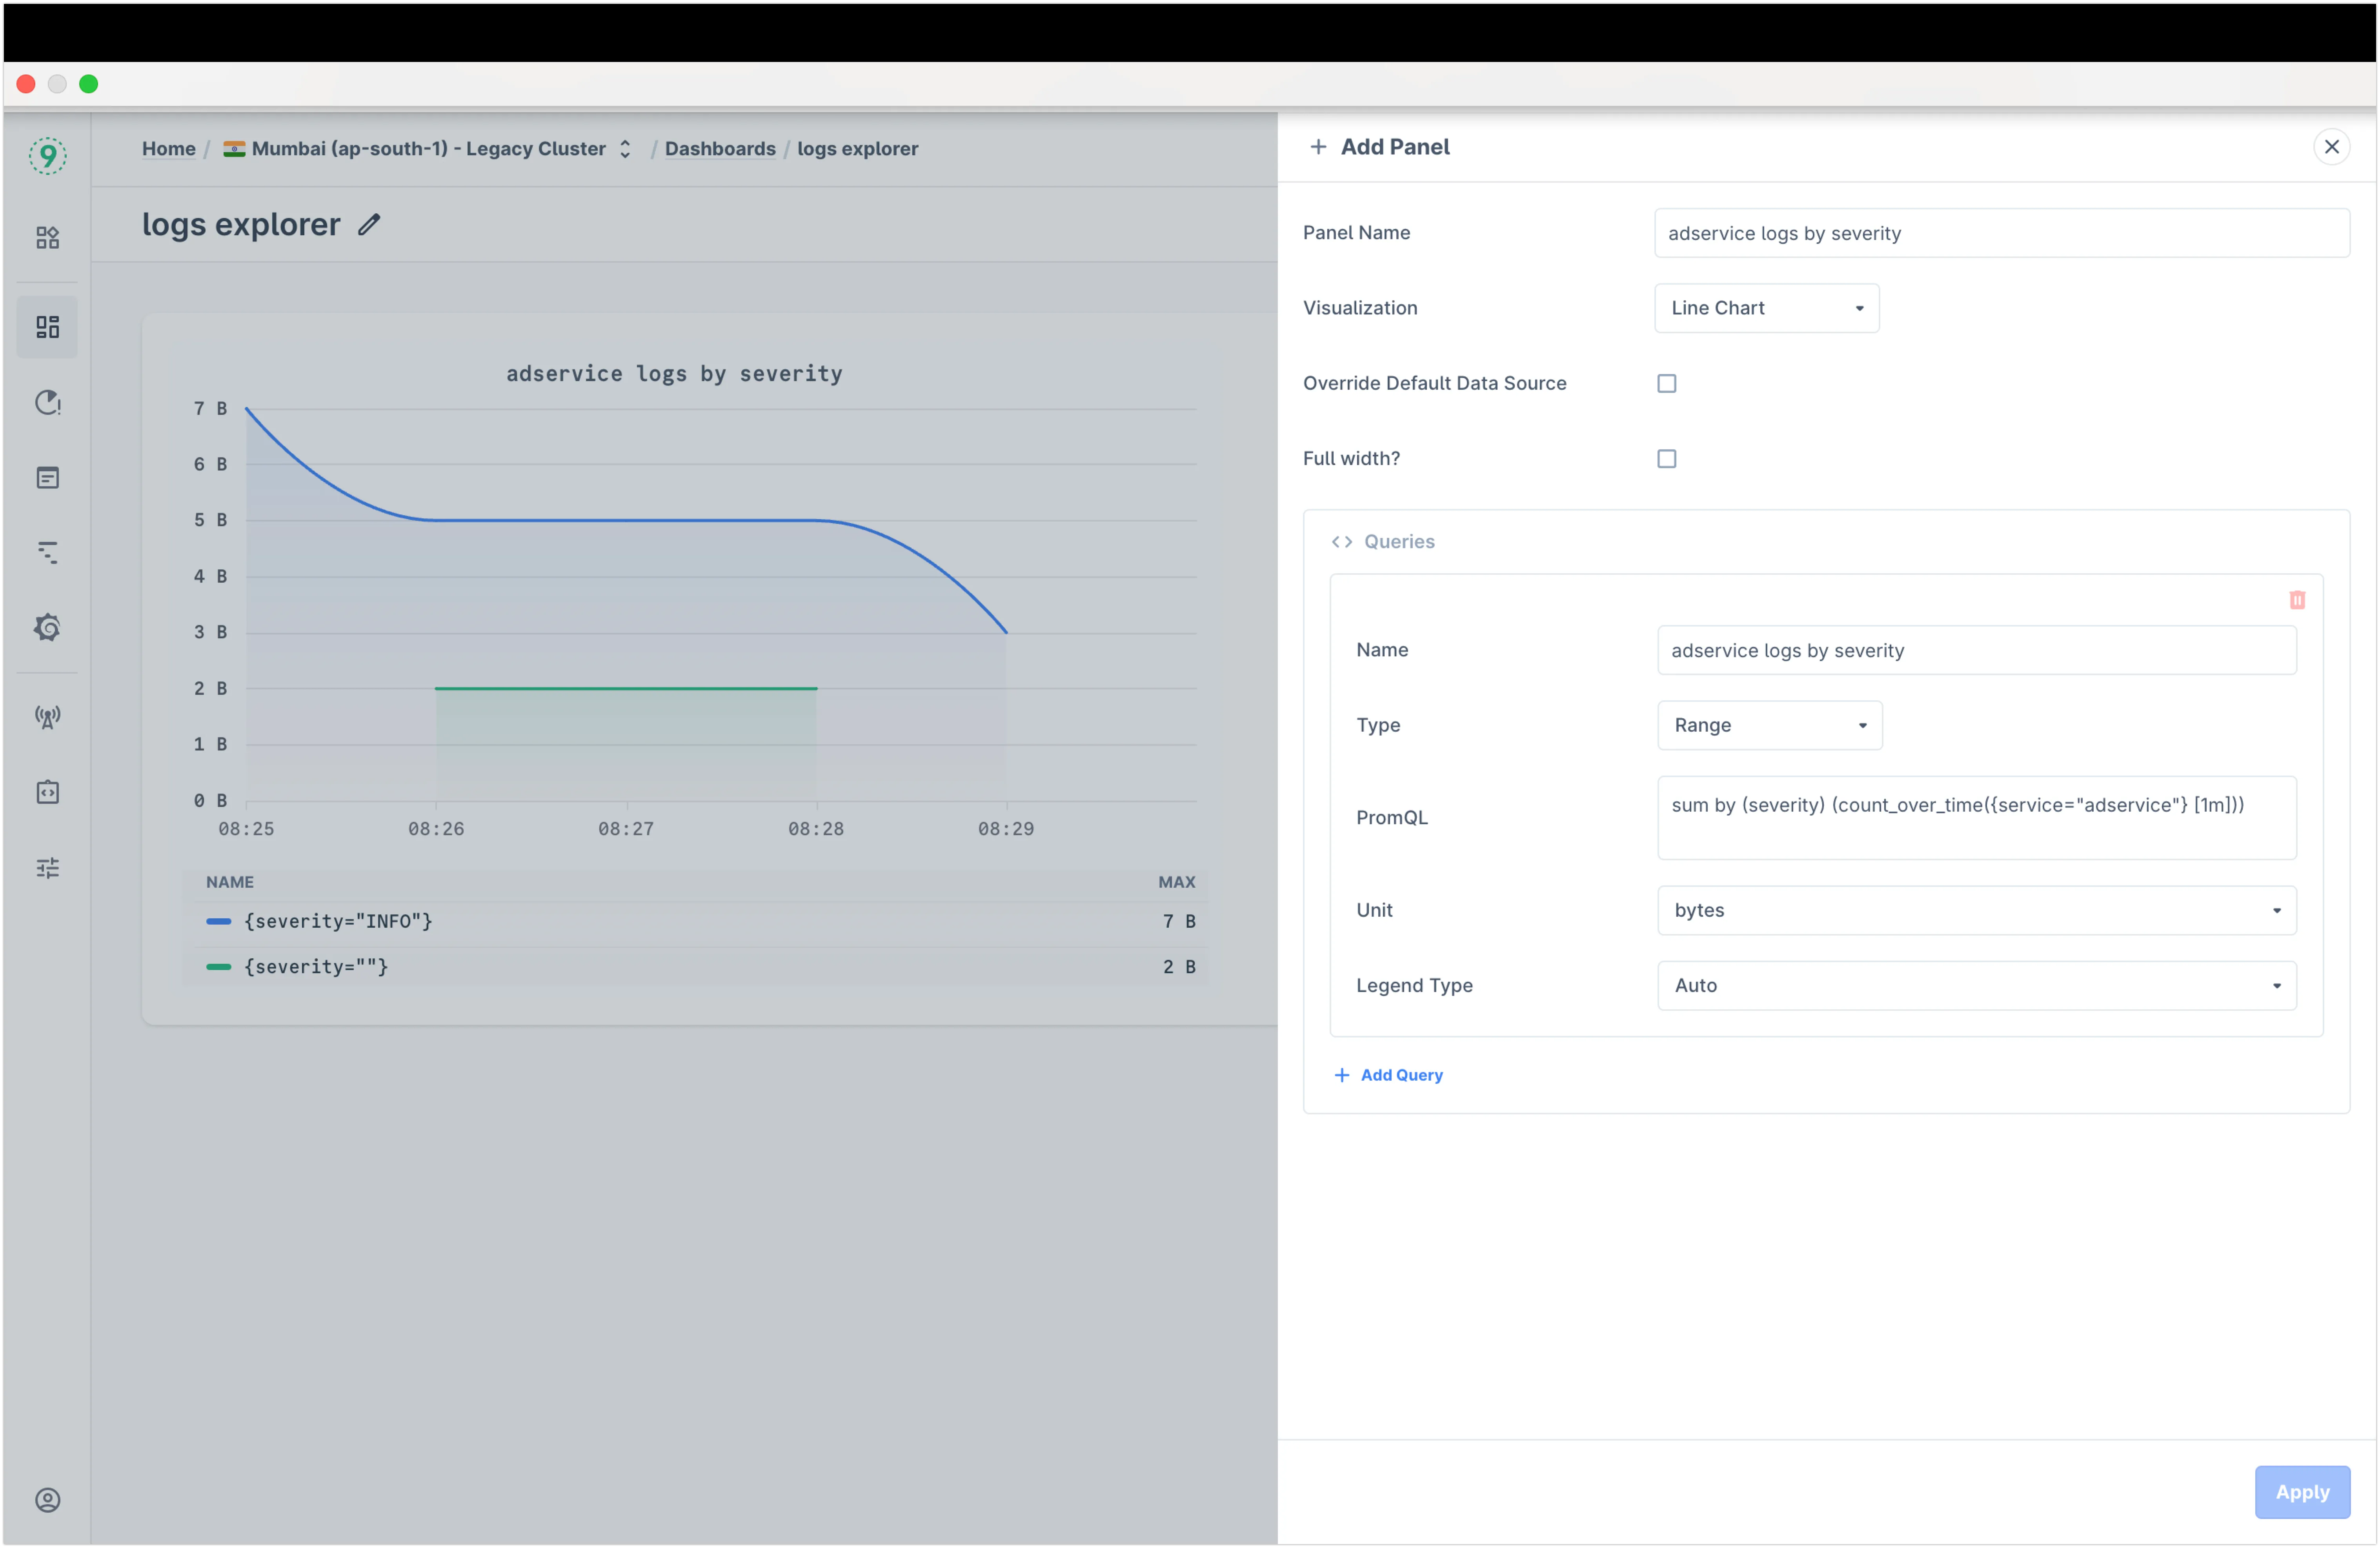
You can edit the panel by clicking the ⋮ button and then the edit button

-
Add multiple panels to the dashboard by following the same steps as above
Supported Aggregation Functions
Last9 supports several aggregation functions for creating meaningful visualizations:
-
Time-based aggregations:
count_over_time: Counts the number of logs over timesum_over_time: Sums the values of a numeric field over timeavg_over_time: Averages the values of a numeric field over timemax_over_time: Finds the maximum value of a numeric field over timemin_over_time: Finds the minimum value of a numeric field over timerate: Calculates the rate of change of a numeric field over time
-
Statistical aggregations:
sum: Sums the values of a numeric fieldavg: Averages the values of a numeric fieldcount: Counts the number of logsmax: Finds the maximum value of a numeric fieldmin: Finds the minimum value of a numeric fieldstddev: Calculates the standard deviation of a numeric fieldmedian: Finds the median value of a numeric fieldstdvar: Calculates the standard variance of a numeric field
Query Construction Guidelines
Time Windows
Specify time windows using the following formats:
- Minutes:
[1m] - Hours:
[1h] - Days:
[1d]
Query Examples
Basic severity-based aggregation:
sum by (severity) (count_over_time({service!="user-service"} [1m]))Complex bucket-based aggregation:
sum by (bucket) (count_over_time({ service="unknown", ingestor="s3", bucket=~"elb-logs", log.file.path=~".*api.*"} [3h]))Best Practices
Time Range Selection
- Match window size to query requirements
- For instant queries, set time range equal to window size
- Consider data retention and query performance when selecting time ranges
Query Performance
- Leverage accelerated queries by including Service or Severity filters
- Use specific filters to reduce data scanning
- Test queries with smaller time ranges before expanding to larger windows
Dashboard Organization
- Group related visualizations together
- Use clear, descriptive titles
- Include context in dashboard descriptions
- Set appropriate refresh intervals based on data update frequency
Troubleshooting
Please get in touch with us on Discord or Email if you have any questions.