

A time series chart is easy to read when it has two lines and one question. It gets harder when an incident dashboard puts every service, region, pod, tenant, or status state into the same panel.
The failure is rarely the query. The query may be correct. The dashboard still fails if generated colors collide, a red line means one thing on one panel and another thing elsewhere, or a missing series changes the legend order while someone is debugging.
This guide covers the design layer that most generic chart guides skip: hover focus, accessible dashboard color palettes, per-line colors, legend placement, variables, and missing-data behavior for production observability dashboards.
What makes a time series chart unreadable in observability dashboards
A time series chart in monitoring plots a metric value against time, usually as a line or area chart. It works best when the reader can answer one question quickly: is latency rising, did error rate change after a deploy, or which service is the outlier?
Dense observability dashboards break that model in a few predictable ways:
- Color stops identifying series. Generated palettes can put two important lines close together, especially on dark backgrounds.
- The legend becomes the chart. Readers scan the legend more than the graph because the lines do not identify themselves.
- Hover does too much work. If a line only becomes identifiable after precise mouse movement, keyboard users and screen magnification users get a worse version of the dashboard.
- Missing data changes the story. A silent service may disappear from the graph and make the remaining legend look cleaner than it should.
- One panel answers too many questions. Trend, outlier, status, ownership, and service identity compete in the same 600-pixel card.
A production dashboard needs more than a nicer palette. It needs a stable visual contract: names, colors, order, thresholds, filters, and annotations should mean the same thing every time responders open the panel.
A time series chart example: API latency across services
Start with a common dashboard panel: p95 API latency for checkout, auth, catalog, and payments over the last hour.
The panel looks simple until traffic shifts. checkout spikes after a deploy. auth has a brief scrape gap. payments is slower but steady. catalog is quiet, but still important because it sits on the critical path.
A good time series chart separates three reading tasks:
| Reading task | What the operator needs | Design support |
|---|---|---|
| Trend | Did latency rise or fall? | Clear y-axis, change markers, sane time range |
| Outlier | Which service moved away from the group? | Line weight, hover focus, direct tooltip |
| Identity | Which line is which service? | Stable legend, pinned color, display name override |
If the same panel also tries to compare regions, deploy versions, status classes, and tenant tiers, split it. Use variables for filtering or repeat panels for side-by-side comparison. A single chart should not make the reader solve a color puzzle before they can investigate the incident.
Use hover emphasis when one line needs inspection
Hover emphasis is the interaction pattern where the selected line gets stronger while the rest of the chart fades into context. A Prometheus UI issue requested this behavior for graph lines that were hard to distinguish when colors were similar or when a graph had many lines. Treat that as a long-standing request, not a Prometheus release note.
Good hover behavior changes more than the tooltip:
- Increase the hovered line’s stroke width.
- Reduce opacity for non-hovered lines without hiding them.
- Keep the tooltip, legend row, and crosshair in sync.
- Preserve the highlighted line while the pointer moves across nearby dense regions.
- Make the same series discoverable from the legend, not only from the line itself.
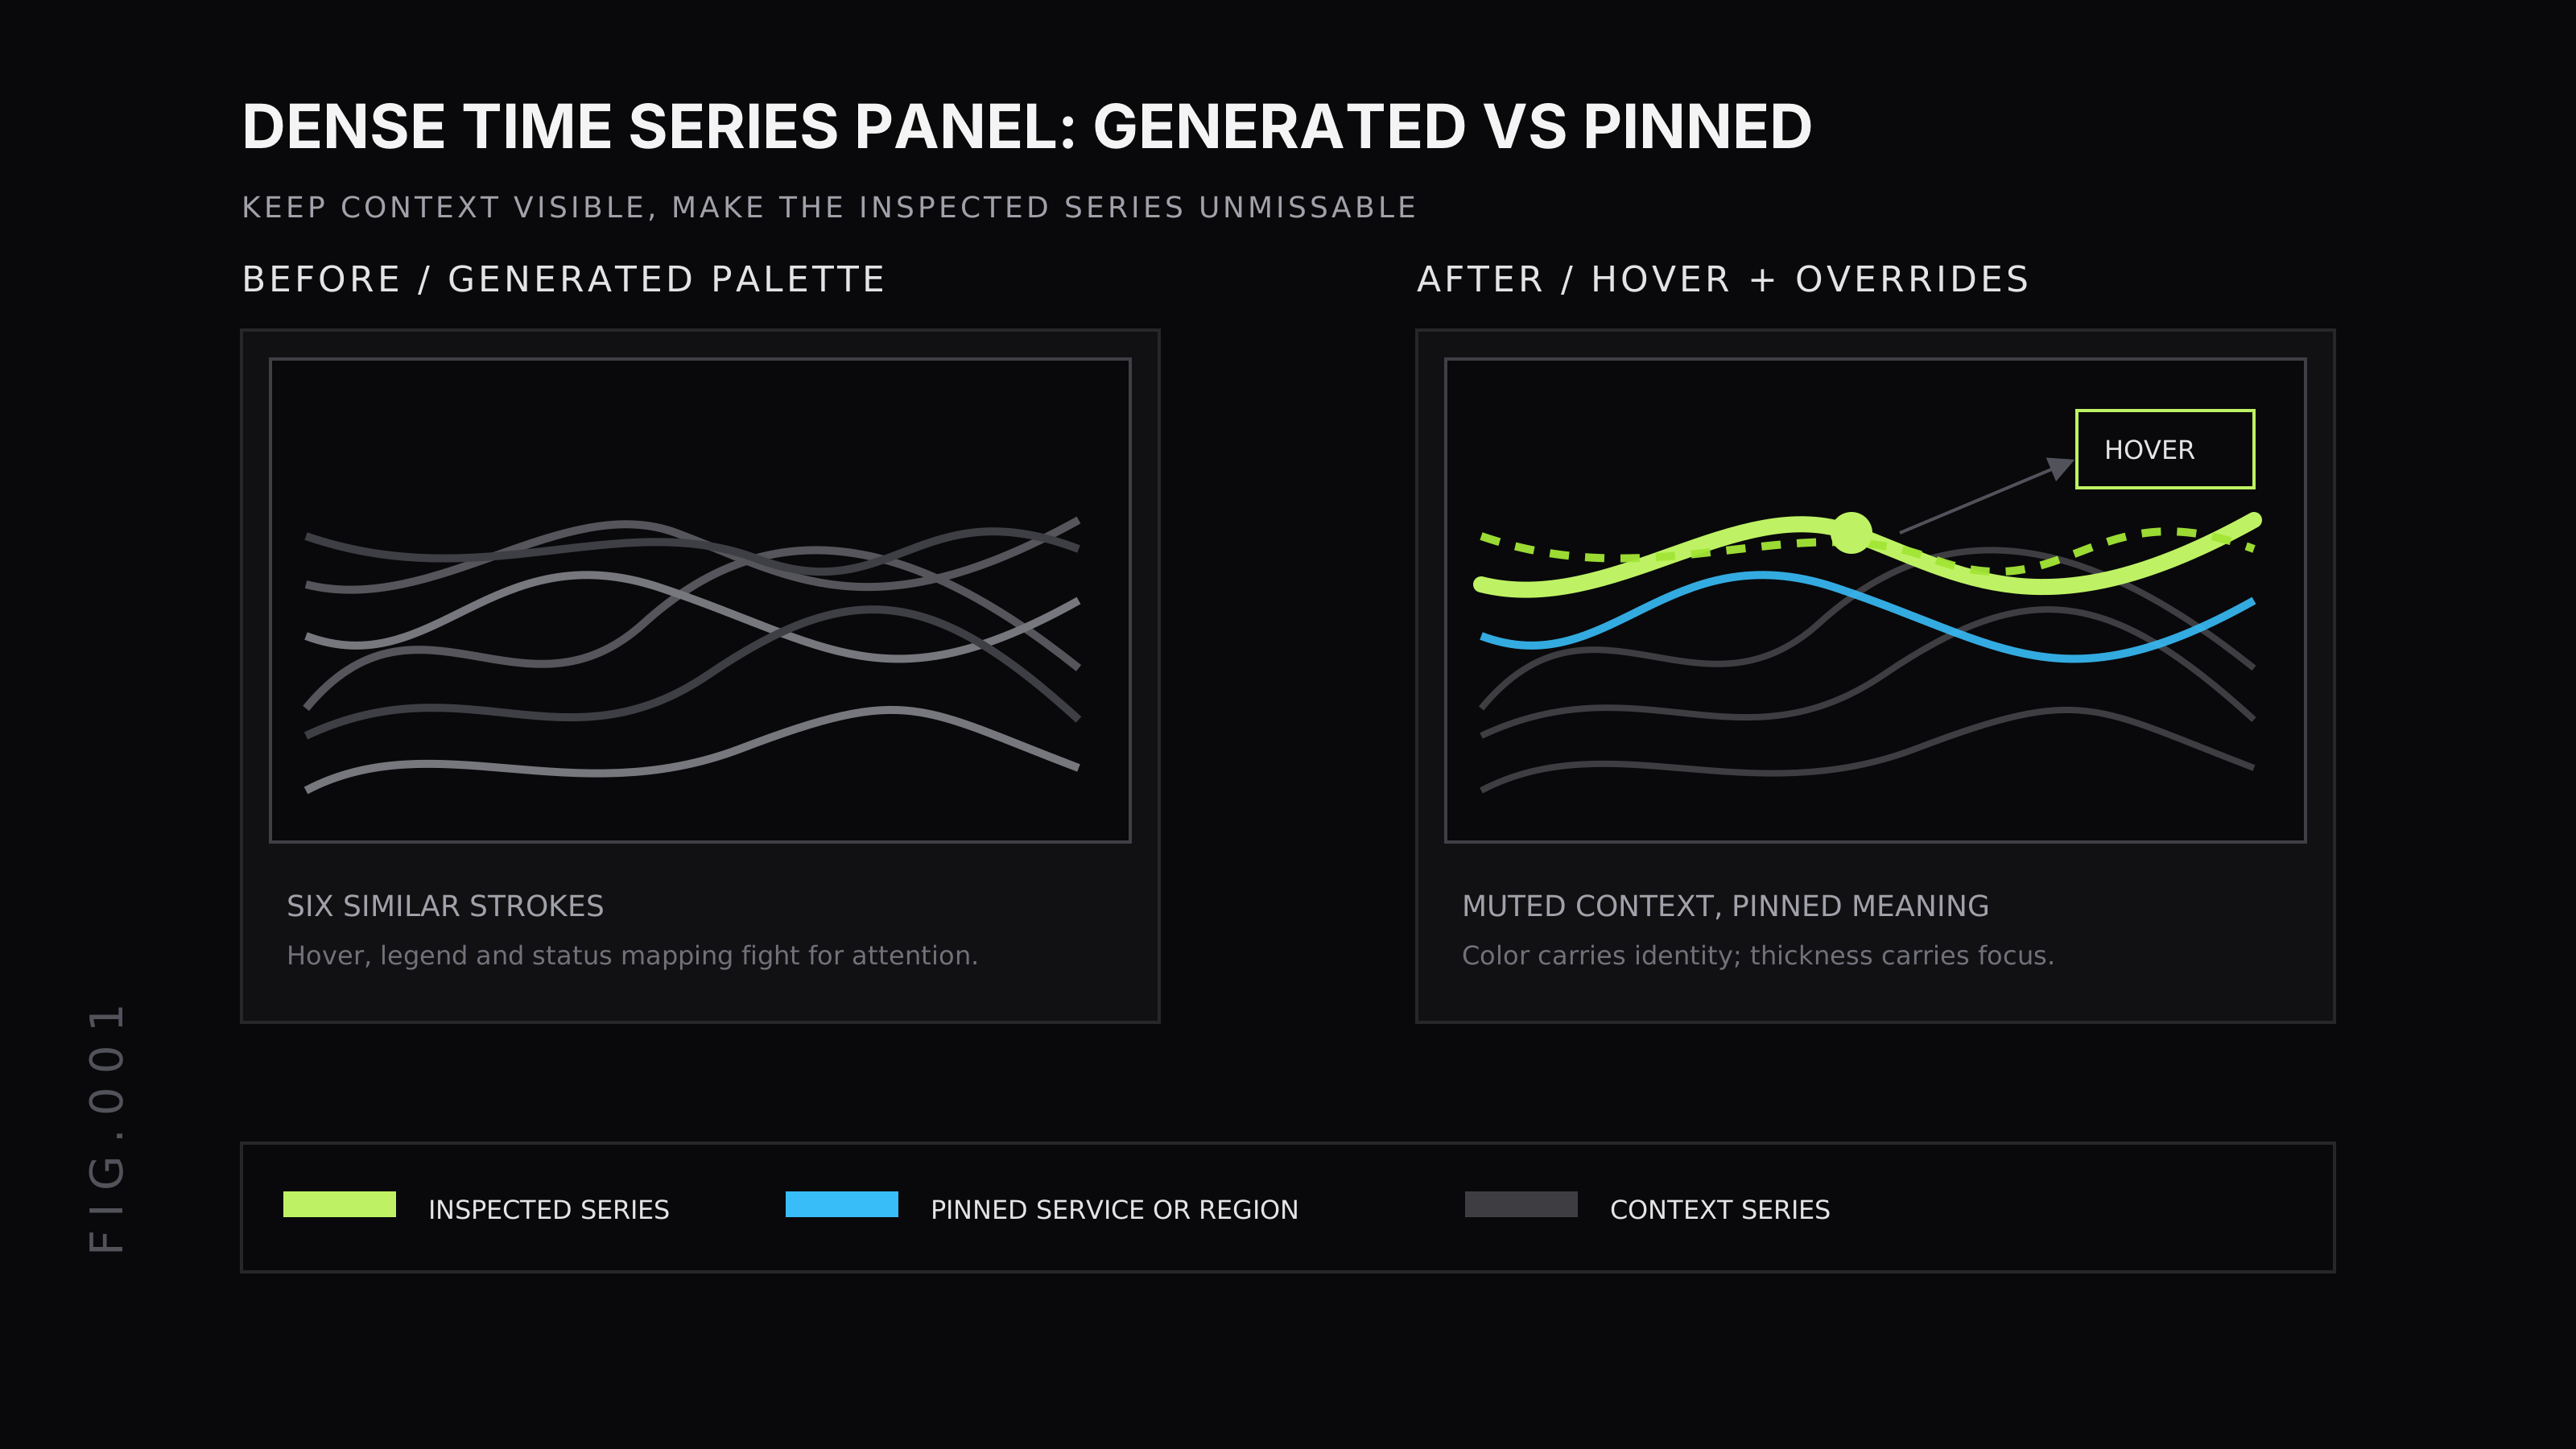
Do not make hover the only accessibility mechanism. A dashboard still needs readable labels, high-contrast strokes, useful legend text, and keyboard-accessible inspection paths where the product supports them.
Choose a dashboard color palette that survives incidents
A dashboard color palette has a harder job than a brand palette. It must remain readable under stress, on dark and light screens, for people with color-vision differences, and across panels that teams did not design together.
Use this order:
- Contrast first. Lines and thresholds need enough contrast against the panel background. WCAG’s non-text contrast guidance covers graphical objects and states, not only body text.
- Hue distance second. Do not put operationally adjacent series in barely separated blues, greens, or grays.
- Semantic meaning third. Reserve red, amber, and green for status or threshold meaning. If every service gets a status color, no status color means anything.
- Redundant cues always. Pair color with display name, legend grouping, line weight, dash style, or annotation.
A practical palette is smaller than teams expect. Pick fixed colors for the few series that carry operational meaning: critical services, SLO thresholds, business states, or regions. Let generated colors handle low-importance comparison series only after the important mappings are pinned.
When to use per-line colors instead of generated palettes
Generated palettes are fine for exploratory charts. They are weak for dashboards where a color has to mean the same thing every time.
Use per-line colors when the line is tied to a stable operational concept:
errorversussuccesscritical,warning, andhealthy- primary region versus failover region
- checkout, payments, or another service that always owns a panel slot
- SLO target or error-budget burn band
- business states such as approved, declined, pending, or refunded
Last9 supports this through field overrides in dashboard panels. An override can target a query reference or field/series name, then set properties such as Display name, Color, Unit, Axis placement, Decimals, and axis min or max. The override changes how the matched series renders; it does not mutate the query data.
For a multi-query panel, that means you can give Query A a fixed display name and color while leaving the rest of the panel on default settings. Use that sparingly. If every arbitrary series gets a custom color, the dashboard becomes harder to maintain than the query.
A good rule: pin colors for meanings that survive the current incident. Do not pin colors just because today’s panel happened to generate an ugly one.
Keep legend order stable when data is missing
Missing data is itself a signal. A scrape gap, a service with no traffic, a removed label, or a failing exporter can make a series vanish at the exact moment the operator needs to notice it.
The design practice is simple: do not let missing samples reshuffle the operator’s mental map. Keep the legend order tied to configured priority where possible, not only to the last value returned by the query.
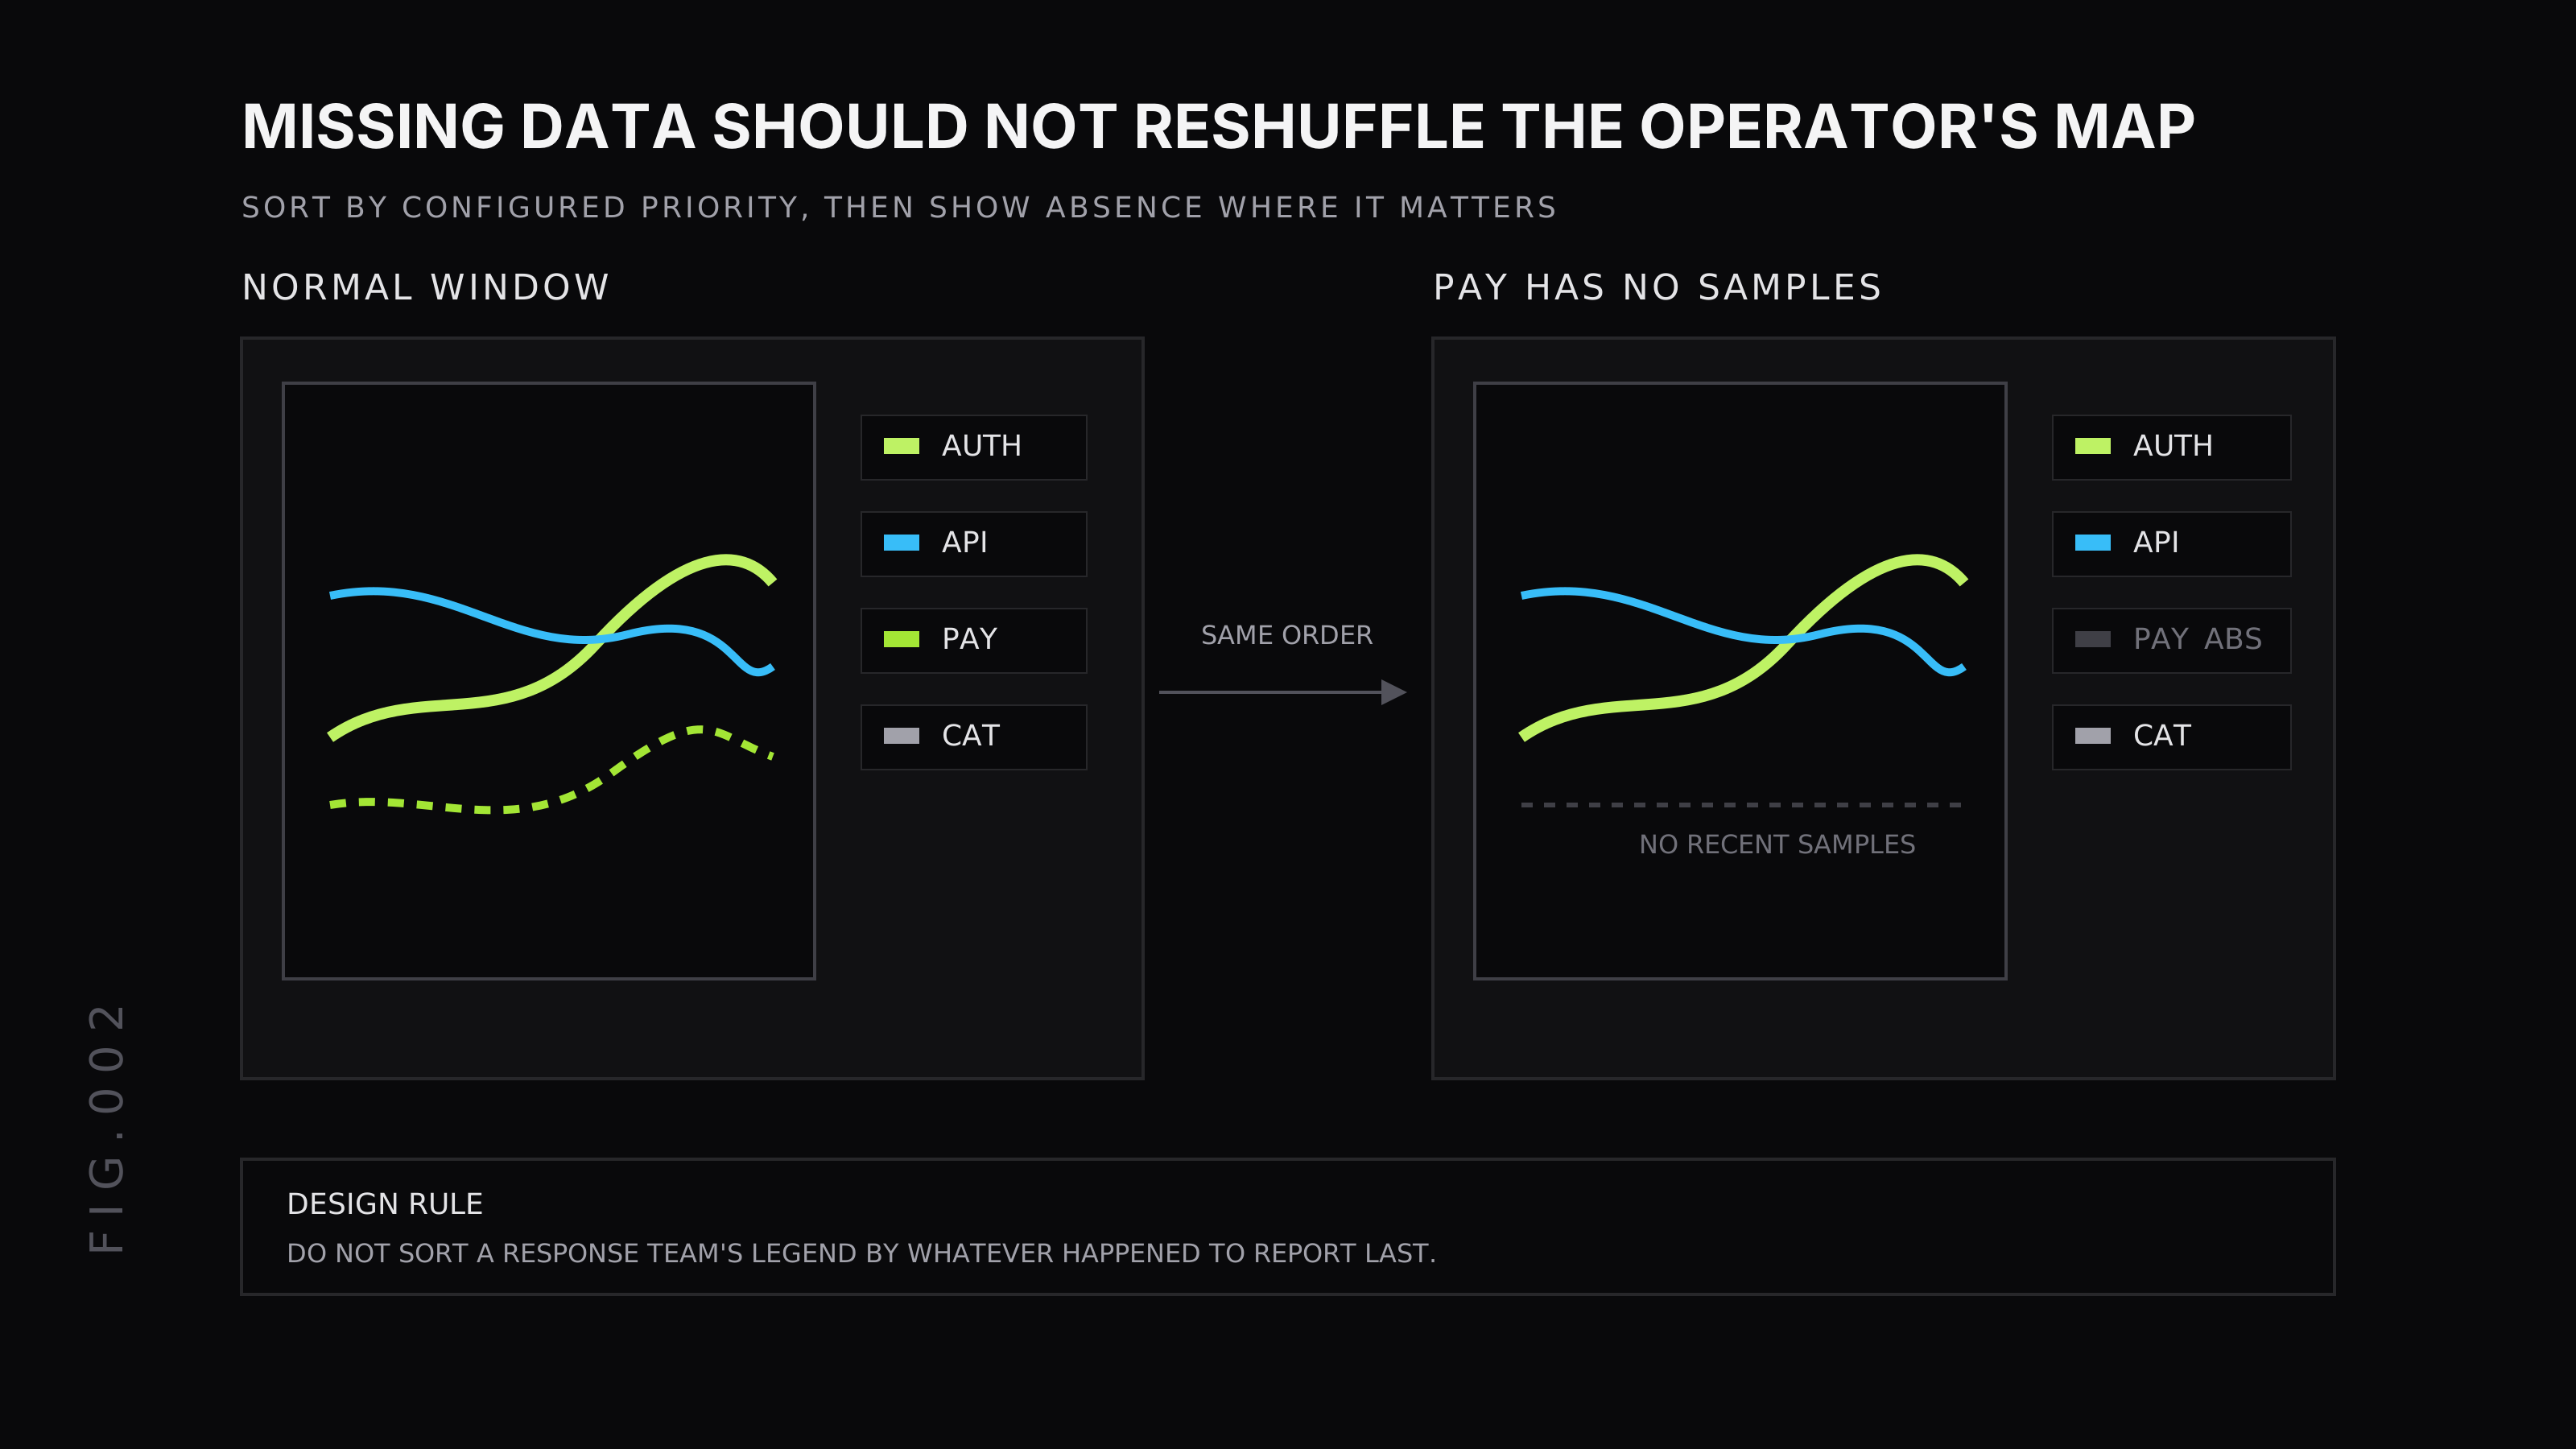
There are tradeoffs. Sorting by latest value is useful for top-N panels where the question is “what is worst right now?” It is less useful for canonical service-health panels where responders expect auth, api, payments, and catalog to stay in the same order.
Use these rules:
- Sort by configured priority for shared runbook dashboards.
- Sort by latest value for exploratory top-N views.
- Mark absent series when absence changes the operational meaning.
- Keep display names stable across time ranges and refreshes.
- Avoid hiding a missing critical service just because it has no current samples.
Different tools handle absent series differently. If stable ordering matters to your team, test it with missing data before the dashboard becomes part of an incident workflow.
Last9 dashboard controls for dense time series panels
Last9 dashboard panels give you several controls that help before a time series chart becomes unreadable.
The Chart Settings docs document settings for Legend Type, Legend Placement, and Display Type. For a dense time series panel, those controls decide whether the legend helps scanning or steals chart space.
Use Custom legend labels when raw label sets are too noisy. A legend entry like service="checkout", cluster="prod-us-east-1", route="/api/v1/pay" may be accurate, but it is not scannable during an incident. A custom label such as checkout / pay often works better.
Use legend placement deliberately:
| Placement | Use it when | Avoid it when |
|---|---|---|
| Bottom | Labels are short and the chart needs width | The legend wraps into several rows |
| Right | Operators compare line identity often | The panel is narrow |
| Left | Names matter before values | The chart loses too much plot area |
Use dashboard variables to filter dense panels before color fails. A service, region, environment, or cluster variable lets the reader narrow the chart without editing PromQL. Last9 label variables read values from metric labels, and the resolved variable can be used in metrics, logs, and traces queries.
Use field overrides for the few series whose display name or color should stay fixed. Use threshold bands when the y-axis value has operational ranges that readers must see without reading the legend.
Prometheus and Grafana considerations
Prometheus, Grafana, and Last9 all make dense charts easier or harder depending on label design. The visualization is downstream of the metric shape.
PromQL label choices affect how many series land in a panel. If you group by pod, instance, route, status, and tenant in one chart, no color palette can save it. Aggregate to the identity that matches the question, then keep higher-cardinality labels available for drilldown.
Grafana’s time series visualization docs cover options such as legend display, tooltip behavior, thresholds, and standard panel configuration. Grafana variables also help filter dense dashboards before the line count gets too high.
For Prometheus-backed dashboards, decide what the panel is for before writing the query:
histogram_quantile( 0.95, sum by (le, service) ( rate(http_request_duration_seconds_bucket{env="$env"}[5m]) ))That query compares p95 latency by service. If it returns too many services, filter with a variable or split the panel. Do not keep adding colors to compensate for a panel that is answering too broad a question.
Time series chart checklist for production dashboards
Use this checklist before a dense time series chart becomes part of an on-call dashboard.
Question and scope
- The panel answers one operational question.
- The title names the metric and grouping.
- The time range matches the response workflow.
- Variables let the reader narrow service, region, cluster, or environment.
Series identity
- Legend labels are readable without parsing raw label sets.
- Critical series have fixed colors or fixed display names.
- Status colors are reserved for status meaning.
- Missing important series are visible or documented.
Readability
- Lines have enough contrast against the panel background.
- Hover focus improves inspection but is not the only cue.
- Thresholds and annotations explain operational ranges.
- The chart remains readable with realistic incident cardinality, not only with demo data.
Consistency
- Colors mean the same thing across related panels.
- Legend order is stable where responders expect fixed slots.
- Display names survive time-range changes and query refreshes.
- The dashboard is tested with missing data, many lines, and color-vision simulation.
A dense dashboard should reduce the number of things an operator has to remember. If the chart makes them decode colors, hover every line, and rebuild legend order in their head, it is not ready for production use.
FAQ
What is a time series chart in monitoring?
A time series chart in monitoring plots a metric value against time, usually as a line or area chart. SREs use it to compare latency, error rate, throughput, saturation, and other operational signals across a time range.
How many lines should a dashboard time series chart show?
Keep one time series chart focused on one operational question. A handful of important lines is usually readable; dozens of lines need filters, split panels, pinned colors, stronger legends, or hover focus.
How do you choose an accessible dashboard color palette?
Start with contrast against the dashboard background, then choose hues that remain distinguishable from each other. Reserve red, amber, and green for status meaning, and pair color with labels, line weight, or annotations.
When should you split a time series chart into multiple panels?
Split the chart when readers need to answer different questions, when one high-volume series hides smaller series, or when labels and hover interactions are doing more work than the chart itself.


