


High Cardinality in ClickHouse at Scale: What Actually Breaks
ClickHouse swallows high-cardinality telemetry at ingest, then breaks at query time weeks later. Here is what fails, and how we keep it fast in production.
Prathamesh Sonpatki

ClickHouse LowCardinality: When It Helps and When It Hurts
ClickHouse LowCardinality cuts storage and speeds up queries on low-cardinality columns, but backfires on trace IDs. How to tell the difference.
Prathamesh Sonpatki

Capturing HTTP Request and Response Bodies in .NET Traces with PHI Redaction
> Standard OTel .NET instrumentation captures headers, status codes, and timing — not request or response bodies. Here's how to add body capture to your traces while keeping PHI out of your observability backend.
Prathamesh Sonpatki
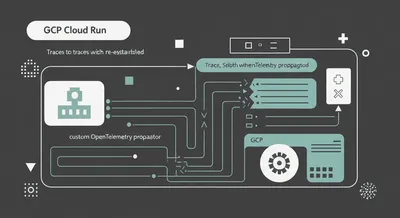
Fixing Broken Traces in GCP Cloud Run: A Custom OpenTelemetry Propagator
GCP's load balancer silently rewrites your traceparent header, orphaning spans in any OTLP backend. Here's the custom propagator that fixes it.
Prathamesh Sonpatki

Why Your PromQL Availability Query Returns Nothing When Services Are Healthy
Your SLI query shows 100% availability as No Data. Here's why PromQL returns empty results instead of zero — and the label-preserving fix.
Prathamesh Sonpatki

Instrumenting WordPress with OpenTelemetry: PHP Tracing, Browser RUM, and Error Capture in Production
WordPress powers 40% of the web but has no native observability story. Here's how to instrument it end-to-end with OpenTelemetry - PHP, browser RUM, and errors.
Prathamesh Sonpatki