

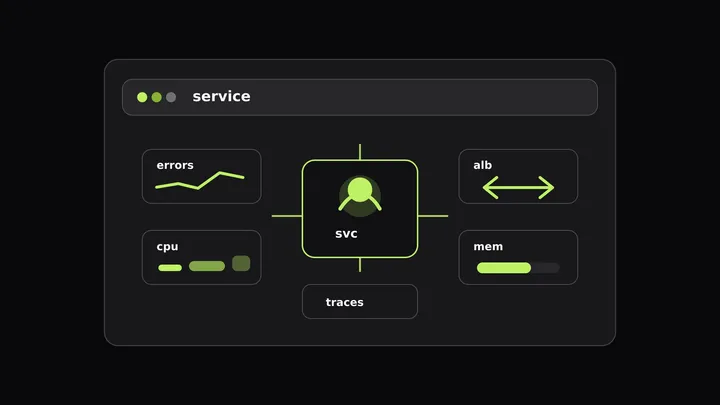
An error-rate alert says checkout-api is failing. The service graph shows latency rising, the error panel turns red, and the trace sample points at a request path. Then the investigation leaves the service page. Someone opens a Kubernetes view for pod CPU. Someone else checks CloudWatch for ALB target health. A third person lines up timestamps by hand.
That handoff is where root cause analysis in software gets slow. The first alert usually names the symptom. The service owner still has to answer whether the failure came from application code, a saturated pod, a host-level resource problem, or the load balancer edge.
A service overview cannot solve root cause analysis on its own. It can do something more useful during the first ten minutes: keep the application symptom, the related infrastructure metrics, and the edge signals close enough that responders form one testable hypothesis instead of five disconnected guesses.
Why root cause analysis in software stalls after the first alert
A production alert often starts with a service-level symptom: high 5xx rate, elevated latency, low availability, or a broken SLO burn rate. Those signals are correct, but they describe where users feel the problem, not always where the failure began.
For example, a service can emit 5xx responses because a deploy introduced a bug. It can also emit 5xx responses because the pods behind it are restarting, CPU throttling stretches a dependency call past a timeout, or the ALB has too few healthy targets. The application metric looks similar in each case.
The common failure is not a lack of telemetry. It is that the signals sit behind separate entry points:
- A service page for throughput, error rate, latency, APDEX, traces, logs, and dependencies.
- A Kubernetes or host view for CPU, memory, restarts, OOM kills, throttling, and network I/O.
- A CloudWatch or metrics dashboard for ALB 5xx, target 5xx, rejected connections, and target health.
The first incident question is usually simple: “What changed at the same time as the symptom?” If each layer lives in a separate tab, responders spend time proving that timestamps line up. A better service-page workflow makes the first correlation cheap, then sends people to traces and logs for proof.
If you want the broader signal-correlation model, our guide to correlating logs, traces, and metrics covers join keys, exemplars, and trace context. This post stays on the service-page workflow: what belongs near the service overview, and what should move to a dashboard beside it.
Start with the service overview, then add what it cannot show
The default incident view should begin with the small set of service health metrics that answer whether users are affected:
| Signal | Why it belongs first |
|---|---|
| Throughput | Shows whether traffic changed before the symptom. |
| Error rate | Confirms the failing service and time window. |
| Response time | Shows whether latency rose before errors. |
| Availability | Connects the incident to user-visible success. |
| APDEX | Compresses latency satisfaction into one service-level view. |
| Operations | Narrows the symptom to a route, handler, or dependency call. |
| Traces and logs | Provide the proof after a metric hypothesis survives. |
Those are service signals. They still need resource context. In Last9, Discover Services documents related infrastructure metrics for the selected service when the required attributes exist. For Kubernetes deployments, traces must carry k8s.pod.name; for bare VM or EC2 deployments, traces must carry host.name and the host metrics receiver must emit host metrics with the same attribute.
When that link exists, the service owner can inspect related CPU, memory, network, disk, restarts, OOM kills, and CPU throttling from the service context instead of starting in a separate infrastructure inventory.
Load balancer metrics need a different treatment. ALB metrics aren’t part of the service overview, so treat them as edge metrics that belong beside the service panels on an incident dashboard. The Last9 AWS Elastic Load Balancer integration enables the AWS/ApplicationELB namespace through CloudWatch metrics, and Creating Dashboards documents how to add service overview performance charts to a dashboard without writing a query.
That gives you a practical split:
- Start on the service overview for the service symptom and related infrastructure metrics.
- Promote the useful service panels to a custom dashboard.
- Add ALB panels to that dashboard when edge behavior can affect the service.
- Use traces and logs after the dashboard points at a likely branch.
Build the dashboard around service identity
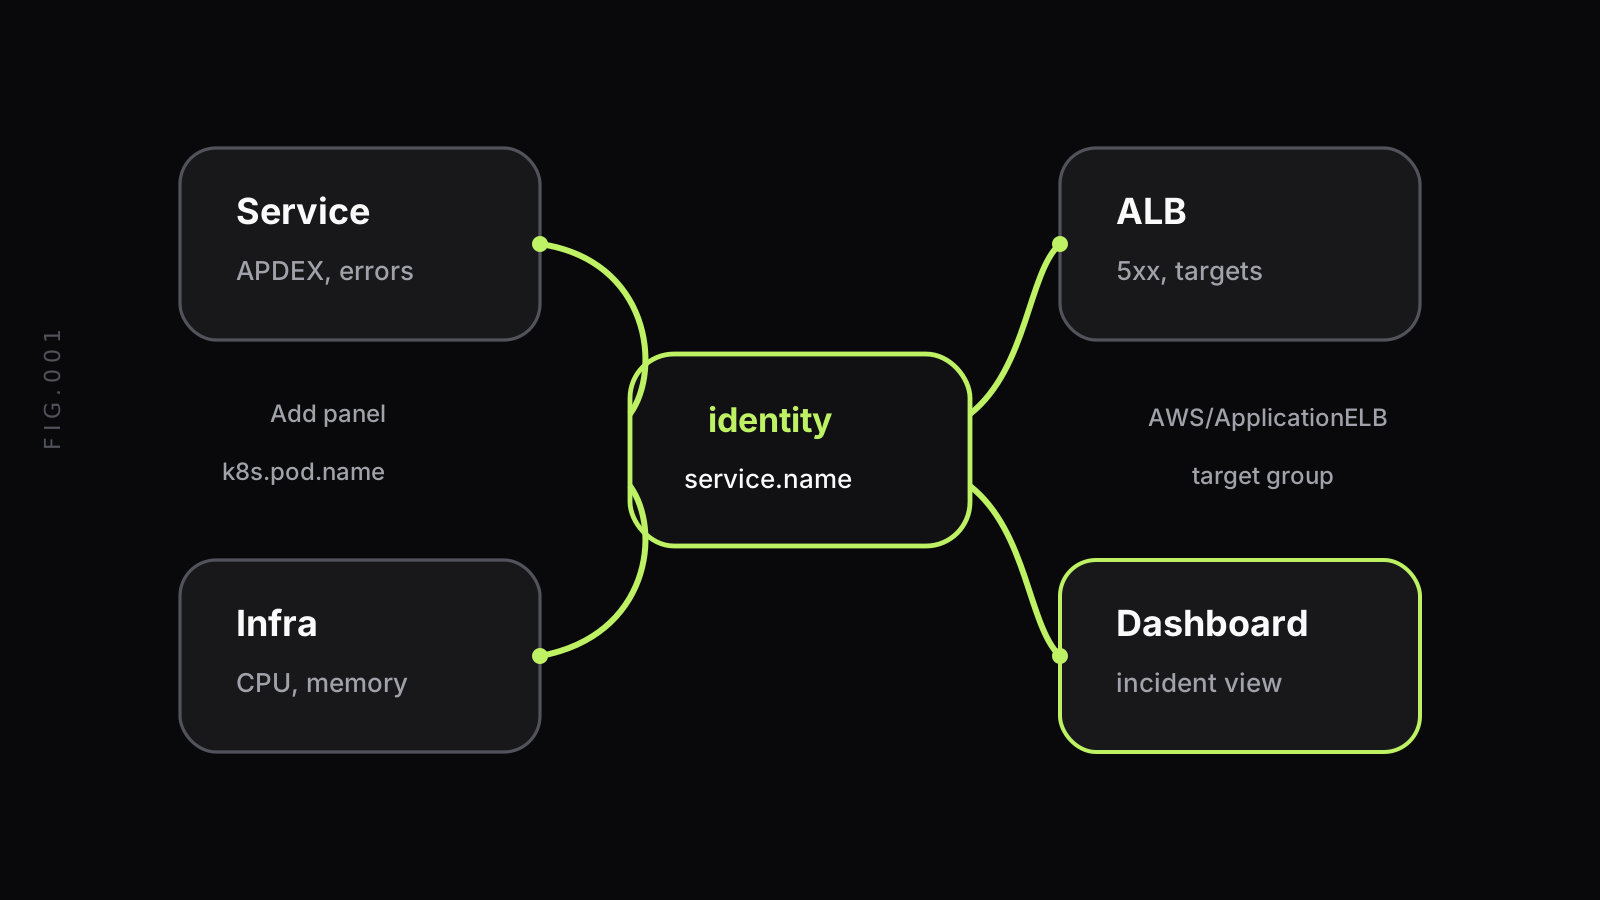
The join key matters more than the chart count. If the incident dashboard cannot answer “which service owns this metric?” it becomes another wall of graphs.
For application telemetry, the stable key is the OpenTelemetry service identity. The OpenTelemetry semantic conventions define service.name as the logical service name for a telemetry-producing service. That value should match how humans talk about the service in alerts, deploys, dashboards, and runbooks.
For Kubernetes resource context, service identity usually needs one more hop. The trace span carries the service name, and the resource attributes carry the pod identity. Last9’s Discover Services docs call out k8s.pod.name as the attribute used to load Kubernetes pod metrics for the selected service. If your traces do not carry that attribute, the related metrics panel has no reliable pod to look up.
For host-backed services, the same pattern uses host.name. The service span names the software unit. The host attribute ties it to CPU, memory, and network metrics from the machine.
ALB metrics add a harder mapping problem. CloudWatch ALB metrics are grouped by load balancer, target group, and availability zone dimensions. A target group may map cleanly to one service, but shared load balancers and shared target groups are common. Document that ambiguity in the dashboard rather than hiding it.
A useful dashboard description can be as plain as:
checkout-api incident view. Service panels come from Discover Services.Infrastructure panels require k8s.pod.name on traces. ALB panels use thecheckout target group; shared ingress errors may include other services.That note prevents a common false correlation: an ALB-level error spike that affects many services gets blamed on the service that happened to alert first.
Read the page as a hypothesis tree, not a wall of charts
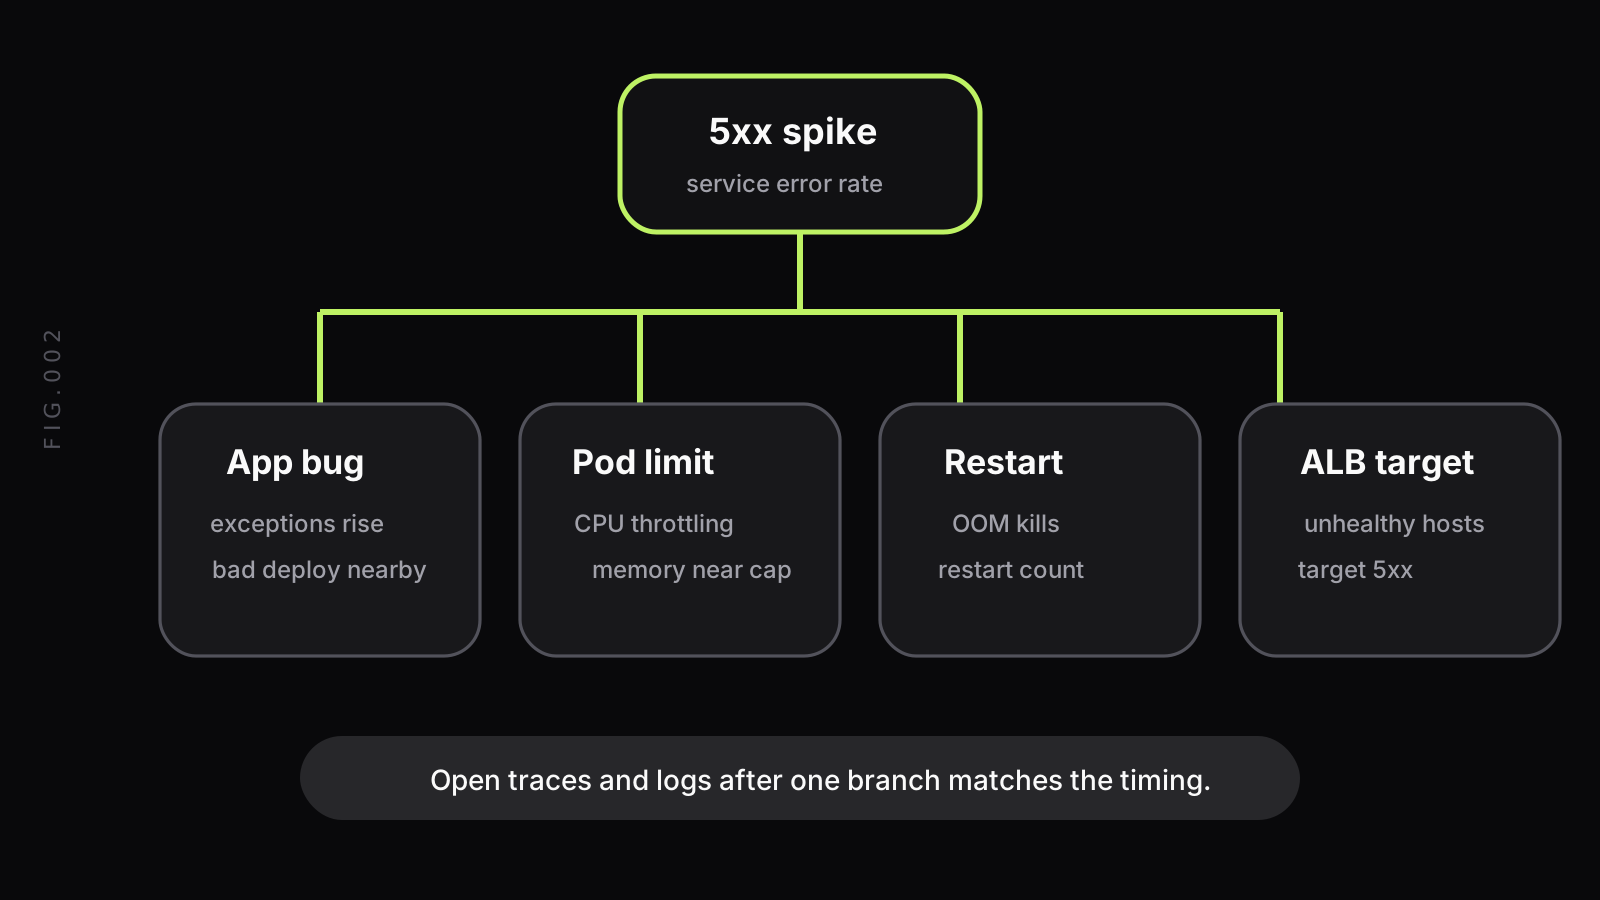
Root cause analysis in software works best when the first view helps you reject branches quickly. A dashboard with twenty panels is slower than a dashboard that encodes four likely questions:
- Did the application start throwing exceptions?
- Did pod or host resources hit a limit?
- Did workload health change through restarts, OOM kills, or unavailable replicas?
- Did the load balancer lose healthy targets or reject connections?
The workflow is not “find matching shapes.” It is “compare timing, then test the branch.”
When the 5xx spike begins before CPU throttling, throttling may be a consequence. Resource pressure becomes a stronger branch when throttling starts first and latency rises before 5xx. Target 5xx rising while ELB 5xx stays flat means the edge is forwarding requests to targets that fail. ELB 5xx rising without target 5xx points to the load balancer layer, listener rules, certificates, or connection handling.
Use ratios before raw counts when traffic changes. A flat count of errors can look better during a traffic drop, and a higher count can be normal during a traffic spike. Error rate, target error percentage, and per-target request rates usually make the branch clearer.
Kubernetes service monitoring examples that explain HTTP errors
Kubernetes failures often look like application failures from the outside. The service returns 500s or times out; users do not know whether the code, the pod, or the node caused it.
CPU throttling is a common example. A pod can be below its average CPU limit over a long window and still get throttled during bursts. When throttling starts before latency rises, the application may be healthy but unable to get CPU when it needs it. Put CPU usage, CPU requests, CPU limits, and throttling beside latency before you chase slow code paths.
Memory tells a different story. A service with rising memory can hit its limit, get OOM-killed, restart, and produce a burst of 5xx while the replacement pod becomes ready. If the service overview shows errors and the related metrics show OOM kills or restart count movement in the same window, the next step is not a trace query for business logic. It is a workload stability check.
Replica and readiness state matters too. A deployment can have enough desired replicas but too few ready pods. The ALB or Kubernetes Service keeps sending traffic to the healthy subset, per-target load rises, latency increases, and the application looks slow. In that branch, pod readiness, replica count, and per-target request rate explain the symptom together.
The Kubernetes resource metrics pipeline docs describe CPU and memory resource metrics as core signals for autoscaling and inspection. For incident review, the same metrics become service-owner context. The important part is not that every responder becomes a Kubernetes operator. It is that a service owner can see when Kubernetes state makes the service symptom plausible.
ALB metrics that belong beside service errors
ALB metrics are useful during incident root cause analysis because they split edge behavior from backend behavior. AWS documents separate CloudWatch metrics for load balancer errors, target errors, target response time, rejected connections, and healthy host counts. Put the ones that answer the incident question beside your service panels.
| ALB metric | What it helps answer |
|---|---|
HTTPCode_ELB_5XX_Count | Did the load balancer generate the 5xx? |
HTTPCode_Target_5XX_Count | Did registered targets return the 5xx? |
TargetResponseTime | Did backend response time rise before service latency? |
RejectedConnectionCount | Did the load balancer reject connections? |
TargetConnectionErrorCount | Did connection attempts to targets fail? |
HealthyHostCount and UnHealthyHostCount | Did target health change during the symptom? |
These metrics do not replace application telemetry. They tell you where to look next.
If HTTPCode_Target_5XX_Count moves with the service error rate, the backend is returning failures. Open traces and logs for the failing operations. If HTTPCode_ELB_5XX_Count moves while target 5xx stays flat, inspect listener rules, certificates, connection limits, and ALB-side errors. If healthy host count drops before the service alert, the target group may be under capacity even though the application error appears later.
Rejected connections and target connection errors are especially useful for dropped-request investigations. They point away from application code and toward connection pressure, target registration, network paths, or health-check behavior. Keep them near the service panels when the symptom includes failed requests with weak application evidence.
For a deeper list of ELB metrics and collection patterns, use our ELB metrics guide. The service-page workflow here is narrower: take the ALB metrics that explain the current service symptom and put them next to the promoted service overview panels.
How Last9 supports the workflow today
In Last9, the documented path starts in Discover Services. The service overview shows throughput, error rate, availability, response time, APDEX, operations, traces, dependencies, logs, and related metrics for the selected service.
Related infrastructure metrics are documented for Kubernetes and host-backed services when the right resource attributes are present. Kubernetes correlation uses k8s.pod.name on traces and Kubernetes metrics from cAdvisor and kube-state-metrics. Host correlation uses host.name on traces and host metrics emitted with the same host name.
Service overview performance charts can be added to a custom dashboard from the panel menu. The dashboard docs state that Last9 extracts the underlying PromQL automatically, and you can edit the query after the panel is added.
For ALB metrics, use the AWS Elastic Load Balancer integration. The integration enables the AWS/ApplicationELB namespace through CloudWatch metrics. Add those ALB panels to the incident dashboard beside the promoted service panels.
Last9 puts the right signals near each other; the responder still forms and tests the hypothesis.
Implementation checklist for a usable incident view
Use this checklist before the next incident, not during it.
- Define the owning service key. Pick the
service.namevalue that alerts, dashboards, traces, and runbooks use. Avoid aliases such ascheckout,checkout-api, andcheckout-v2unless they mean different services. - Verify resource attributes. For Kubernetes services, confirm traces carry
k8s.pod.name. For host-backed services, confirm traces carryhost.nameand host metrics use the same value. - Promote the core service panels. Add APDEX, availability, throughput and error rate, response time, and error distribution from the service overview to a dashboard.
- Add the smallest useful infrastructure set. CPU, memory, restarts, OOM kills, CPU throttling, network, and replica or readiness state cover most service-owner incident questions.
- Add ALB panels only where the mapping is known. Put the target group or load balancer mapping in the panel description. Call out shared target groups.
- Prefer rates and percentages. Pair counts with request volume so traffic shifts do not produce false confidence.
- Keep traces and logs one click away. Metrics choose the branch. Traces and logs prove it.
- Link the runbook and alert rule. A responder should know which alert opened the view and which runbook explains the expected mitigation.
A good incident dashboard is not a full observability portal. It is a short path from “this service is failing” to “the next query is obvious.”
FAQ
What metrics should be on a service overview page for root cause analysis in software?
A service overview should start with service health metrics: request rate, error rate, latency, availability, and APDEX. For incidents, add related infrastructure metrics such as CPU, memory, network, restarts, OOM kills, and CPU throttling when the service runs on Kubernetes or hosts. Put ALB metrics on a dashboard beside promoted service panels when edge behavior may explain the symptom.
How do ALB metrics help incident root cause analysis?
ALB metrics separate edge failures from backend failures. ELB 5xx counts, target 5xx counts, unhealthy host counts, rejected connections, and target response time show whether errors started at the load balancer, the target group, or the application behind it. They do not prove the cause alone, but they narrow the next trace or log query.
Which Kubernetes service monitoring metrics should service owners see during an incident?
Service owners should see pod or deployment CPU, memory, restarts, OOM kills, CPU throttling, replica health, and network I/O beside request errors and latency. These metrics explain common failure modes such as throttled CPU, memory limits, crash loops, and pods that are not ready for traffic.
Should a service overview replace dashboards?
No. The service overview is the starting point for incident review. A dashboard is still useful when you need to place service panels beside ALB metrics, custom SLOs, change events, or runbook-specific queries. Keep the overview small, then use dashboards for the incident view that spans tools and layers.


