

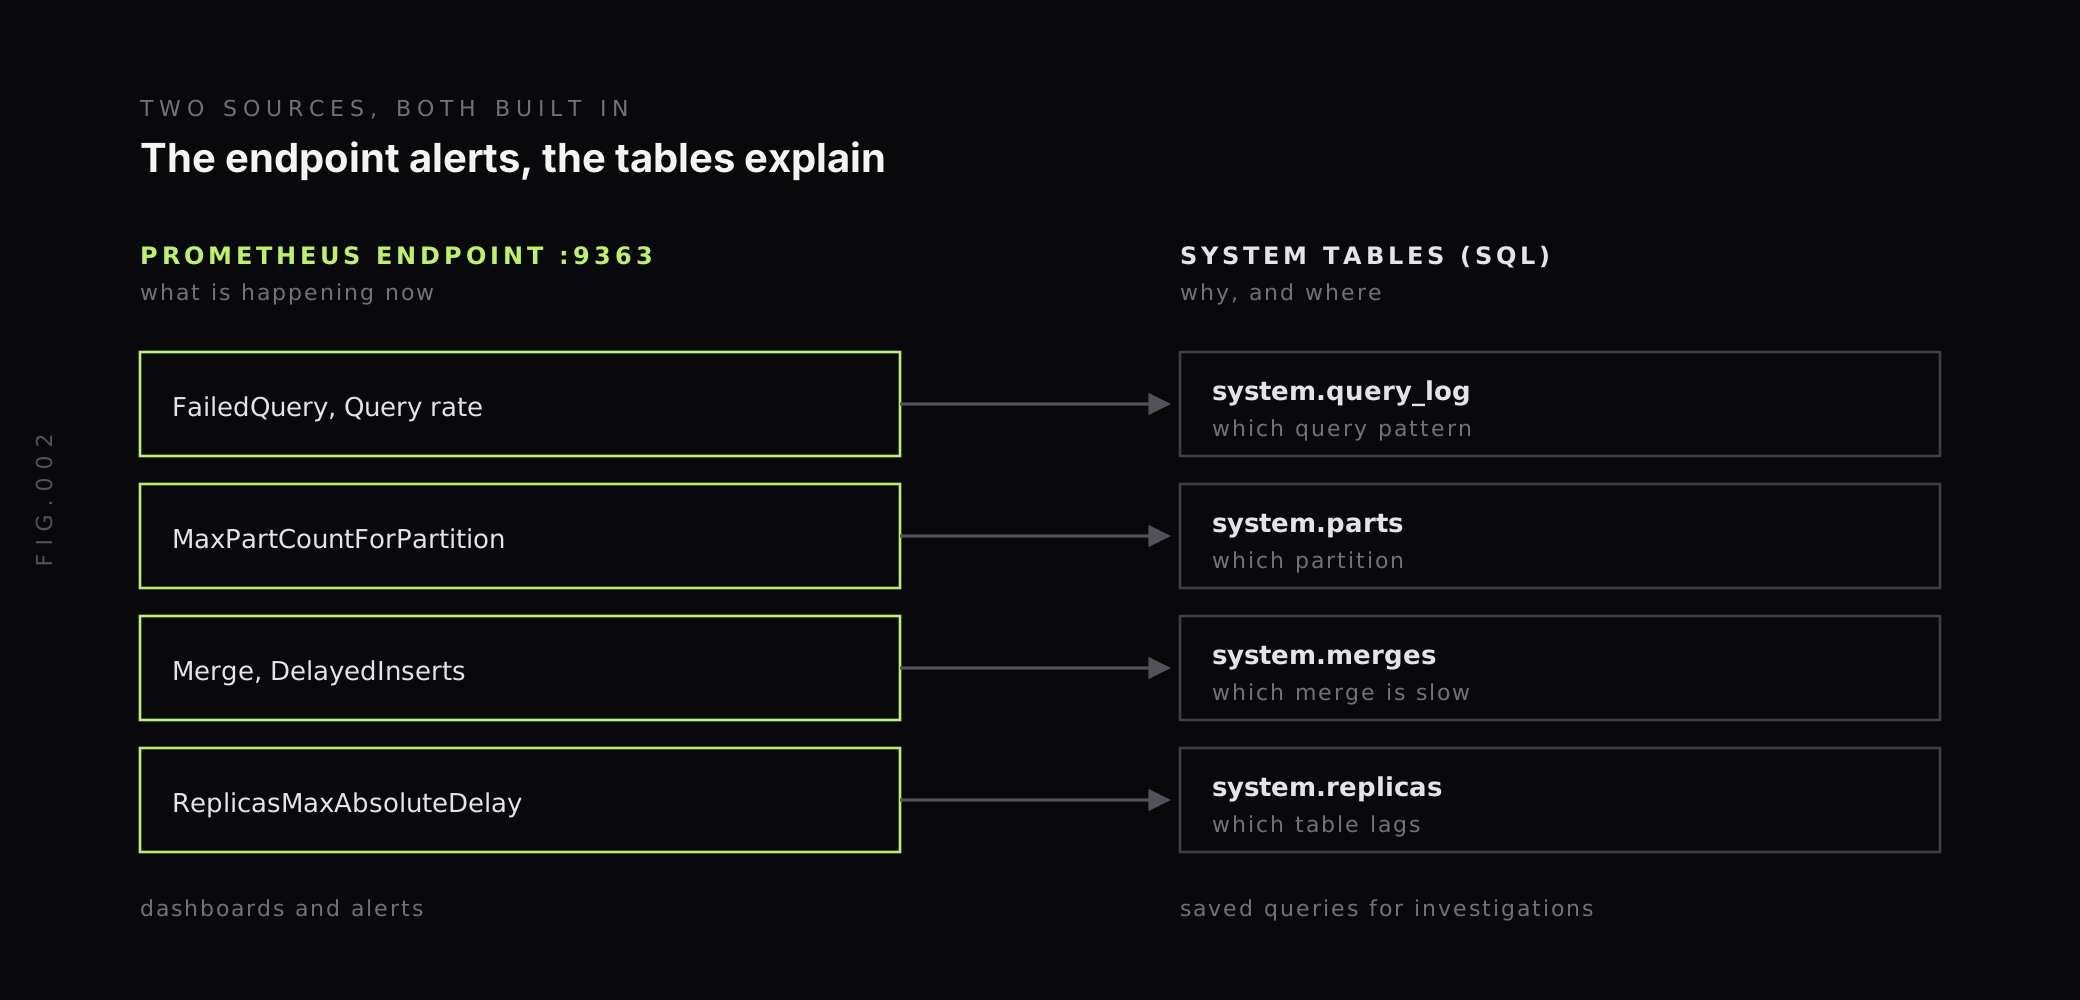
ClickHouse monitoring comes down to two sources that ship with the server. A Prometheus endpoint, usually on port 9363, gives you counters and gauges for dashboards and alerts. System tables such as system.query_log, system.parts, system.merges and system.replicas hold the detail that explains a problem, and you read them with SQL.
The metric to watch most closely is the number of active parts per partition, because ClickHouse throttles and then rejects inserts when it climbs too high.
This guide covers how to turn on the Prometheus endpoint, which metrics matter, the system table queries to save, how the Too many parts limits work, how to watch replication, and which alerts to set first. Setting names and defaults come from the ClickHouse source code and the ClickHouse monitoring documentation.
What should you monitor in ClickHouse?
ClickHouse has a few failure modes that general database monitoring misses. Watch five areas:
- Queries: rate, failures, duration and memory per query pattern.
- Inserts and parts: how many parts each partition holds, and whether inserts are being delayed or rejected.
- Merges: whether background merges keep up with incoming parts.
- Replication: how far each replica lags behind, and whether any table has gone read-only.
- Resources: memory tracked by the server, disk space and connections.
The second and third areas are specific to ClickHouse’s MergeTree storage. Every INSERT writes a new part on disk, and merges combine parts in the background. A cluster can look healthy on CPU and memory while parts pile up, until inserts start failing. Our guide to database monitoring covers the general signals that apply to every database.
How do you expose ClickHouse metrics to Prometheus?
ClickHouse has a built-in Prometheus endpoint, so you don’t need a separate exporter. The prometheus section ships commented out in the default config.xml. The example in that file looks like this:
<clickhouse> <prometheus> <endpoint>/metrics</endpoint> <port>9363</port> <metrics>true</metrics> <events>true</events> <asynchronous_metrics>true</asynchronous_metrics> </prometheus></clickhouse>Put it in a file under config.d/, restart the server, and point Prometheus at port 9363:
scrape_configs: - job_name: clickhouse static_configs: - targets: ["clickhouse-1:9363", "clickhouse-2:9363", "clickhouse-3:9363"]The three flags map to three families of metrics. The prefixes and types below come from ClickHouse’s Prometheus writer in the server source:
| Setting | Prometheus prefix | Type | Source table | Example |
|---|---|---|---|---|
metrics | ClickHouseMetrics_ | Gauge | system.metrics | ClickHouseMetrics_Query, running queries now |
events | ClickHouseProfileEvents_ | Counter | system.events | ClickHouseProfileEvents_FailedQuery, failed queries since start |
asynchronous_metrics | ClickHouseAsyncMetrics_ | Gauge | system.asynchronous_metrics | ClickHouseAsyncMetrics_MaxPartCountForPartition |
The ProfileEvents metrics are cumulative counters with no _total suffix. Wrap them in rate() or increase() before charting them, or every line climbs forever:
rate(ClickHouseProfileEvents_FailedQuery[5m]) / rate(ClickHouseProfileEvents_Query[5m])That gives the share of queries failing over the last five minutes on each server.
Which ClickHouse metrics matter most?
ClickHouse exposes hundreds of metrics. These are the ones behind most incidents, with the descriptions from the ClickHouse source:
| Metric | What it measures | Why it matters |
|---|---|---|
ClickHouseMetrics_Query | Number of executing queries | Concurrency, and queueing when it hits limits |
ClickHouseProfileEvents_Query | Queries interpreted and potentially executed | Query rate (with rate()) |
ClickHouseProfileEvents_FailedQuery | Total failed queries, both internal and user | Error rate |
ClickHouseProfileEvents_InsertedRows | Rows inserted into all tables | Ingest rate |
ClickHouseProfileEvents_DelayedInserts | Times an insert was throttled because of too many active parts | Early warning before rejections |
ClickHouseProfileEvents_RejectedInserts | Times an insert was rejected with Too many parts | Data not written |
ClickHouseMetrics_Merge | Number of executing background merges | Whether merges are running at all |
ClickHouseAsyncMetrics_MaxPartCountForPartition | Maximum parts per partition across MergeTree tables | Distance to the insert limits |
ClickHouseAsyncMetrics_ReplicasMaxAbsoluteDelay | Largest replication delay in seconds | Stale reads from lagging replicas |
ClickHouseMetrics_ReadonlyReplica | Replicated tables in read-only state | Lost ZooKeeper or Keeper session |
ClickHouseMetrics_MemoryTracking | Total memory tracked by the server, in bytes | Memory pressure before queries fail |
ClickHouse’s own description of MaxPartCountForPartition gives a threshold: “Values larger than 300 indicates misconfiguration, overload, or massive data loading.” That makes it the single most useful alert metric for MergeTree tables.
What does the Too many parts error mean?
When inserts create parts faster than merges combine them, the active part count in a partition grows, and ClickHouse protects itself in two stages. With current defaults from the MergeTree settings:
parts_to_delay_insert= 1000. From this many active parts in one partition, each insert is artificially slowed down.parts_to_throw_insert= 3000. From this count, the insert fails with aTOO_MANY_PARTSerror: “Too many parts (N with average size of X) in table ’…’. Merges are processing significantly slower than inserts.”max_parts_in_total= 100000. Across all partitions of one table, inserts past this total fail with aTOO_MANY_PARTSerror that points to a wrong partition key.
These delay and throw checks apply only while the partition’s average part size is under max_avg_part_size_for_too_many_parts, 1 GiB by default. Releases before 23.6 used much lower limits (150 and 300), so check system.merge_tree_settings on your own version rather than assuming these numbers.
Between the two limits, the delay grows in a straight line. Since ClickHouse 23.1 the documented formula is max(min_delay_to_insert_ms, max_delay_to_insert * 1000 * parts_over_threshold / allowed_parts_over_threshold), with min_delay_to_insert_ms at 10 ms and max_delay_to_insert at 1 second by default. Releases before 23.1 used an exponential curve instead. With current defaults it works out like this:
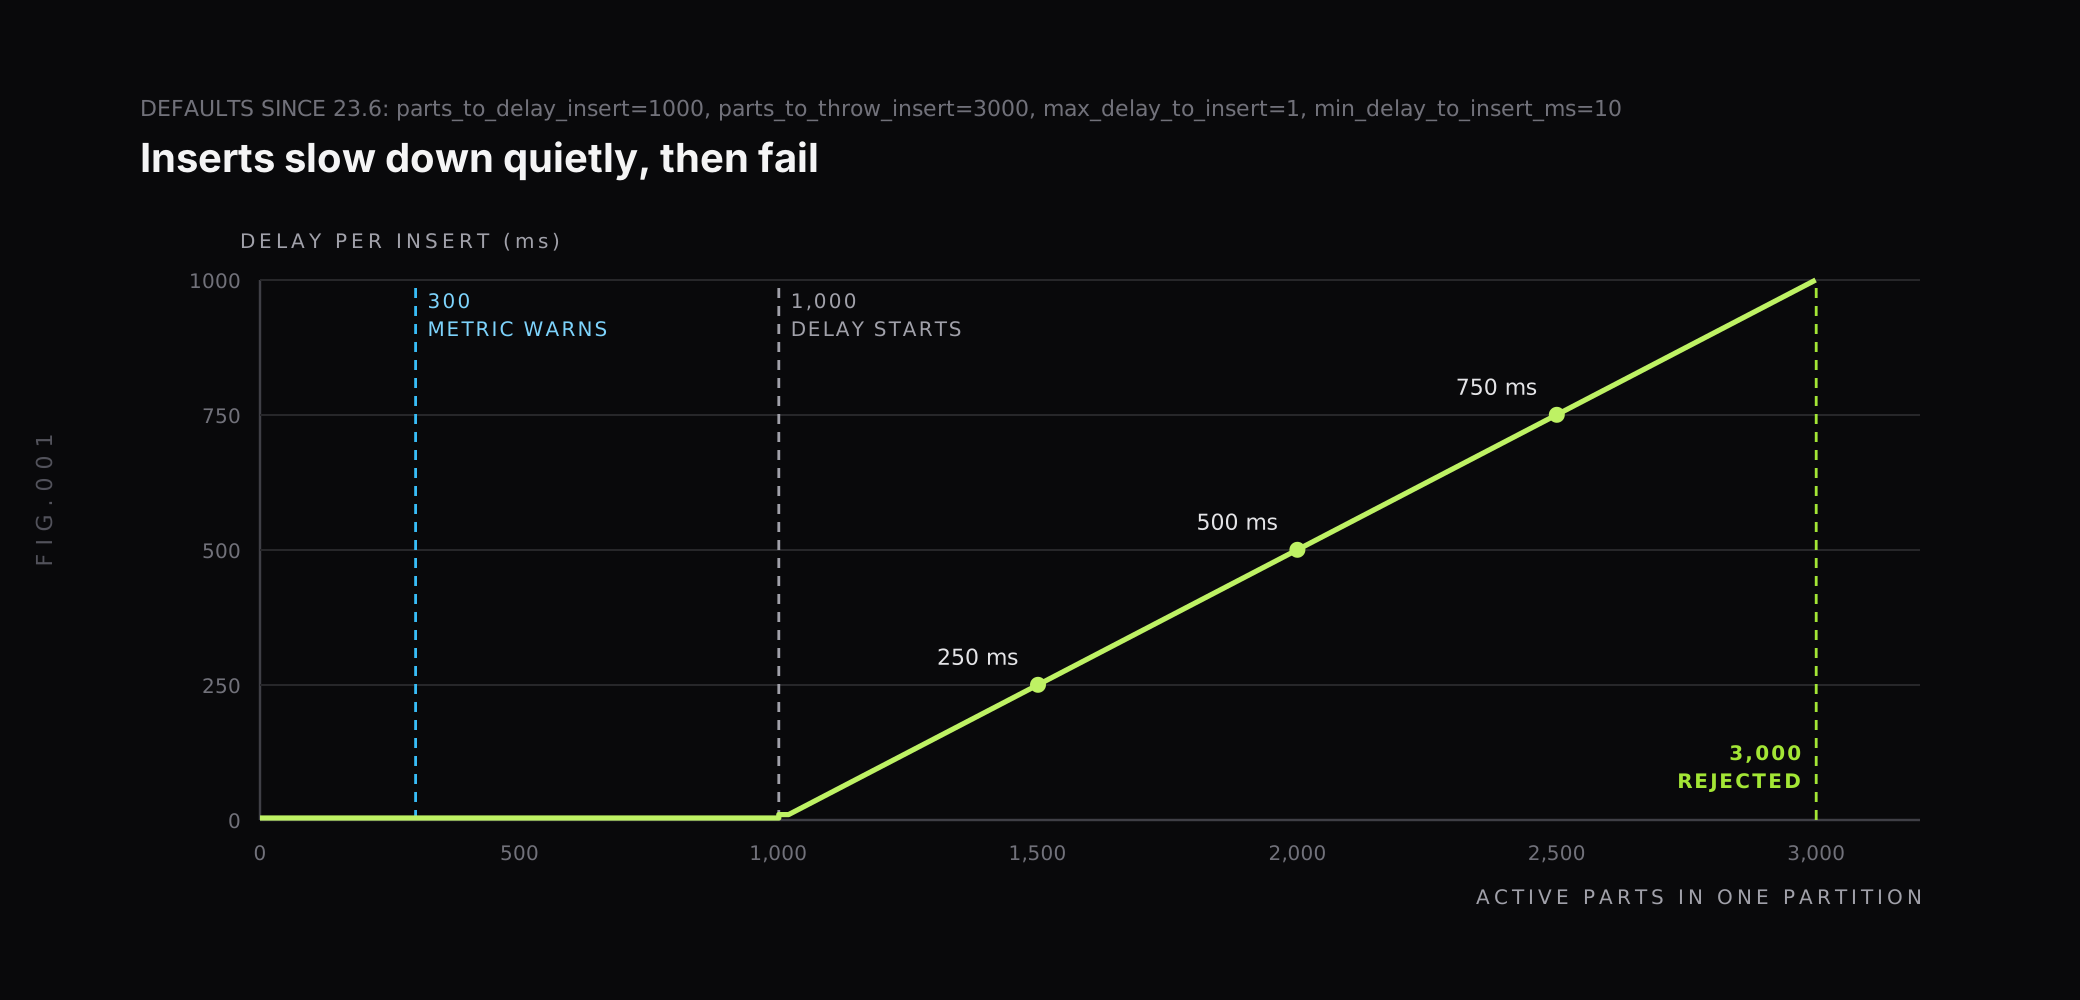
Each insert waits about 10 ms just past 1,000 parts, about 250 ms at 1,500, 500 ms at 2,000 and close to a full second near 3,000. A client sending a few large batches a minute barely notices half a second per insert, so the slowdown often goes unnoticed until rejections start.
Alert on DelayedInserts and MaxPartCountForPartition instead of waiting for complaints. By the time users notice slow inserts, the partition is well past the delay threshold.
The usual causes:
- Too many small inserts. Each insert is a part. Thousands of single-row inserts per second create parts faster than merges can absorb. Batch on the client, or use asynchronous inserts (
async_insert), which buffer small inserts on the server and flush them as larger parts. - A partition key that is too fine. Partitioning by hour or by a high-cardinality column spreads parts across many partitions and keeps each one from merging down.
- Merges that can’t keep up. Slow disks, too few background threads, or a few very large merges blocking smaller ones.
Which system tables should you query?
Metrics tell you that something is wrong. System tables tell you which query, table or partition is responsible. Save these queries before you need them.
Slowest query patterns in the last hour. normalized_query_hash is identical for queries that differ only in literal values, so each pattern becomes one row:
SELECT normalized_query_hash, any(query) AS example, count() AS runs, round(avg(query_duration_ms)) AS avg_ms, max(query_duration_ms) AS max_ms, formatReadableSize(max(memory_usage)) AS peak_memory, sum(read_rows) AS rows_readFROM system.query_logWHERE type = 'QueryFinish' AND event_time > now() - INTERVAL 1 HOURGROUP BY normalized_query_hashORDER BY avg_ms * runs DESCLIMIT 10Sorting by average duration times runs surfaces the patterns that cost the most in total, which is often a fast query run millions of times rather than one slow report.
Failed queries. The type column distinguishes ExceptionBeforeStart (failed before running, such as a syntax or permission error) from ExceptionWhileProcessing (failed while running, such as a memory limit):
SELECT type, exception, count() AS failuresFROM system.query_logWHERE type IN ('ExceptionBeforeStart', 'ExceptionWhileProcessing') AND event_time > now() - INTERVAL 1 HOURGROUP BY type, exceptionORDER BY failures DESCLIMIT 10Partitions closest to Too many parts:
SELECT database, table, partition, count() AS active_partsFROM system.partsWHERE activeGROUP BY database, table, partitionORDER BY active_parts DESCLIMIT 10Merges running now:
SELECT database, table, round(elapsed) AS seconds, round(progress * 100) AS pct, num_partsFROM system.mergesORDER BY elapsed DESCsystem.query_log is itself a table that grows with every query. The default config.xml ships its TTL example commented out, so set one in the query_log section, such as <ttl>event_date + INTERVAL 30 DAY DELETE</ttl>, to keep it from filling the disk on a busy cluster.
Altinity, our ClickHouse partner, keeps a ClickHouse monitoring knowledge base with more operational guidance.
How do you monitor ClickHouse replication?
Replicated tables can fall behind when ZooKeeper or ClickHouse Keeper is slow, when a replica restarts, or when a large merge or fetch takes a long time. Three signals cover it:
ReplicasMaxAbsoluteDelay, described in the source as the “maximum difference in seconds between the most fresh replicated part and the most fresh data part still to be replicated, across Replicated tables.” A high value means a replica is serving old data.ReadonlyReplica, the count of replicated tables that are read-only, usually after losing the Keeper or ZooKeeper session. Writes to those tables fail.system.replicas, which shows the delay, queue size and read-only state per table when you need to find the one that is behind.
ClickHouse also serves an HTTP health endpoint for this. GET /replicas_status returns Ok. when replicas are healthy and HTTP 503 when a replica’s delay relative to its peers reaches min_relative_delay_to_close, 300 seconds by default. That makes it a good load balancer health check: a lagging replica drops out of rotation on its own.
Distributed queries already skip replicas lagging by max_replica_delay_for_distributed_queries, also 300 seconds by default. GET /ping returns Ok. while the server process is up, and is the simpler liveness check.
Which alerts should you set for ClickHouse?
Start with alerts that catch lost data and failed queries, then add capacity alerts. These thresholds are starting points to tune for your workload:
| Alert | Expression (PromQL) | Why |
|---|---|---|
| Parts piling up | ClickHouseAsyncMetrics_MaxPartCountForPartition > 300 for 15 minutes | ClickHouse’s own warning level, well before delays start |
| Inserts delayed | increase(ClickHouseProfileEvents_DelayedInserts[5m]) > 0 | The partition is past parts_to_delay_insert |
| Inserts rejected | increase(ClickHouseProfileEvents_RejectedInserts[5m]) > 0 | Data is not being written |
| Query failures | Failed queries over total queries above 1% for 10 minutes | User-facing errors |
| Replica lag | ClickHouseAsyncMetrics_ReplicasMaxAbsoluteDelay > 300 for 10 minutes | Reads return stale data |
| Read-only tables | ClickHouseMetrics_ReadonlyReplica > 0 for 5 minutes | Writes to replicated tables fail |
| Server down | up{job="clickhouse"} == 0 for 2 minutes | No metrics, no queries |
Add a disk space alert from your host metrics as well. Merges need free space to write the merged part before removing the old ones, so a nearly full disk stops merges, and parts start piling up behind it.
Our guide to Prometheus Alertmanager covers how to route and group these.
How does Last9 fit with ClickHouse monitoring?
ClickHouse’s Prometheus endpoint works with any Prometheus-compatible backend. Scrape port 9363 with Prometheus or an OpenTelemetry Collector and send the metrics to Last9 with Prometheus remote write; our Prometheus integration needs only a remote_write block with your Last9 endpoint and credentials. The PromQL and alert rules above work unchanged on Last9.
We also run ClickHouse ourselves, at large scale, as part of our own platform. Our post on ClickHouse and high cardinality at scale covers what broke and the mitigations we use, and our partnership with Altinity, covered in Better Together: Last9 + Altinity, brings ClickHouse operations into Last9 deployments that run in your own cloud account.
ClickHouse metrics carry labels per server, table and disk, and a large cluster produces many series. Last9 supports 20M series per metric per day by default, with higher limits available on request, and applies no sampling. Our Control Plane lets you drop metrics and run streaming aggregations at ingest, and redact sensitive data in logs.
Watch the parts before the inserts fail
ClickHouse rarely fails without warning. Parts pile up for hours before inserts are rejected, replicas lag for minutes before reads go stale, and slow query patterns show up in system.query_log long before users complain. The work is in watching the right numbers: the part count per partition, delayed inserts, replica delay and failed queries.
Turn on the Prometheus endpoint, alert on MaxPartCountForPartition above 300 and on any delayed or rejected insert, and save the four system table queries above for the next investigation. When you want ClickHouse metrics next to the services that query it, Last9 takes Prometheus remote write and queries it with PromQL.
FAQ
How do you monitor ClickHouse?
ClickHouse exposes its own metrics in two ways. A built-in Prometheus endpoint, usually on port 9363 at /metrics, serves current metrics, cumulative event counters and asynchronous metrics for dashboards and alerts. System tables such as system.query_log, system.parts, system.merges and system.replicas hold the detail needed to explain a problem, and you query them with SQL. Most teams scrape the endpoint with Prometheus and keep a set of saved system table queries for investigations.
What port does the ClickHouse Prometheus endpoint use?
The example configuration that ships with ClickHouse sets the Prometheus endpoint to /metrics on port 9363, with metrics, events and asynchronous_metrics all set to true. The prometheus section is commented out in the default config.xml, so you have to enable it in a config file before Prometheus can scrape the server.
What causes the Too many parts error in ClickHouse?
ClickHouse writes every INSERT as a new data part and merges parts in the background. When inserts create parts faster than merges combine them, the active part count in a partition grows. With current defaults, ClickHouse starts slowing inserts down at 1,000 active parts in one partition (parts_to_delay_insert) and rejects them with a Too many parts exception at 3,000 (parts_to_throw_insert).
Which ClickHouse metric shows the risk of Too many parts?
The asynchronous metric MaxPartCountForPartition reports the maximum number of parts per partition across all MergeTree tables. ClickHouse’s own description says values larger than 300 indicate misconfiguration, overload or massive data loading. The ProfileEvents counters DelayedInserts and RejectedInserts show when inserts have already been throttled or rejected for the same reason.
How do you find slow queries in ClickHouse?
Query system.query_log for rows with type QueryFinish and sort by query_duration_ms. Grouping by normalized_query_hash combines queries that differ only in literal values, so one slow query pattern shows up as one row with its count, average duration, rows read and peak memory. Rows with type ExceptionWhileProcessing or ExceptionBeforeStart show failed queries and their exception messages.
How do you monitor ClickHouse replication lag?
The asynchronous metric ReplicasMaxAbsoluteDelay reports the largest replication delay in seconds across replicated tables, and system.replicas shows the delay and queue size for each table. The HTTP endpoint /replicas_status returns Ok when replicas are healthy and HTTP 503 when a replica falls behind its peers by the min_relative_delay_to_close setting, 300 seconds by default, which makes it usable as a load balancer health check.


