

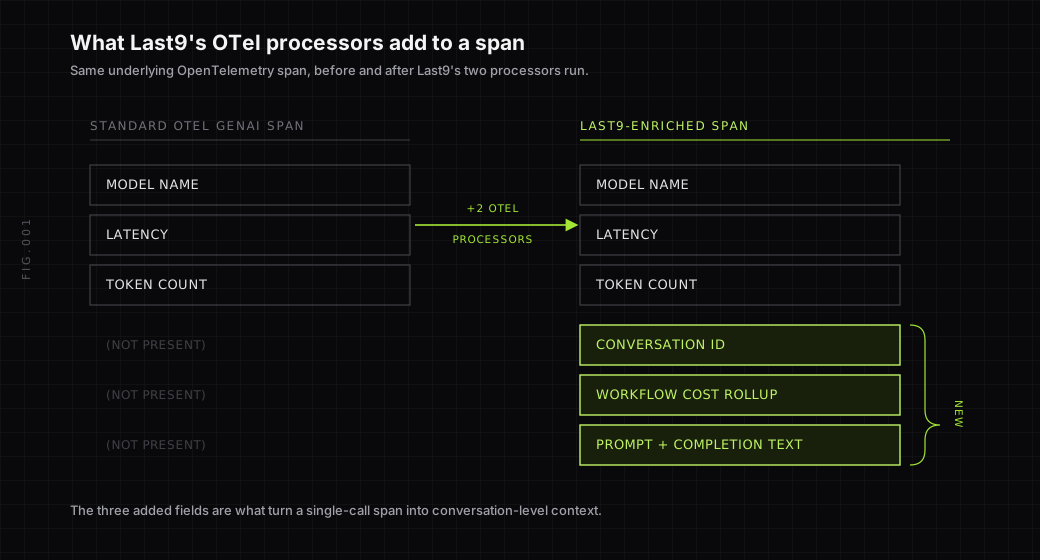
Teams shipping LLM features or AI agents run into the same wall: their existing observability stack tells them a request was slow, but not which conversation it belonged to, what it cost, or whether the model said something wrong. OpenTelemetry’s GenAI semantic conventions solve part of this, with a vendor-neutral standard for model-call spans that carry token counts. What that standard does not give you is conversations, workflow cost rollups, or prompts visible in your dashboard. That gap between infrastructure-level spans and application-level understanding of what an LLM did is what the current generation of AI observability tools is built to close.
This is a comparison of eight tools built specifically for that gap: what each one tracks, how it’s priced, whether it can be self-hosted, and who it fits. It is scoped deliberately to LLM and AI-agent observability — tracing, evals, conversation-level monitoring, and cost tracking for AI applications — not to general infrastructure tools that use AI/ML internally for anomaly detection, which is a different category with a different buyer.
What is AI observability?
AI observability is the practice of monitoring what an AI system did: which prompt a model received, what it returned, whether that output was correct, how many tokens it consumed, and what the call cost. It differs from infrastructure observability in its unit of analysis. Infrastructure observability measures a single request; AI observability measures a conversation, an agent workflow, or an evaluation run. OpenTelemetry’s GenAI semantic conventions cover the span and token layer of this, while conversation threading, prompt visibility, and evaluation sit above it.
What should you look for in an AI observability tool?
Five things separate a tool that’s genuinely useful in production from one that looks good in a demo.
Conversation and session context, not just individual spans. A single LLM call is rarely the useful unit of debugging; a multi-turn conversation or a multi-agent workflow is. Tools differ sharply on whether they thread turns, agent handoffs, and workflow state together automatically or leave that to manual instrumentation.
Cost tracking that rolls up past the individual call. Token counts per call are table stakes at this point. What’s harder, and what matters for a budget conversation, is aggregating cost by workflow, by user, or by feature, so a spike is traceable to a cause rather than just a bigger number.
Evaluation, not just observation. Watching what a model did after the fact is necessary but not sufficient. The stronger tools in this category also support running evals (LLM-as-judge scoring, hallucination detection, regression testing against a golden dataset) so teams catch quality regressions before users do.
OpenTelemetry-native versus proprietary instrumentation. A tool built as an OTel extension keeps you portable; you can swap backends without re-instrumenting. A tool built on a proprietary SDK usually means richer product-specific features at the cost of lock-in.
Self-hosting and data residency. Prompts and completions often contain the exact sensitive data a company least wants leaving its own infrastructure. Whether a tool can run fully self-hosted, and under what license, is a real constraint for regulated teams, not a nice-to-have.
For a deeper walkthrough of what LLM observability means conceptually and how to instrument it with OpenTelemetry from scratch, see Last9’s LLM observability guide.
What are the best AI observability tools in 2026?
1. Last9 (LLM/agent observability via OpenTelemetry)
Last9 approaches this as an OpenTelemetry extension rather than a separate proprietary platform. Its GenAI observability SDK adds two custom OTel processors on top of standard instrumentation: one that attaches conversation ID, workflow type, agent name, and cost as context across a multi-turn session, and one that bridges prompt and completion content from logs onto spans so they’re visible in a dashboard rather than buried in a separate log stream. It auto-instruments the OpenAI SDK and LangChain/LangGraph. Installation is non-invasive: it wires into your existing OTel provider and exporter, so you keep whatever backend you already use, Last9 or otherwise. Last9 itself runs either as SaaS or as a Glassbox/BYOC deployment inside your own cloud account, so prompt and completion content can stay within your own infrastructure boundary.
Best for: teams already standardized on OpenTelemetry who want conversation-level context and cost rollups without adopting a second, separate observability backend just for AI features.
2. Langfuse
Langfuse is an open-source LLM engineering platform covering tracing, prompt management with version tracking, LLM-as-judge evaluations, and production cost/latency monitoring. The core is MIT-licensed and self-hostable via Docker Compose, a Kubernetes Helm chart, or Terraform, with a managed cloud option that’s SOC 2 Type II, ISO 27001, and GDPR compliant. The free tier covers 50,000 units per month across two users with 30-day data access and no credit card required.
Best for: teams that specifically want open source with unlimited users at low cost, or that run high trace volumes (100k+ monthly) where per-seat SaaS pricing gets expensive fast.
3. LangSmith
LangSmith is LangChain’s own observability and evaluation platform: tracing, evals, a Prompt Hub, annotation queues, and monitoring in one product, with first-party integration into LangChain and LangGraph that doesn’t require assembling separate tools. The free Developer tier includes 5,000 base traces per month on a single seat; self-hosting is available only on the Enterprise plan with custom annual pricing.
Best for: teams already building on LangChain or LangGraph who want tracing and evals that just work with their existing chains, without stitching together a separate OTel pipeline.
4. Helicone
Helicone works as an AI gateway that sits in front of 100+ models, giving teams observability by swapping a base URL rather than adding SDK instrumentation, plus an async logging path via OpenLLMetry for teams that don’t want a gateway in the request path. It’s Apache 2.0 licensed and self-hostable as a five-service Docker Compose stack. The free tier covers 10,000 requests per month, 1 GB of storage, one seat, and 7-day retention.
Best for: teams that want the lowest-effort setup, a base-URL swap instead of code changes, or that specifically need multi-model gateway routing alongside observability.
5. Arize Phoenix
Phoenix is Arize’s OpenTelemetry-native, source-available tracing and evaluation tool: LLM-as-judge evals, a prompt playground, and versioned datasets, deployable as a single pip install, a Docker container, or a Helm chart. It’s licensed under Elastic License 2.0 and is free to self-host with no event caps, since it’s distributed as an application rather than metered as a SaaS product.
Best for: teams that want the lightest possible deployment footprint and full OpenTelemetry portability without a vendor relationship at all.
6. Datadog LLM Observability
Datadog’s LLM Observability product surfaces LLM spans inside its existing APM infrastructure, so teams already paying for Datadog APM get AI observability as an extension of the same dashboards and on-call workflows rather than a separate tool. Pricing isn’t published per-unit; it’s sold through Datadog’s existing contract and sales process.
Best for: organizations already standardized on Datadog APM who want a single pane of glass rather than a second specialized tool, and who are comfortable with Datadog’s per-host/per-GB pricing model extending to AI workloads too.
7. Braintrust
Braintrust is built eval-first: tracing exists to feed evaluation rather than the other way around, with scoring, a prompt playground, and dataset management as the core workflow. The free tier includes $10 of usage credits, 1 GB of processed data, 10,000 scores, and 14-day retention, with unlimited users. Self-hosting is available only on enterprise/hybrid deployment with custom pricing.
Best for: teams where the bottleneck is evaluating whether a prompt or model change actually improved output quality, not diagnosing individual slow requests.
8. W&B Weave
Weave extends Weights & Biases’ existing ML platform into LLM tracing, evaluation, and production monitoring, including LLM-as-judge scoring. The free tier includes 1 GB per month of ingestion covering trace metadata and LLM inputs/outputs. It’s closed source with no self-hosting option.
Best for: teams already running experiment tracking and model training on Weights & Biases who want LLM observability in the same ecosystem rather than a separate platform.
How do these tools compare on pricing and deployment?
| Tool | Free tier | Self-hosting | Best for |
|---|---|---|---|
| Last9 | Usage-based, free tier available | Yes, Glassbox/BYOC in your own cloud | OTel-native teams wanting conversation/cost context |
| Langfuse | 50k units/mo, 2 users | Yes, MIT core, Docker/K8s/Terraform | Open source, high trace volume |
| LangSmith | 5k traces/mo, 1 seat | Enterprise only, custom pricing | LangChain/LangGraph-native teams |
| Helicone | 10k requests/mo, 1 seat | Yes, Apache 2.0, Docker Compose | Zero-code gateway setup |
| Arize Phoenix | Free self-host, no event caps | Yes, Elastic License 2.0 | Lightest footprint, full OTel portability |
| Datadog LLM Observability | Not published | No (SaaS, part of Datadog contract) | Existing Datadog APM customers |
| Braintrust | $10 credits, 10k scores | Enterprise/hybrid only | Eval-first, prompt-quality bottleneck |
| W&B Weave | 1 GB/mo ingestion | No (closed source) | Existing Weights & Biases users |
Free-tier limits, licenses, and self-hosting availability above were checked against each vendor’s own public pricing and documentation pages in September 2026. All of them change without notice, so confirm the current terms on the vendor’s page before you standardize on a tool.
Is AI observability the same as traditional infrastructure monitoring with AI features?
No, and conflating the two is a common source of confusion when researching this category. Traditional infrastructure and APM tools increasingly use AI and machine learning internally — for anomaly detection, alert correlation, or automated root-cause suggestions — to monitor conventional systems better. That’s a genuinely useful but separate category. AI observability, the focus of this comparison, is about monitoring AI systems themselves: LLM calls, agent workflows, prompts, evals, and the cost and quality of what a model produced. A team can need either, or both, depending on whether the question is “is our infrastructure healthy” or “is our AI feature behaving correctly and affordably.”
Conclusion: the bottom line
The right tool here depends less on which platform has the most features and more on two practical constraints: whether you want to stay portable across observability backends via OpenTelemetry or accept a proprietary SDK in exchange for deeper product-specific features, and whether self-hosting is a real requirement or a nice-to-have. Open-source, OTel-native options (Langfuse, Arize Phoenix, Last9’s SDK) suit teams that want to avoid lock-in or that operate under data residency constraints. Ecosystem-native options (LangSmith for LangChain, Weave for Weights & Biases, Datadog for existing Datadog customers) suit teams optimizing for the least new tooling to adopt. Eval-first platforms like Braintrust suit teams whose actual bottleneck is prompt and model quality, not request-level debugging.
For teams already instrumenting with OpenTelemetry who don’t want a second, disconnected tool just for AI features, Last9’s GenAI observability SDK extends the same OTel pipeline with conversation threading, workflow cost rollups, and full prompt visibility, without requiring a switch away from whatever backend is already in place.
FAQ
What are the best observability tools for AI agents?
Langfuse, LangSmith, Arize Phoenix, and Braintrust all trace multi-step agent runs, and Last9’s GenAI SDK threads agent handoffs across a session as OpenTelemetry spans. For agent work specifically, the feature that matters is whether a tool groups a whole run, including planning, tool calls, retries, and handoffs, under one trace rather than logging each model call separately. LangSmith is the closest fit for LangGraph agents. Arize Phoenix is the closest fit if you want that grouping without a vendor account at all.
What’s the difference between AI observability and traditional observability?
Traditional observability monitors infrastructure and application health: uptime, latency, error rates, and resource usage. AI observability monitors the behavior of AI systems specifically, meaning what a model was asked, what it returned, whether that output was correct, and what it cost, at the level of a conversation or agent workflow rather than a single request.
Is Langfuse better than LangSmith?
Neither is better in general, because they optimize for different constraints. Langfuse is MIT-licensed at the core, self-hostable on Docker, Kubernetes, or Terraform, and priced on units rather than seats, so it suits teams that want open source or that run high trace volume. LangSmith is LangChain’s first-party product, so a LangChain or LangGraph app needs no separate OpenTelemetry pipeline, but self-hosting is Enterprise-only. Pick Langfuse for portability and cost control, LangSmith for the LangChain integration.
Do I need a dedicated AI observability tool, or can my existing observability platform handle this?
It depends on how deep the requirement goes. Basic token counts and latency for LLM calls are covered by OpenTelemetry’s standard GenAI semantic conventions and can show up in any OTel-compatible backend. Conversation-level threading, prompt/completion visibility, and evaluation workflows generally need either a dedicated tool or an extension built specifically for that gap, like the OTel processors this comparison covers for Last9, Langfuse, and Arize Phoenix.
Is it worth using an open-source, self-hosted AI observability tool instead of a SaaS product?
For teams with data residency requirements or sensitive prompt content, self-hosting is often not optional. Langfuse, Arize Phoenix, and Helicone all support genuine self-hosting under permissive or source-available licenses, and Last9 deploys as Glassbox/BYOC inside your own cloud account. LangSmith and Braintrust only offer self-hosting on custom enterprise plans, and Datadog LLM Observability and W&B Weave don’t offer it at all; those three are SaaS-only regardless of budget.
What does “LLM-as-judge” evaluation mean, and which tools support it?
LLM-as-judge means using a separate model call to score the quality of another model’s output, catching issues like hallucination or off-topic responses automatically rather than requiring a human to review every output. Langfuse, LangSmith, Arize Phoenix, Braintrust, and W&B Weave all support some form of LLM-as-judge evaluation as a core feature.
How does pricing typically scale for AI observability tools as usage grows?
Most AI observability tools price on trace volume, request count, or ingested data, which means cost scales roughly with how much you instrument, not with team size. The practical risk is the same one covered in Last9’s guide to cloud cost management for observability: a tool that’s free at low volume can get expensive quickly once a feature is fully instrumented in production, so it’s worth checking a tool’s paid-tier pricing model, not just its free tier, before standardizing on it.
Can I use more than one AI observability tool at once?
Yes, and it’s common in practice. A team might use Arize Phoenix or Langfuse for open-source tracing during development, then route production traffic through an OTel-based tool like Last9’s SDK that keeps them on their existing backend, while using a dedicated eval tool like Braintrust for pre-deployment quality regression testing. Because most of these tools are OpenTelemetry-compatible on the ingestion side, running more than one isn’t the operational burden it would have been with fully proprietary SDKs.


