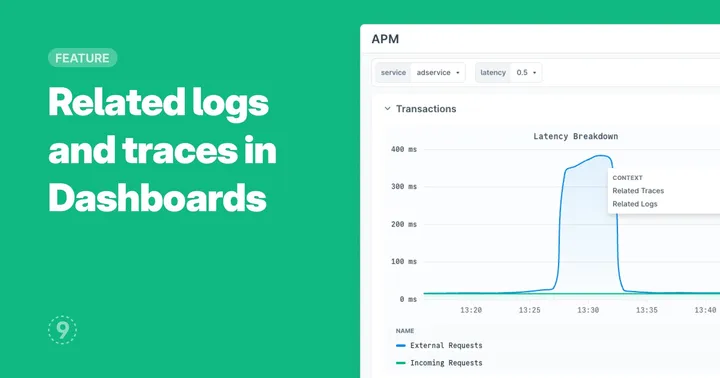
While viewing a Dashboard, you can now maintain context without having to switch screens by viewing related logs and traces in the same place.
- When you find an abnormality in a chart that you’d like to debug, click on the data point in the chart to view the context menu.
- Click “Related Traces” or “Related Logs” to open the side panel.
- Further, click on a particular trace or log line to see its relevant details like the dependency graph, attributes, and related telemetry.
- You can also click “View in Traces” or “View in Logs” to open the same filter in the Traces Explorer or Logs Explorer, respectively.