
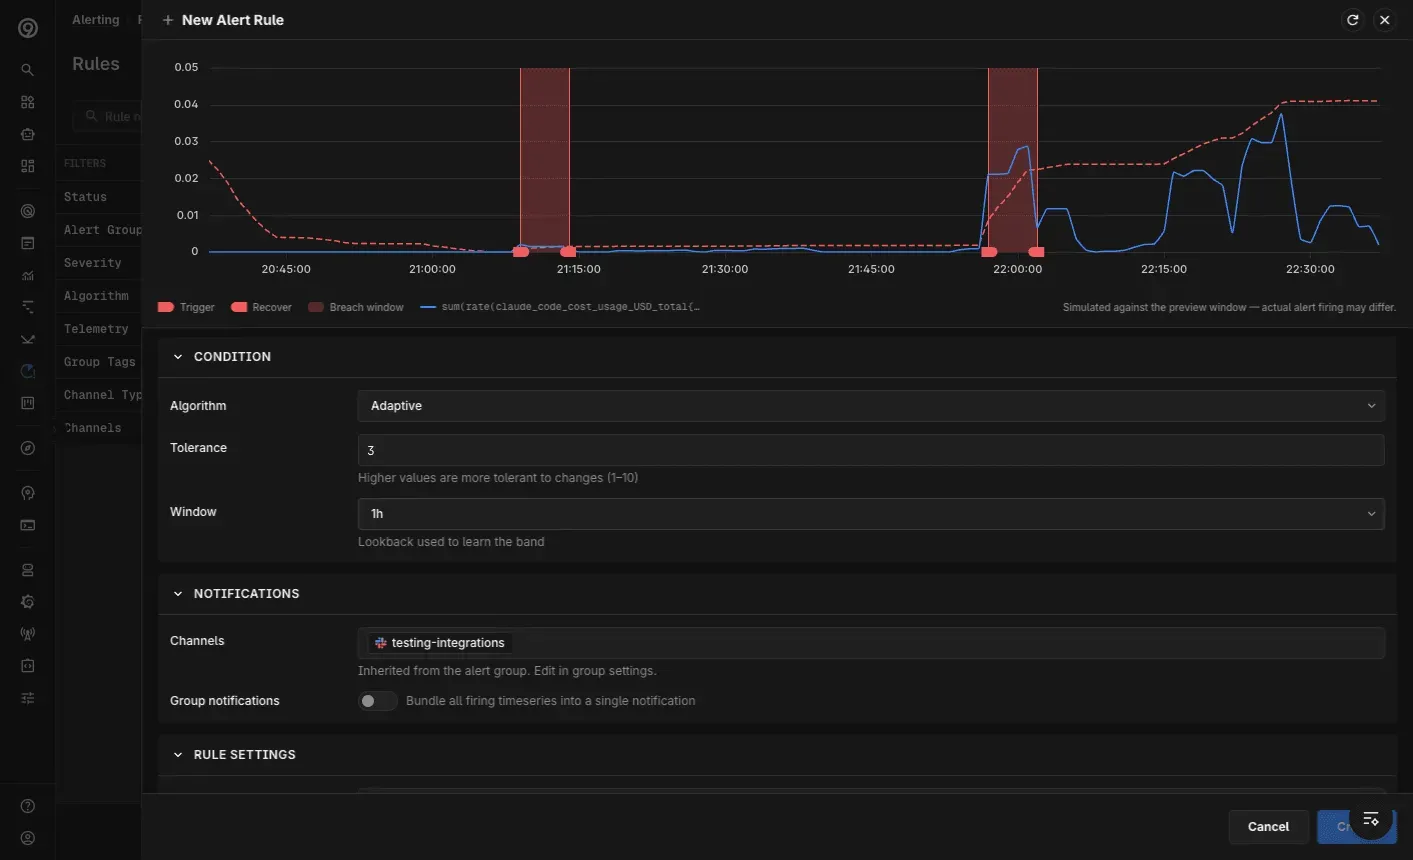
Alerting has been rebuilt from the ground up, with an editor that matches how you already explore data elsewhere in the product. You pick a query, see it rendered on a chart, and set your conditions against what you’re actually looking at — and the chart shows you exactly where the alert would trigger and where it would recover, so you’re not guessing what a rule will do before it fires.
Metrics and log alert rules are now created from the same place — build it with the no-code Builder, or write your query directly in PromQL for metrics or LogQL for logs.
The revamp touches the whole alerting surface:
- One editor for metrics and logs — compose a rule against a live chart preview, with trigger and recovery points marked directly on it, whether the source is metrics or logs
- Redesigned Rules page — find, group, and manage every alert rule from one place
- Alert Monitor — track active and recently fired alerts at a glance
- Alert group settings — configure data source, notification channels, and label filters together in a single flow
- Test before you ship — send a test alert while wiring up a notification channel to confirm it’s connected, instead of waiting for a real incident to find out
It’s also a step toward a more consistent experience across the app — defining an alert now feels like the rest of Last9, not a separate world with its own rules. See the Alerting docs for the full walkthrough.
Note: as part of this, Scheduled Search is being folded into log alert rules — a log alert rule and a scheduled search map to each other, and Scheduled Search as a standalone surface will be deprecated in favor of log alert rules.
Improvements
- Dashboards
- Chart data straight from a CSV file — upload a spreadsheet, pick your columns, and visualize it in a panel without ingesting it as metrics first, built for quick ad-hoc analysis
- A static markdown panel type for section headers, runbook notes, and context blocks, authored right in the panel editor
- A per-widget “Show exact value” toggle on stat widgets renders the full number instead of a rounded or abbreviated value
- Manage custom dashboards as code with the new
last9_dashboardresource in the Last9 Terraform provider
- Control Plane: The usage page now shows ingestion volume — the actual size of your ingested data — alongside event counts
- Discover
- The Applications (RUM) Errors and Mobile Vitals views can now break down by network connection type, so you can separate cellular from wifi performance
- Stable, versioned releases are now available for the mobile SDKs
- Alerting: Email notification channels now accept addresses outside the org’s allowed domains, so you can route alerts to addresses like a Slack email-to-channel destination
Fixes
- Alerting
- After an alert was resolved, subsequent fires of the same alert kept landing in the already-resolved Slack thread instead of starting a new message, making new incidents easy to miss
- Sending a test alert to an email channel failed with a
501 Invalid RCPT TOerror when the channel name was two or more characters
- Dashboards
- Table visualizations with multiple group-by fields and no timeslice collapsed every dimension into a single row instead of giving each group-by its own column
- Saving a dashboard with an invalid panel failed without a clear error message explaining which panel was at fault
- Logs
- The log attribute view was truncated and cut off longer values
- The range logs chart could crash when zooming right after hovering
- Log charts drew a connecting line across gaps in the data instead of breaking the line where data was missing
- Live tail failed when routed through the Last9 API path
- Metrics
- The chart tooltip displayed sub-decimal values (for example
0.000234) as0
- The chart tooltip displayed sub-decimal values (for example
- Discover
- Clicking a process on the service catalog page crashed the page
- Pod-level and container-level filters in Discover Kubernetes returned no data when applied
- The mobile SDK used the service name as its client ID, so multiple devices shared one ID and exhausted the rate limit; it now uses a unique device identifier