
Acknowledge an alert
Alerting now supports acknowledgement. An on-call engineer can claim a firing alert, and everyone else sees who acknowledged it and when. Acknowledge from the actions menu on an alert row, or from the chip in the alert details header.
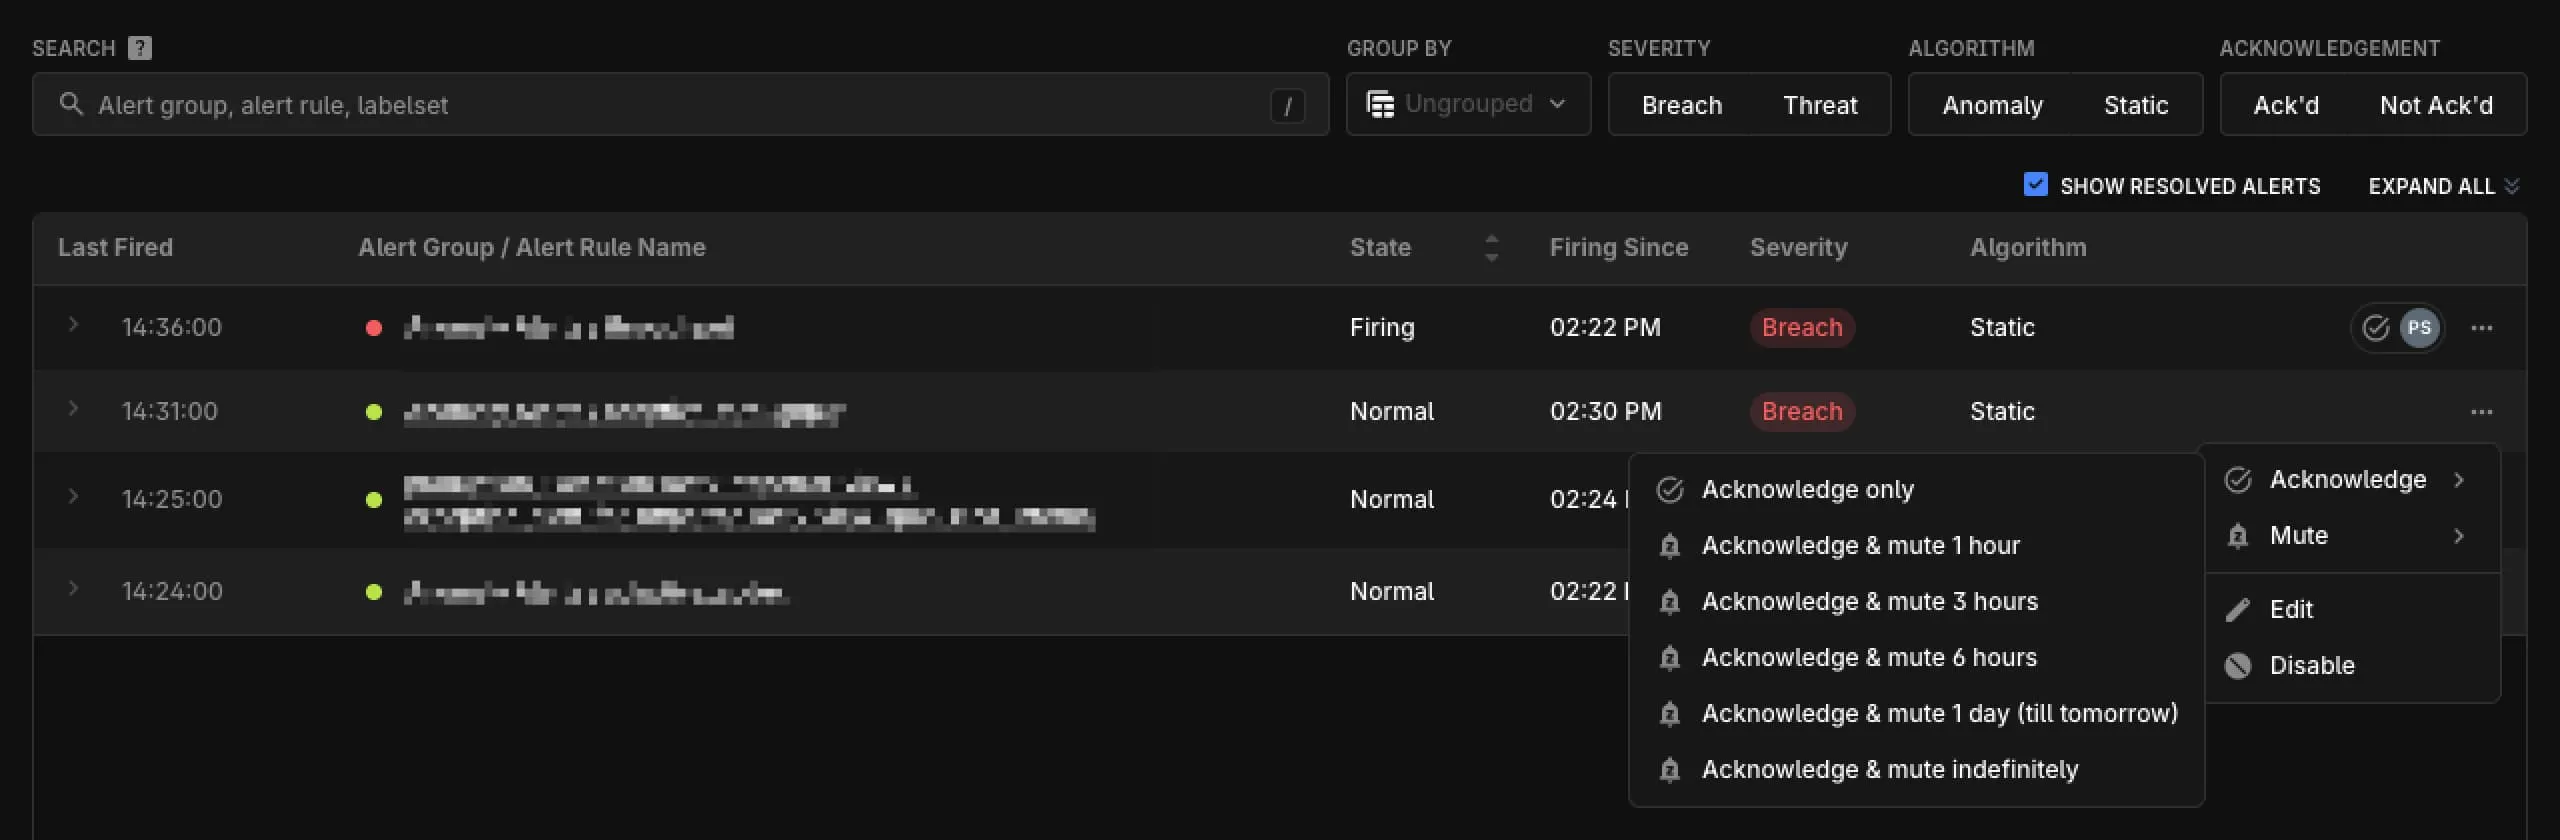
An acknowledgement records the owner and nothing else — notifications carry on as configured. When you have picked up the alert and do not want to be paged about it again while you work, Acknowledge & mute does both in one action, for 1 hour, 3 hours, 6 hours, a day, or indefinitely.
The owner then appears everywhere the alert does: an avatar on the row, an Ack’d by chip in the details header, and the full name, email, and acknowledgement time on hover. One person owns a rule at a time, and the acknowledgement ends when the alert resolves, when the owner unacknowledges it, or when someone reassigns it.
Refer to Acknowledge Alerts for the full behavior, including reassignment and automatic release.
EC2 context in Discover Hosts
Discover → Hosts shows the AWS context behind each EC2 instance instead of a generic “cloud Vm” row. Region, account, AMI, and platform now appear on the host, along with the instance family and size derived from the instance type — so an m5.xlarge is grouped under m5 rather than treated as its own kind of machine.
This comes from labels the OpenTelemetry host metrics pipeline already collects, so existing agents pick it up without a new integration.
Improvements
- Alerting
- Metric alert emails are a curated incident card instead of a dump of every
custom_detailskey, so the email says what fired and why without exposing internal tags and expression fragments - The Alert Rules table can be sorted by severity, telemetry type, and the other columns, and the rules list can be exported as CSV
- Change event markers on charts are easier to read and interact with
- Metric alert emails are a curated incident card instead of a dump of every
- Discover Applications (RUM)
- Mobile sessions no longer end when the app goes to the background. Pressing Home or opening a system file picker keeps the session alive, and only a kill or swipe-away starts a new one
- Sessions that are still in progress appear in the sessions list for the selected window, instead of only showing up once they end
- The mobile SDKs expose a configurable export flush delay, so events appear immediately during development while production keeps batching
- Integrations: The iOS RUM SDK is available through Swift Package Manager, so Xcode resolves it as a package instead of a version-pinned xcframework URL
- AI Assistant: Investigations can run on OpenAI models, either through OpenAI directly or through the Amazon Bedrock Responses API, alongside the existing Anthropic and Bedrock Converse paths
- Agents
get_service_summaryis the deterministic fleet-ranking surface, with real counts and explicit sort and limit parameters, so repeated fleet-level questions return the same ranking- Log attribute discovery reports the shape of a plain-text Body instead of returning nothing, so models stop guessing a parser and returning silent zeros
Fixes
- AI Assistant
- Replies arrived as one block of text at the end of a turn instead of streaming as they were produced
- Approving a Slack action posted “No pending action was approved” even though the approval succeeded and the tool had started
- Conversations answered over the non-streaming API were missing from the chat sidebar and history
- Investigations on Bedrock Converse could fail after a tool chain with a validation error about the missing tool configuration
- Dashboards: Shared dashboards showed an error page instead of the dashboard
- Alerting
- Alert Rules search and the list column used group tags instead of labels, so a label such as
env=prodwas not searchable - The alert groups table lost its column sort after a group settings modal was closed
- Alert Rules search and the list column used group tags instead of labels, so a label such as
- Discover ECS: View Logs silently did nothing for services without an OpenTelemetry service name
- Discover Databases: Discovery from CloudWatch omitted resources that were present in the selected time range, showing about 70 DynamoDB rows where Metrics Explorer counted 101
- Discover Applications (RUM)
- Calling
startViewalongside automatic view tracking created a duplicate native view, and custom events landed on the automatic view rather than the named one - An
addEventfired while a view was being destroyed attached to the next view in the session, or was dropped when the view span had already ended - Boolean properties sent with
addEventdisplayed asfalseregardless of the value sent - Native and WebView spans in the same session carried different session IDs, so they did not group into one session
- Calling
- Agents
- Hosted MCP OAuth returned a 403 for users with the viewer role, so read-only access could not connect
get_change_eventscopied MCP parameter names into PromQL instead of the stored metric labels, so filtered queries returned zero while the unfiltered query showed the events- The
get_logstool description taught awindow_aggregateshape the API rejects
- Logs: Ask mode returned “can’t generate query” for some tenants on queries such as “find recent errors”