

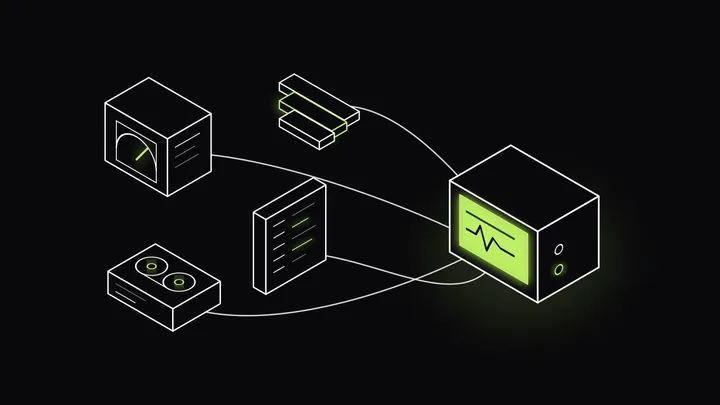
What is telemetry? Telemetry is the automated collection and movement of data from a remote system to another place where it can be stored, queried, analyzed, or used to trigger action.
In software and infrastructure, telemetry is the raw material behind observability. A service emits metrics, logs, traces, events, and profiles. A telemetry pipeline collects those signals, attaches context, processes them, and sends them to a backend. Observability starts when engineers can ask useful questions of that data: what changed, which service is slow, which users are affected, and what should happen next.
This guide defines telemetry, explains the common telemetry data types, and shows how a telemetry pipeline works. For a deeper comparison of telemetry, monitoring and observability, read our guide to observability vs telemetry vs monitoring.
What is telemetry?
Telemetry is data collected from a system, device, application, or environment and transmitted to another system for interpretation. The word is older than software: spacecraft, industrial machines, vehicles, and medical devices all use telemetry to report measurements from a distance.
Software telemetry follows the same pattern. Instead of a satellite sending temperature and battery readings, a service sends request latency, error counts, trace spans, log records, deployment markers, and runtime measurements. The receiving system might be a collector, a data pipeline, a time-series database, a log store, a trace backend, an alerting system, or an observability platform.
A useful telemetry definition has three parts:
- Measurement: something records a value or event, such as latency, status code, exception text, memory usage, or span duration.
- Context: the record carries enough labels or attributes to explain where it came from, such as service, host, region, route, customer tier, or version.
- Transmission: the record leaves the source system and reaches a place where it can be stored, queried, routed, or acted on.
Telemetry is not the same as the dashboard. It is not the same as the alert. It is the operational evidence those tools use.
Telemetry definition and telemetry meaning
The plain telemetry meaning is “remote measurement.” In engineering practice, that meaning expands to remote measurement plus delivery: the system reports what happened, when it happened, and where it happened.
For a backend service, telemetry might include:
- a request counter for the
/checkoutroute - a histogram for request duration
- a structured log line with
level=error - a trace span for a database call
- an event that says version
2026.11.18-3was deployed - a profile sample that shows CPU time inside a hot function
Telemetry can be continuous or event-driven. A host may report CPU every 15 seconds. A service may log only when a request fails. A trace may appear only for a sampled request. A deployment event may arrive once per release. All of those records are telemetry if they describe the state or behavior of a remote system and are sent somewhere else.
The main mistake is treating telemetry as inherently useful. Raw telemetry can be noisy, duplicated, too sparse, too expensive to store, or stripped of the labels needed during an incident. The useful work is choosing what to collect, keeping the context that matters, dropping what does not, and making sure the data arrives in a shape engineers can query.
What counts as telemetry data?
Telemetry data is operational data emitted by software, infrastructure, devices, or clients. It usually carries a timestamp, a source, a signal type, and attributes that describe the source or event.
The common telemetry data types are:
| Telemetry data type | What it records | What engineers use it for |
|---|---|---|
| Metrics | Numeric measurements over time | SLOs, alerts, trend analysis, capacity planning |
| Logs | Text or structured event records | Error detail, audit trails, local context, debugging |
| Traces | Request paths made of spans | Latency breakdown, dependency mapping, distributed debugging |
| Events | Point-in-time changes | Deployments, feature flags, incidents, configuration changes |
| Profiles | Resource use by code path | CPU, memory, allocation, lock, and runtime hot spots |
| RUM telemetry | Browser and mobile user experience | Page load, client errors, sessions, geography, device impact |
OpenTelemetry describes telemetry through signals such as traces, metrics, and logs. The OpenTelemetry project also defines conventions for resource attributes and semantic naming, which helps different tools describe the same service, host, cloud, and operation with the same keys.
A single request can produce several pieces of telemetry data. For example, POST /checkout might increment a metric, write an error log if payment fails, create spans for inventory and payment calls, attach a deployment event to the same time window, and show a CPU profile if request handlers get slow.
Each signal answers a different question:
- Metrics answer “is this behavior changing over time?”
- Logs answer “what did the code say at this moment?”
- Traces answer “where did this request spend time?”
- Events answer “what changed around the same time?”
- Profiles answer “which code paths consumed resources?”
For a deeper signal-by-signal breakdown, see our guide to metrics, events, logs, and traces.
How telemetry becomes observability
Telemetry is the raw signal. Observability is what you can infer from that signal about the internal state of a system.
Monitoring sits between them. Monitoring uses telemetry to watch known conditions: error rate above a threshold, queue depth too high, disk space below a limit, or an SLO burn rate moving too fast. Observability uses telemetry to answer questions you did not know to predefine.
A short way to separate the terms:
| Term | Role | Example question |
|---|---|---|
| Telemetry | Data emitted by systems | What records do we have? |
| Monitoring | Rules and views over known conditions | Is checkout error rate above 2%? |
| Observability | Exploration and correlation of telemetry | Why did checkout latency spike for one tenant after deploy? |
That distinction matters during incidents. A metric may tell you latency crossed a threshold. A trace may show the payment call added 600 ms. A log may show retries against a provider. A deployment event may show the exact version that changed. Observability comes from querying those signals together, not from collecting them in isolation.
How a telemetry pipeline works
A telemetry pipeline moves data from the place where it is produced to the place where it is stored, queried, alerted on, or forwarded. The pipeline is where teams control format, volume, context, and routing.
A typical pipeline looks like this:
- Instrument applications, infrastructure, clients, or libraries so they emit telemetry.
- Collect telemetry with an agent, SDK, sidecar, gateway, or managed integration.
- Process records by batching, filtering, enriching, redacting, sampling, or transforming them.
- Export the processed telemetry to one or more destinations.
- Store and query the data in a backend that supports the signal type and query language.
- Act through dashboards, alerts, SLOs, incident workflows, automation, or downstream systems.
The OpenTelemetry Collector is the standard vendor-neutral example. It receives telemetry, runs processors, and exports data to configured backends. In OpenTelemetry terms, receivers accept data, processors modify or batch it, exporters send it out, and pipelines connect those components.
A simple Collector pipeline might receive OTLP, batch records, add Kubernetes resource attributes, redact sensitive fields, and export to an observability backend. Our OpenTelemetry Gateway guide shows how that pattern works when many services send telemetry through a central Collector.
The important design choice is where control happens. If every service sends raw telemetry directly to a backend, changes require many application updates. If traffic passes through a Collector or control plane, teams can adjust processing rules centrally, before storage and query costs are locked in.
OpenTelemetry and telemetry standards
OpenTelemetry gives teams a common way to generate, collect, and export telemetry without starting from a vendor-specific agent. It defines APIs, SDKs, the OTLP protocol, semantic conventions, and the Collector.
That standardization matters because telemetry is useful only when it keeps consistent names and attributes. If one service reports service, another reports app_name, and another reports service.name, every dashboard and alert has to translate between them. If traces use one naming pattern and logs use another, correlation becomes manual work.
The practical OpenTelemetry building blocks are:
- APIs and SDKs for generating telemetry in application code.
- Auto-instrumentation for frameworks and runtimes where supported.
- OTLP for sending telemetry between components.
- Semantic conventions for consistent attribute names such as
service.name,deployment.environment, andhttp.route. - The Collector for receiving, processing, and exporting telemetry.
OpenTelemetry does not replace an observability backend. It standardizes how telemetry is produced and moved. You still need somewhere to store, query, alert, and correlate it. For a practical Collector walkthrough, read our guide on what the OpenTelemetry Collector is.
Telemetry examples engineers use every day
The easiest way to understand telemetry is to look at records engineers already use.
API latency metric
A service emits request duration as a histogram. The metric records how request latency changes over time and can power SLO burn-rate alerts.
http.server.request.duration{ service.name="checkout", http.route="/checkout", deployment.environment="production"}The metric is useful because it keeps the route, service, and environment. Without those labels, the team can see that latency changed but cannot tell where to look.
Error log
The same service writes a structured log when a payment request fails.
{ "timestamp": "2026-11-18T09:42:16Z", "level": "error", "service.name": "checkout", "http.route": "/checkout", "payment.provider": "acme-pay", "error.type": "timeout"}The log gives local detail that a metric does not: the provider, the error type, and any domain-specific fields the code logged.
Trace waterfall
A distributed trace shows the request path across services. The root span belongs to checkout; child spans show calls to inventory, pricing, payment, and notification services. If the payment span takes most of the request time, the trace narrows the search.
Deployment event
A deployment event marks that version 2026.11.18-3 reached production at 09:40. If latency began at 09:42, the event gives the first change to inspect.
Those four records are more useful together than separately. The metric detects the symptom, the trace localizes it, the log explains the local error, and the deployment event suggests the first likely cause.
Telemetry quality: what to collect and what to drop
More telemetry is not always better. The goal is to collect enough context to answer operational questions without storing noise, secrets, or duplicate records.
Good telemetry usually has these properties:
- Consistent identity: every signal uses the same service name, environment, region, version, and ownership labels.
- Useful cardinality: labels describe dimensions engineers query, such as route, tenant, customer tier, or feature flag, without creating accidental one-off values.
- Correct timestamps: records line up across services and signals.
- Sensitive fields controlled early: credentials, tokens, personal data, and secrets are redacted before storage.
- Clear ownership: telemetry carries enough context to route incidents to the team that can act.
Bad telemetry often fails in predictable ways. It drops the labels needed to isolate one tenant. It logs sensitive fields and then relies on downstream cleanup. It emits high-cardinality values accidentally, such as raw request IDs on metrics. It keeps debug noise forever but samples away the error trace needed during an incident.
A useful collection policy starts from incident questions:
- Which service, route, tenant, region, version, or customer segment is affected?
- What changed around the same time?
- Can we connect the metric, log, trace, and event through shared attributes?
- Can we drop or aggregate this data before storage without losing incident context?
That is where telemetry pipelines and ingest controls matter. The right place to remove sensitive fields or noisy records is before the data lands in long-term storage.
Where Last9 fits
Last9 sits after instrumentation and collection. You can send telemetry from OpenTelemetry, Prometheus, and supported integrations, then use Last9 to store, query, alert on, and manage that telemetry across signals.
Our docs describe Last9 as OpenTelemetry-native and Prometheus-compatible, with support for over 100 sources. The Control Plane gives teams runtime controls over telemetry after it is instrumented: ingestion, storage, query, and usage.
For ingest control, the documented Control Plane capabilities are specific. It can drop, remap, redact, forward, and aggregate telemetry at ingest, before storage. Drop rules discard unwanted telemetry. Remapping standardizes logs and traces. Sensitive Data rules redact supported sensitive fields. Forward rules send matching telemetry to object storage. Streaming Aggregations transform incoming telemetry into metrics before storage.
That matters for telemetry quality. You can keep the attributes that help incident response, redact fields that should not be stored, and reduce noisy streams centrally instead of pushing every change through application code.
If you are designing the backend side of this architecture, our guide to a telemetry data platform goes deeper into storage, query, routing, and lifecycle controls.
FAQ
What is telemetry in simple terms?
Telemetry is data collected from a remote system and sent somewhere else for storage, analysis, or action. In software, telemetry usually means metrics, logs, traces, events, and profiles emitted by applications, infrastructure, and user-facing clients.
What is the difference between telemetry and observability?
Telemetry is the data a system emits. Observability is the ability to ask questions of that data and understand what the system is doing internally. Telemetry gives you the raw signals; observability depends on collection, context, correlation, query, dashboards, and alerts.
What is telemetry data?
Telemetry data is operational data emitted by a system, usually with a timestamp and context. Common examples include CPU usage metrics, application log lines, distributed trace spans, deployment events, profiling samples, and attributes such as service.name, region, endpoint, tenant, or version.
What is an example of telemetry in software?
A checkout API can emit a request-count metric, an error log, a trace with spans for inventory and payment calls, and a deployment event showing the version that was released. Together, those records help an engineer see whether a latency spike came from code, infrastructure, or a downstream dependency.
Is telemetry the same as monitoring?
No. Monitoring uses telemetry to watch known conditions and alert when thresholds or rules match. Telemetry is the collected signal itself. Monitoring answers predefined questions such as is error rate above 2%, while observability helps investigate new questions during debugging.


