
Introduction
Prometheus is an open-source systems monitoring and alerting toolkit developed in 2012 by SoundCloud and later adopted by the Cloud Native Computing Foundation. It is designed for reliability, providing powerful queries, real-time alerting, and robust integrations.
Prometheus was adopted by the Cloud Native Computing Foundation (CNCF) as a hosted project on May 9, 2016. Prometheus became an official project under the CNCF's umbrella, joining other prominent projects like Kubernetes, Helm, and Envoy. The CNCF is a vendor-neutral organization that fosters the development and adoption of cloud-native technologies. By joining the CNCF, Prometheus gained increased visibility, community support, and collaboration opportunities within the cloud-native ecosystem. It is one of the many popular open-source tools related to Observability and Monitoring and is used as a go-to monitoring solution by many organizations.
Prometheus: A Time-Series Database
At its core, Prometheus serves as a multidimensional time-series database. Time-series data is a sequence of data points, typically comprising successive measurements made over time. In Prometheus, these time-series data are identified by a metric name and a set of key-value pairs, also known as labels. The database stores all incoming data in an efficient compressed on-disk database with a robust query language called PromQL.
The Prometheus /metrics HTTP endpoint is a crucial component of the Prometheus monitoring system. It is an HTTP endpoint exposed by applications, services, or infrastructure components that want to expose their metrics to Prometheus for monitoring and data collection.
The Prometheus Multi-Dimensional Data Model and Architecture
Prometheus adopts a pull-based multi-dimensional model for gathering metrics, contrary to the push-based model. This means it fetches the data itself, simplifying the architecture and making it easier to understand. The Prometheus server regularly scrapes metrics from metric sources and stores them locally.
Prometheus uses a pull model, where it periodically scrapes metrics data from configured targets rather than relying on targets to push their metrics to Prometheus actively. This allows Prometheus to control the collection frequency and enables dynamic target discovery.
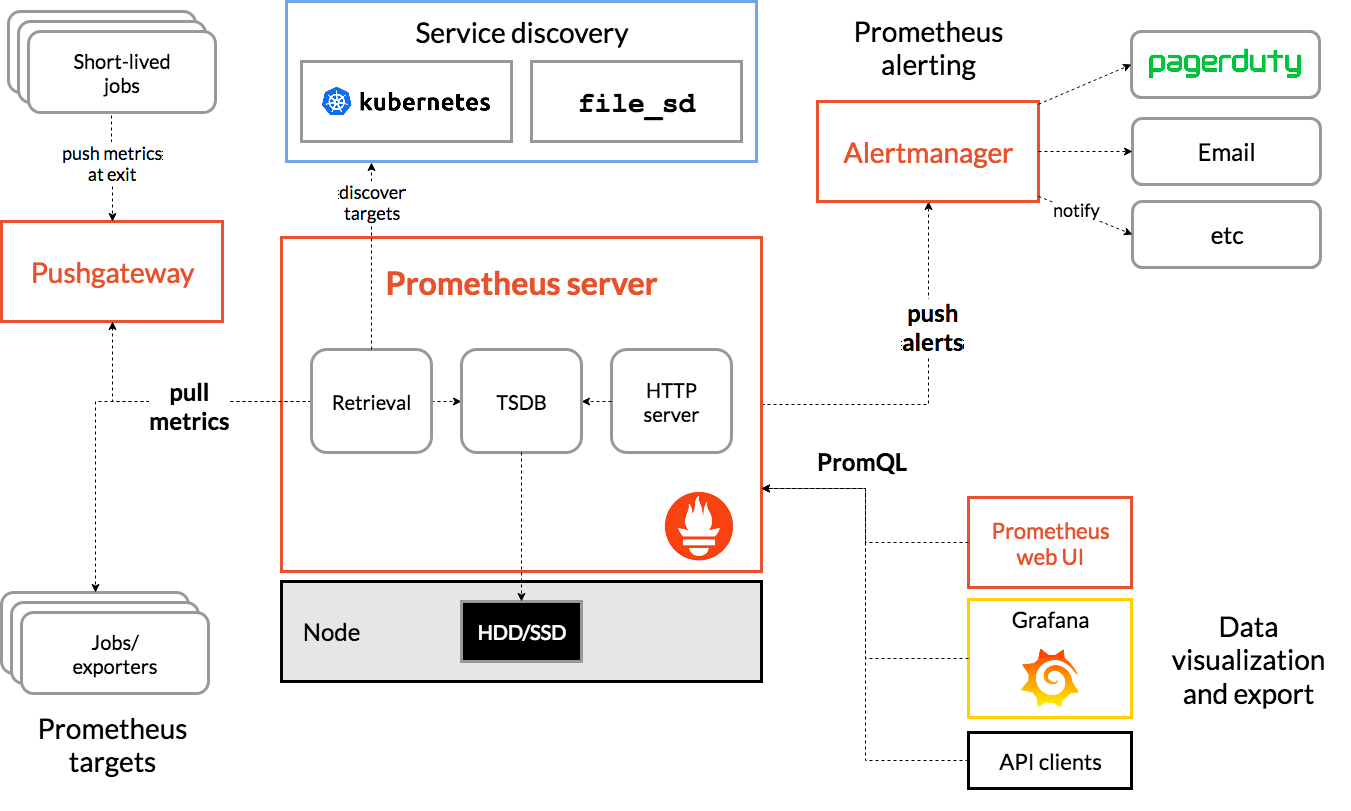
Prometheus is highly flexible in its architecture, allowing for deployment in various configurations to suit different requirements. Its architecture comprises various components:
- Prometheus server: The core component that scrapes and stores time series data.
- Client libraries: Used to instrument application code.
- Pushgateway: An intermediary service for ephemeral jobs.
- Exporters: Aid in exposing existing metrics.
PromQL: Prometheus Query Language
PromQL is Prometheus's powerful, flexible query language. It provides functions for arithmetic operations, comparisons, logical operations, filtering, aggregation, and transformation of time series data.
PromQL, short for Prometheus Query Language, is a query language specifically designed for querying and manipulating time-series data in Prometheus. As a developer, understanding PromQL can help retrieve and analyze metrics Prometheus collects in your applications. Here's an overview of PromQL concepts and syntax:
- Time-series data: PromQL operates on time-series data, which consists of a sequence of timestamped values. Each time series represents a specific metric, such as CPU usage or request latency, and is identified by a unique combination of key-value pairs called labels.
- Metric selectors: PromQL uses metric selectors to identify and filter specific time series for analysis. The basic syntax for a metric selector is
metric_name{label_name="label_value"}, where you can specify one or more labels to match against. For example,cpu_usage{instance="webserver1"}select the CPU usage metric for the "webserver1" instance. - Aggregation functions: PromQL provides various aggregation functions to summarize and analyze time-series data. Common aggregation functions include
sum,avg,max,min, andcount. For example,avg(cpu_usage)calculates the average CPU usage across all time series matching the selector. - Operators and modifiers: PromQL supports operators and modifiers to combine and manipulate time series. For instance, you can use arithmetic operators like
+,-,*, and/to perform calculations on time series. Additionally, modifiers likerate,increase, anddeltaallow you to calculate the rate of change over time or the difference between consecutive values. - Time range selection: PromQL enables you to specify the time range for which you want to retrieve metrics. You can use the
time()function with modifiers likeoffsetandrangeto define the time window. For example,cpu_usage{instance="webserver1"}[5m]it retrieves the CPU usage metric for the past 5 minutes for the "webserver1" instance. - Vector matching and operations: PromQL allows you to perform vector matching and operations on multiple time series. For instance, you can use the
group_leftorgroup_rightkeywords to match time series on standard labels and combine them. This enables you to perform operations like aggregation or calculation across related metrics.
Last9 allows defining advanced Macros using PromQL.
PromQL provides a rich set of functionalities to effectively analyze and query time-series data. By leveraging PromQL, you can extract valuable insights and monitor the performance of your systems by querying the metrics collected by Prometheus.
Installing Prometheus
To install Prometheus, you can follow these general steps:
- Download Prometheus: Visit the official Prometheus website and navigate to the Downloads section. Choose the appropriate version for your operating system.
- Extract the package: Once the download is complete, extract the contents of the downloaded package to a directory of your choice.
- Configuration: Prometheus requires a configuration file to define the targets it will scrape and other settings. Create a configuration file named
prometheus.ymlin the Prometheus directory and configure it according to your needs. You can refer to the Prometheus documentation for detailed configuration options. - Start Prometheus: Open a command prompt or terminal and navigate to the Prometheus directory. Execute the Prometheus binary file (e.g.,
prometheus.exeorprometheus) with the--config.fileflag, pointing to yourprometheus.ymlconfiguration file. For example: ./prometheus --config.file=prometheus.yml- Verify Installation: Open a web browser and access the Prometheus web interface by navigating to
http://localhost:9090(default port). You should see the Prometheus expression browser and various metrics and targets listed if the installation is successful.
You can also use Docker to install Prometheus.
Prometheus runs as a standalone server by default, scraping metrics from configured targets. You can then configure Prometheus to monitor different targets, set up alerting rules, and integrate with visualization tools like Grafana for enhanced monitoring and visualization capabilities.
Alertmanager
Alertmanager is a component of the Prometheus monitoring system that handles and manages alerts generated by Prometheus or other monitoring tools. It acts as a central hub for receiving, grouping, deduplicating, and routing alerts to various notification channels. Here's an explanation of Alertmanager for beginners:
- Alerting in Prometheus: Prometheus supports alerting based on predefined rules. When certain conditions or thresholds are met, Prometheus generates alerts to notify system administrators or other relevant parties about potential issues or anomalies.
- Role of Alertmanager: Alertmanager complements Prometheus by receiving and managing these alerts. It provides a unified interface to handle alerts, allowing you to define configurations and actions to take when specific alerts occur.
- Alertmanager configurations: To use Alertmanager effectively, you configure it by defining routes, receivers, and notification integrations. Routes determine how alerts are grouped and routed based on their labels. Receivers specify the channels or systems where notifications should be sent, such as email, Slack, PagerDuty, or other webhook endpoints.
- Alert grouping and deduplication: Alertmanager groups alerts based on their labels to prevent receiving multiple notifications for the same underlying issue. It can also deduplicate alerts, ensuring unique alerts are forwarded to the configured receivers.
- Notification and silence management: Alertmanager sends notifications to the specified receivers when alerts are triggered. It manages the lifecycle of alerts, including silencing alerts for specific periods to avoid unnecessary notifications during planned maintenance or known temporary issues.
- Integration with external systems: Alertmanager supports integration with various external systems and notification channels, enabling you to customize how and where alerts are sent. These integrations can be defined using templates or specific configurations for each receiver.
Alertmanager is crucial in managing and distributing alerts generated by Prometheus or other monitoring systems. It helps streamline handling alerts, reducing noise, and ensuring that relevant notifications reach the appropriate recipients. By configuring routes, receivers, and integrations, you can customize how alerts are handled and delivered based on your specific monitoring and notification requirements.
Know more about how Last9 handles alerting and notifications which is compatible with Prometheus AlertManager.
Prometheus Exporters
Prometheus exporters translate metrics from third-party systems into a format that Prometheus can understand. Examples include Node Exporter for machine metrics and cAdvisor for container metrics.
Prometheus exporters are a vital component in the Prometheus monitoring system. Prometheus follows a pull-based model, periodically scraping metrics data from your specified targets.
However, Prometheus doesn't have built-in support for monitoring every possible system or application out of the box. This is where Prometheus exporters come into play. Prometheus exporters are small programs or libraries that collect metrics data from specific systems or applications and expose them in a format that Prometheus can understand and scrape.
Here's how Prometheus Exporters work:
- Exporter Development: Exporters are typically developed by the community or the creators of the system or application you want to monitor. They are built to collect metrics using various methods, such as querying APIs, reading log files, or directly inspecting the system.
- Metrics Exposition: The exporter collects relevant metrics from the target system or application and exposes them in a specific format that Prometheus understands. The most common format exporters use is the Prometheus exposition format, which consists of simple text-based lines containing metric names, values, and labels.
- Exporter Configuration: Once you have an exporter, you need to configure Prometheus to scrape the metrics from the exporter. In Prometheus configuration, you specify the target URL where the exporter is running and listening for scrape requests. Prometheus will periodically send HTTP requests to the exporter's URL and retrieve the metrics data.
- Data Collection: During the scraping process, Prometheus pulls the metrics data from the exporter and stores it in its own time-series database. Prometheus also applies various operations like aggregation, recording rules, and alerting rules on the collected metrics to derive meaningful insights and trigger alerts if necessary.
- Visualization and Alerting: With the metrics data collected, Prometheus provides a powerful query language called PromQL that allows you to query and analyze the data. You can create custom dashboards, graphs, and alerts based on your specific requirements using tools like Grafana, which integrates seamlessly with Prometheus.
Prometheus Exporters play a crucial role in extending Prometheus' monitoring capabilities by enabling it to gather metrics from a wide range of systems and applications. Numerous exporters are available for popular software and services like databases, web servers, message brokers, and cloud platforms. You can centralize your monitoring infrastructure using exporters and gain a holistic view of your entire system.
It's worth noting that while Prometheus exporters are widely used, they are not the only way to collect metrics for Prometheus. Prometheus supports other mechanisms like direct instrumentation using client libraries and third-party integrations. However, exporters remain popular due to their flexibility and ease of integration with existing systems.
Prometheus Metrics - Counters, Gauges, Summary, and Histograms
Prometheus primarily deals with four types of metrics:
- Counter: A cumulative metric that represents a single monotonically increasing counter.
- Gauge: Represents a single numerical value that can arbitrarily go up or down.
- Summary: Similar to Histograms, it also calculates configurable quantiles.
- Histogram: Samples observations and counts them in configurable buckets.
Recording Rules and Alerting Rules
In Prometheus, recording rules and alerting rules are essential components for data processing and generating alerts based on defined conditions. Let's look at each rule type individually:
Recording Rules: Recording rules in Prometheus are used to create new time series or modify existing time series based on expressions. These rules help aggregate, transform, or filter raw metrics data into more meaningful or efficient forms. The resulting time series generated by recording rules can be used for visualization, graphing, or further analysis.
Recording rules consist of two main components:
- Rule Expression: The PromQL (Prometheus Query Language) expression defines how to transform or aggregate the metrics data. It can include functions, operators, and selectors for the available time series. For example, you can calculate averages and sums or apply mathematical operations to the data.
- Resulting Metric Name: This is the name assigned to the newly created or modified time series by the recording rule. It helps identify and refer to the transformed data in subsequent queries or alerting rules.
- Recording rules are defined in the Prometheus configuration file (prometheus.yml) using the
rule_filesconfiguration option. They are evaluated periodically by the Prometheus server, and the results are stored as separate time series that can be queried and used for visualization.
Alerting Rules: Alerting rules in Prometheus enable the generation of alerts based on specific conditions evaluated against metrics data. These rules allow you to define thresholds, time-based conditions, and complex expressions to trigger alerts when specific criteria are met. Alerts can be sent to various receivers, such as email, webhook, or third-party systems like PagerDuty or Slack.
Alerting rules consist of the following components:
- Rule Expression: This PromQL expression defines the condition or criteria for generating an alert. It typically includes functions, operators, and selectors to compare metric values against predefined thresholds or patterns. For example, you can create an alert if CPU usage exceeds a certain threshold for a specified duration.
- Alert Name: The name assigned to the alert rule for identification purposes. It helps you refer to and manage alerts within Prometheus.
- Alert Labels: Labels are key-value pairs associated with an alert. They provide additional information or metadata about the alert, which can be utilized for routing or filtering alerts to specific receivers or dashboards.
- Alerting rules are also defined in the Prometheus configuration file (prometheus.yml) using the
rule_filesoption. The Prometheus server periodically evaluates these rules against the collected metrics data and generates alerts when the defined conditions are met.
Both recording rules and alerting rules contribute to enhancing the functionality of Prometheus by enabling data transformation, aggregation, and automatic alerting based on specific conditions. These rules make it easier to process and monitor metrics data effectively.
Grafana
Grafana is a feature-rich data visualization and analytics tool commonly used for creating interactive dashboards. It supports various data sources, including Prometheus, and allows users to visualize time-series data in a highly customizable manner. Grafana's strength lies in its ability to connect to multiple data sources simultaneously, enabling users to combine metrics from different monitoring systems or databases in a single dashboard. Grafana provides a web-based UI with a drag-and-drop interface, making creating visually appealing dashboards that suit specific monitoring needs easy. It offers various visualization options, including graphs, charts, tables, and heat maps. Grafana also supports the creation of alerts and notifications, allowing users to set up custom alerting rules based on data thresholds. Furthermore, Grafana provides a plugin architecture that enables the integration of additional data sources, panels, and extensions to extend its capabilities.
Prometheus and Grafana
Grafana acts as the visualization and analytics tool in the Prometheus-Grafana stack. It connects to Prometheus as a data source and retrieves the time-series data for visualization. Grafana supports various data sources, including Prometheus, allowing users to integrate multiple sources into a single dashboard. Users can set up a connection to Prometheus in Grafana by providing the Prometheus endpoint and authentication details if required.
Prometheus and OpenTelemetry
OpenTelemetry is a set of APIs, libraries, agents, and instrumentation that helps you collect observability data such as traces, metrics, and logs from your applications. OpenTelemetry is designed to be vendor-agnostic and provides a standardized way to instrument your code and capture telemetry data. It supports multiple programming languages and integrates well with various observability backends.
To bring Prometheus and OpenTelemetry together, you can use OpenTelemetry exporters and integrations to send collected metrics from your applications to Prometheus. OpenTelemetry provides exporters specifically designed for Prometheus, which can transform the telemetry data into Prometheus-compatible formats. These exporters allow you to scrape metrics from your applications using Prometheus' pull-based model.
Prometheus Operators
Prometheus Operator simplifies Prometheus setup on Kubernetes and allows the configuration of an end-to-end monitoring stack. It includes features like automatically updating configuration files and managing instances.
Prometheus operators are tools for managing and operating Prometheus, a widespread open-source monitoring and alerting system. Prometheus operators come into the picture to simplify the deployment and management of Prometheus itself. They are a collection of tools, configuration files, and resources that help you automate the setup, scaling, and maintenance of Prometheus instances in a Kubernetes cluster. Kubernetes is an open-source container orchestration platform widely used to manage containerized applications.
Here are some critical aspects of Prometheus operators:
- Automation: Prometheus operators enable you to define Prometheus instances and associated resources using declarative configuration files, known as manifests. These files describe how your Prometheus instances should be deployed, including settings, rules, and service discovery information. By using operators, you can automate Prometheus's provisioning and configuration, saving time and effort.
- High availability: Prometheus operators help you set up Prometheus in a highly available manner. They handle the replication and distribution of Prometheus instances across multiple nodes, ensuring that if one instance fails, another takes over seamlessly. This redundancy enhances the availability of your monitoring system, reducing the risk of data loss and downtime.
- Scalability: As your infrastructure grows, you may need to scale your monitoring system accordingly. Prometheus operators simplify this process by allowing you to scale Prometheus instances horizontally or vertically. Horizontal scaling means adding more Prometheus instances to distribute the workload, while vertical scaling involves increasing the resources allocated to a single instance. Operators manage the underlying Kubernetes resources to accommodate the scaling needs.
- Self-healing: Prometheus operators monitor the health of Prometheus instances and automatically perform necessary repairs if any issues arise. For example, if an instance becomes unresponsive or experiences errors, the operator can restart the instance or create a new one to maintain the desired state. This self-healing capability ensures the continuous operation of your monitoring system.
- Integration: Prometheus operators integrate well with other Kubernetes-native tools and concepts. For instance, they can automatically discover and monitor new services as they are deployed in your Kubernetes cluster. They can combine Kubernetes resources like service discovery mechanisms, load balancers, and storage solutions to create a comprehensive monitoring setup.
Prometheus Client libraries
Prometheus provides client libraries for several popular programming languages, making instrumenting applications and exposing metrics easier. Here are some of the programming languages that have official Prometheus client libraries available:
- Go: Prometheus has an official Go client library called "client_golang." It provides a comprehensive set of functions and utilities for instrumenting Go applications and exposing metrics to Prometheus.
- Java: The Prometheus Java client library, "simpleclient," allows developers to instrument Java applications and expose metrics. It provides different modules for exposing metrics through HTTP, Pushgateway, or JMX.
- Python: The "prometheus_client" library is the official Prometheus client library for Python. It allows developers to instrument Python applications and expose metrics in Prometheus format.
- Ruby: Prometheus offers a client library called "prometheus-client" for instrumenting Ruby applications. It provides functionalities to define and expose custom metrics.
- JavaScript/Node.js: For JavaScript and Node.js applications, Prometheus provides the "prom-client" library. It enables developers to instrument their applications and expose metrics for monitoring.
- .NET/C#: The Prometheus .NET client library, "prometheus-net," allows developers to instrument .NET applications and expose metrics in Prometheus format.
These are just a few examples of the official client libraries provided by Prometheus. In addition, community-supported client libraries are available for other programming languages on GitHub. These libraries simplify the process of instrumenting applications and integrating with Prometheus, enabling developers to collect and expose custom metrics for monitoring and analysis.
Database monitoring using Prometheus
Prometheus can be used to monitor databases such as MySQL. Prometheus is a versatile monitoring system that can monitor various systems and applications, including databases. While Prometheus has built-in support for collecting and monitoring metrics from specific systems, for databases like MySQL, you would typically use a Prometheus exporter or an instrumentation library specific to that database.
There are several options available for monitoring MySQL with Prometheus:
- MySQL Exporter: The MySQL Exporter is a famous Prometheus exporter designed explicitly for collecting MySQL metrics. It runs as a separate process and exposes a
/metricsendpoint that Prometheus can scrape. The exporter connects to the MySQL server and gathers various metrics related to database performance, connections, queries, replication, and more. - Instrumentation Libraries: Alternatively, you can directly instrument your MySQL applications or infrastructure using a Prometheus client library. Libraries like Prometheus client for Go, Java, Python, or other languages can collect custom metrics from MySQL and expose them to Prometheus. This approach gives you more flexibility to monitor specific aspects of your MySQL database relevant to your use case.
Using a MySQL exporter or instrumentation libraries, you can collect metrics from MySQL and configure Prometheus to scrape those metrics regularly. Prometheus then stores the collected data in its time-series database, allowing you to perform queries, create dashboards, set up alerts, and gain insights into the performance and behavior of your MySQL database.
Scaling Challenges with Prometheus
While Prometheus is an excellent tool for monitoring applications, it can face challenges as you scale:
- Data Retention: Prometheus is not designed to be a long-term data retention system. Its primary function is real-time alerting, and it does not efficiently store data for an extended period.
- Horizontal Scalability: Prometheus servers are independent of each other; there is no native clustering or horizontal scalability. The data is not automatically shared or distributed across instances.
- Resource Intensive: As the number of monitored services grows, Prometheus may require substantial computational resources to collect and process data.
Here are a few situations where you might consider alternative solutions:
- High cardinality data: Prometheus is not well-suited for storing metrics with a high cardinality, where the number of distinct time series can be extremely large. This can lead to increased storage requirements and performance issues. In such cases, consider using a database designed explicitly for high-cardinality data, such as Last9.
- Long-term storage: Prometheus is primarily designed for storing and querying recent time-series data. It uses a disk-based storage model optimized for efficient querying of recent data. Suppose you must store metrics for an extended period, such as months or years. In that case, you may consider integrating Prometheus with a long-term storage solution, such as Thanos or Cortex, which provides extended storage capabilities, or Last9 with its tiered storage.
- Ad hoc querying and analytics: While Prometheus offers powerful query capabilities with its PromQL language, it may not be the best choice for complex ad hoc querying or advanced analytics use cases. If you require complex analytical queries, data transformations, or integration with other data sources, consider using a more flexible data analytics platform like Elasticsearch or Apache Druid.
- Highly distributed environments: Managing and federating data from multiple Prometheus servers can become complex in environments with many geographically distributed Prometheus instances or multi-cluster setups. In such cases, you might want to explore alternative solutions like Thanos, which provides a global view of metrics and simplifies the federation and querying of data across multiple Prometheus instances.
- Large data volumes and retention: If you have extremely high data volumes or need to retain metrics for a very long time, the storage requirements of Prometheus might become impractical. Consider using a distributed, scalable time-series database like Last9, TimescaleDB, or VictoriaMetrics, designed to efficiently handle large volumes of time-series data.
It's essential to evaluate your specific requirements and consider factors such as data volume, high cardinality, retention, querying needs, and scalability before deciding on the most appropriate database solution for your use case before using Prometheus.
Remote Write Mechanism
The remote write feature allows Prometheus to send data to other systems while retaining the data locally. The feature ensures that all remote systems have the same data as the local system.
The Prometheus Remote Write endpoint is a feature that allows Prometheus to send its collected time-series data to a remote storage system or service for long-term retention and analysis. Instead of storing all the data locally, Prometheus can offload the data to an external storage solution, which enables efficient scaling, long-term storage, and integration with other data processing tools.
Here's how the Prometheus Remote Write endpoint works:
- Configuration: Configure Prometheus with the appropriate settings to enable the Remote Write feature. This includes specifying the remote storage endpoint URL, authentication details if required, and other configuration options specific to the remote storage system.
- Data encoding: Prometheus uses the Remote Write protocol to encode and transmit its time-series data to the remote storage. The data is typically encoded in the Protocol Buffers format, which provides a compact and efficient representation for transmitting structured data.
- Batched transmission: Prometheus batches the collected time-series data into chunks before sending them to the remote storage. This batching improves efficiency by reducing the number of network round trips and optimizing data transmission.
- Consistency and reliability: The Remote Write endpoint ensures that the data sent to the remote storage is delivered reliably and consistently. It uses mechanisms such as acknowledgments and retries to handle network failures, ensuring the data is not lost during transmission.
- Remote storage integration: The remote storage system or service must provide an endpoint that adheres to the Prometheus Remote Write API specification. Popular remote storage options include Last9, Thanos, Cortex, and VictoriaMetrics.
Using the Remote Write endpoint, Prometheus can leverage the capabilities of external storage systems designed for long-term storage and analysis of time-series data.
Conclusion
Prometheus has become vital to the modern cloud-native ecosystem due to its simplicity and power. Its rich ecosystem of exporters, alerting capabilities, deep integration with Grafana, and compatibility with OpenTelemetry make it a versatile tool for observability. However, like all tools, it has limitations and challenges that should be considered during large-scale deployment. Scaling Prometheus is challenging, and long-term storage can become a pain.