Nov 4th, ‘22/6 min read
Kubernetes Monitoring with Prometheus and Grafana
A guide to help you implement Prometheus and Grafana in your Kubernetes cluster

Prometheus is the de facto standard for monitoring resources in Kubernetes. Grafana is the tool most heavily associated with Prometheus since it offers great visualization capabilities. These tools together form a great monitoring stack for Kubernetes, mainly targeted at organizations that prefer using open-source tools with large communities instead of a commercial solution.
The combination of these two tools can be helpful in various use cases. You can use them to do basic monitoring, perform cluster-wide troubleshooting, gain more visibility into your cluster, and set up actionable alerts on metrics in your cluster.
In this article, you'll get a high-level overview of both Prometheus and Grafana, as well as a demonstration of how they can be implemented inside your cluster.
What is Prometheus?
Prometheus is a powerful tool that you can use to retrieve metrics from close to any application. It's based on a pull system, meaning that your applications only have to expose metrics, and then Prometheus will pull them from the exposed endpoint.
This is one of the major advantages of Prometheus over other monitoring technologies because your applications don't have to know about or contact your monitoring server in any way. It does have to expose metrics on a certain endpoint, with the metrics following a standard schema. However, for most applications, the community has developed exporters (library or helper functions that expose the metrics) that you can easily integrate into your infrastructure.
Prometheus was originally developed by Soundcloud, and since then, it's become the favorite tool for managing time series data. Prometheus is also popular with Kubernetes ecosystem since it comes with the platform by default, and many services automatically expose a Prometheus endpoint. While you still need to perform some configurations to use Prometheus in your infrastructure, you don't need to worry about the installation process in Kubernetes.
Grafana is great for visualizing your metrics stored in prometheus, showing you CPU usage, RAM usage, and network egress, as an example. You can also perform cluster-wide monitoring, keeping a close eye on whether any nodes are getting overloaded and starting to kill any pods. If you're not using the metrics for troubleshooting, it gives you a great overall view of what your cluster is doing and how it's performing.
What Is Grafana?
Grafana is widely popular when it comes to visualizing data. You can use it to pull in metrics from various data sources like MySQL, Azure Monitor, Google Cloud Monitoring, and of course, Prometheus.
Once you've set up and configured a data source, you can start configuring various dashboards to get an appropriate visualization of what's happening inside your infrastructure.
In addition to displaying metrics from your infrastructure, Grafana also supports setting up alerts to notify you when something isn't working as expected, like a CPU suddenly using 90 percent of the available cores.
Note that alerting and visualization are the only things that Grafana helps you with. You might think that by using data sources, you'd be able to implement the same functionality as with Prometheus. This isn't possible because Grafana doesn't store data, while Prometheus does.
This is why Prometheus and Grafana are so commonly used in tandem. Prometheus has many great features that make it easy for you to collect and store your metrics, but it only has basic functionality in terms of visualization. Grafana can provide those missing visualization features. The two combined give you a great monitoring stack.
Implementing Prometheus and Grafana
You can use this guide to implement Prometheus and Grafana in your Kubernetes cluster.
Prerequisites
First, make sure you have the following in place:
* A running Kubernetes cluster
* A working `kubectl` configuration
* Helm installed
Installation
The first thing to do is not a necessary step, but it is a best practice. You want to create a new namespace where all your monitoring resources can live. Do so by executing the following:
$ kubectl create namespace monitoring
Now you're ready to install both Prometheus and Grafana.
Prometheus may be the standard for Kubernetes monitoring, but it isn't built only to work on Kubernetes. Because of this, you have two options for installing Prometheus on Kubernetes.
You can install it using the Docker image, where you'll have to create ClusterRoles, deployments, and ConfigMaps yourself. This can be a tedious process, so instead, use the officially provided Helm chart. The Prometheus Helm chart has the added advantage of installing Grafana at the same time.
To use the Helm chart, first install the Prometheus community repository:
$ helm repo add prometheus-community https://prometheus-community.github.io/helm-charts && \
helm repo update
Now you can install Prometheus and Grafana with the following `helm` command:
You should quickly be able to see a bunch of running pods by executing the following:
$ kubectl get pods -n monitoring
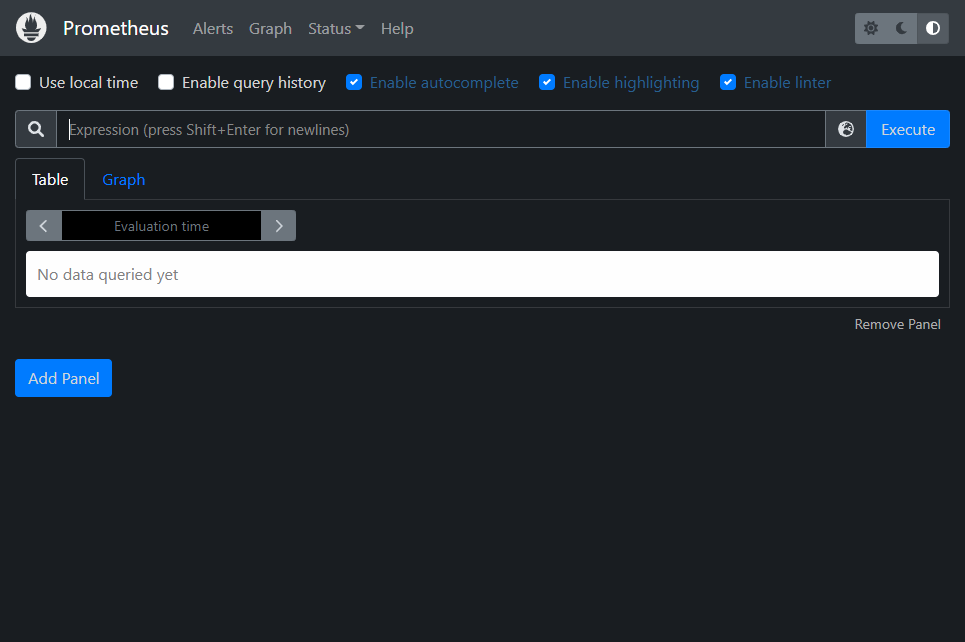
Prometheus and Grafana should now be installed in your cluster. You can access the WebUI of Prometheus and verify the installation by running the following:
$ kubectl port-forward --namespace monitoring svc/kube-stack-prometheus-kube-prometheus 9090:9090
The same approach can be used to access your Grafana instance:
kubectl port-forward --namespace monitoring svc/kube-stack-prometheus-grafana 8088:80
When you open your browser to access Grafana, you'll have a login screen. The credentials to use here are stored in two different secrets inside Kubernetes, which you can get by running the following:
$ kubectl get secret --namespace monitoring kube-stack-prometheus-grafana -o jsonpath='{.data.admin-user}' | base64 -d && \
kubectl get secret --namespace monitoring kube-stack-prometheus-grafana -o jsonpath='{.data.admin-password}' | base64 -d
As of this article, the above will show the default username as `admin` and the default password as `prom-operator`.
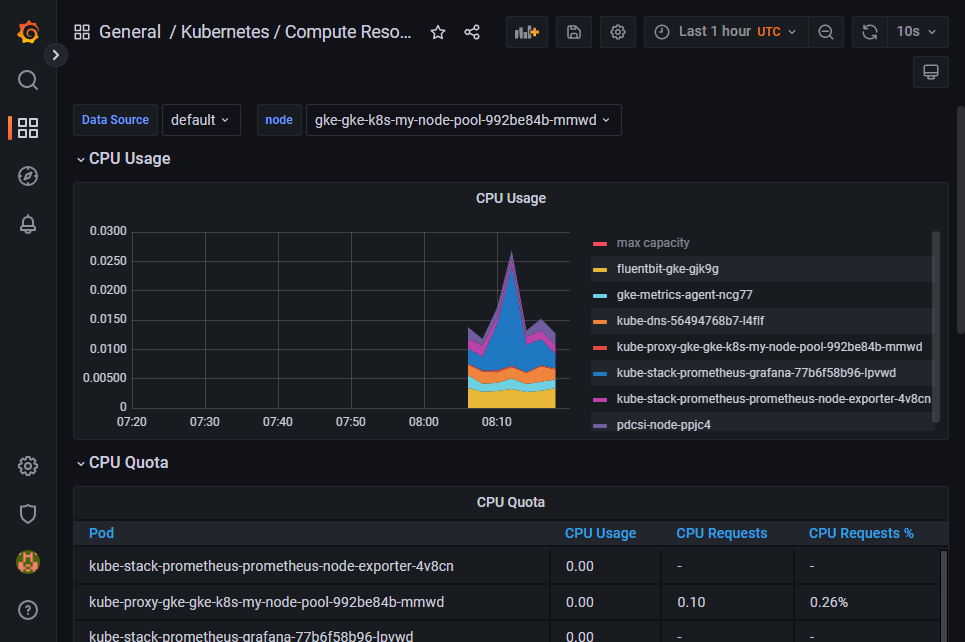
When you open Grafana, you'll notice that it comes preloaded with dashboards that can give you insights into your Kubernetes cluster. Through these dashboards, you can view important metrics like CPU and RAM usage, network bandwidth, and network usage.
When you start using Grafana in production, there are some metrics you'll want to watch more closely than others. You'll need to stay aware of the two most basic metrics of them all: CPU and RAM. Kubernetes will always try its best to be in a healthy working state, and running with 100 percent RAM usage isn't considered a healthy state. If pods on a node start using too much RAM, Kubernetes will begin to kill pods until the usage is down to a reasonable point.
Without any limits set up, this can start to affect pods other than the ones using too much RAM, so it's important to keep track of your usage.
Challenges in Setup and Scaling
Prometheus and Grafana are great tools to help you monitor your Kubernetes cluster, but be aware that you might have trouble scaling your implementation, especially regarding Prometheus.
By default, Prometheus doesn't come with any solutions on how to scale. You can scale vertically and increase the resources your Prometheus installation can access; however, that can quickly become costly and unstable.
Instead, you can use horizontal scaling. To do this, you'll need to use third-party tools like Thanos or Cortex. Considering the multiple instances involved in horizontal scaling, keep in mind that configuration management will become extremely tedious process. You'll have to pass your Prometheus configuration on to multiple instances and ensure they all work based on that same configuration. Levitate is a great time series warehouse solution that can solve all the scaling needs instead of managing it independently.
Interested in more such comparisons? Then may we suggest our blog where we are comparing all the popular time series databases.
Conclusion
Prometheus and Grafana make the best solution for setting up your monitoring practices inside Kubernetes, especially when getting started. Using them, you can troubleshoot issues with your cluster or application, get alerted to problems, and monitor your costs. By using Helm chart for installation, you can quickly get started on gaining the necessary visibility into your cluster.
Contents
Newsletter
Stay updated on the latest from Last9.
Handcrafted Related Posts

Unwiring High Cardinality - SRE Day 2023
Report from SRE Day 2023, where Piyush Verma - CTO Last9, gave a talk on Unwiring High Cardinality
Last9

SRE vs Platform Engineering
What's the difference between SREs and Platform Engineers? How do they differ in their daily tasks?
Last9
Prometheus Operator Guide
What is Prometheus Operator, how it can be used to deploy Prometheus Stack in Kubernetes environment
Last9