

Prometheus remote write is the de-facto method for sending metrics from your local Prometheus setup to your chosen long-term metric storage. This post walks through a scenario explaining how to reduce excess parallelism in remote writes without impacting the throughput of ingested samples.
Prometheus Remote write basics
These are the typical actions involved in a Prometheus remote write cycle:
- Prometheus sender scrapes targets as per scrape config.
- It stores samples as per the locally defined retention period.
- It remote writes samples as per
remote_writeconfig block to remote write receiver (e.g. Last9, Grafana cloud, Victoriametrics, etc.)
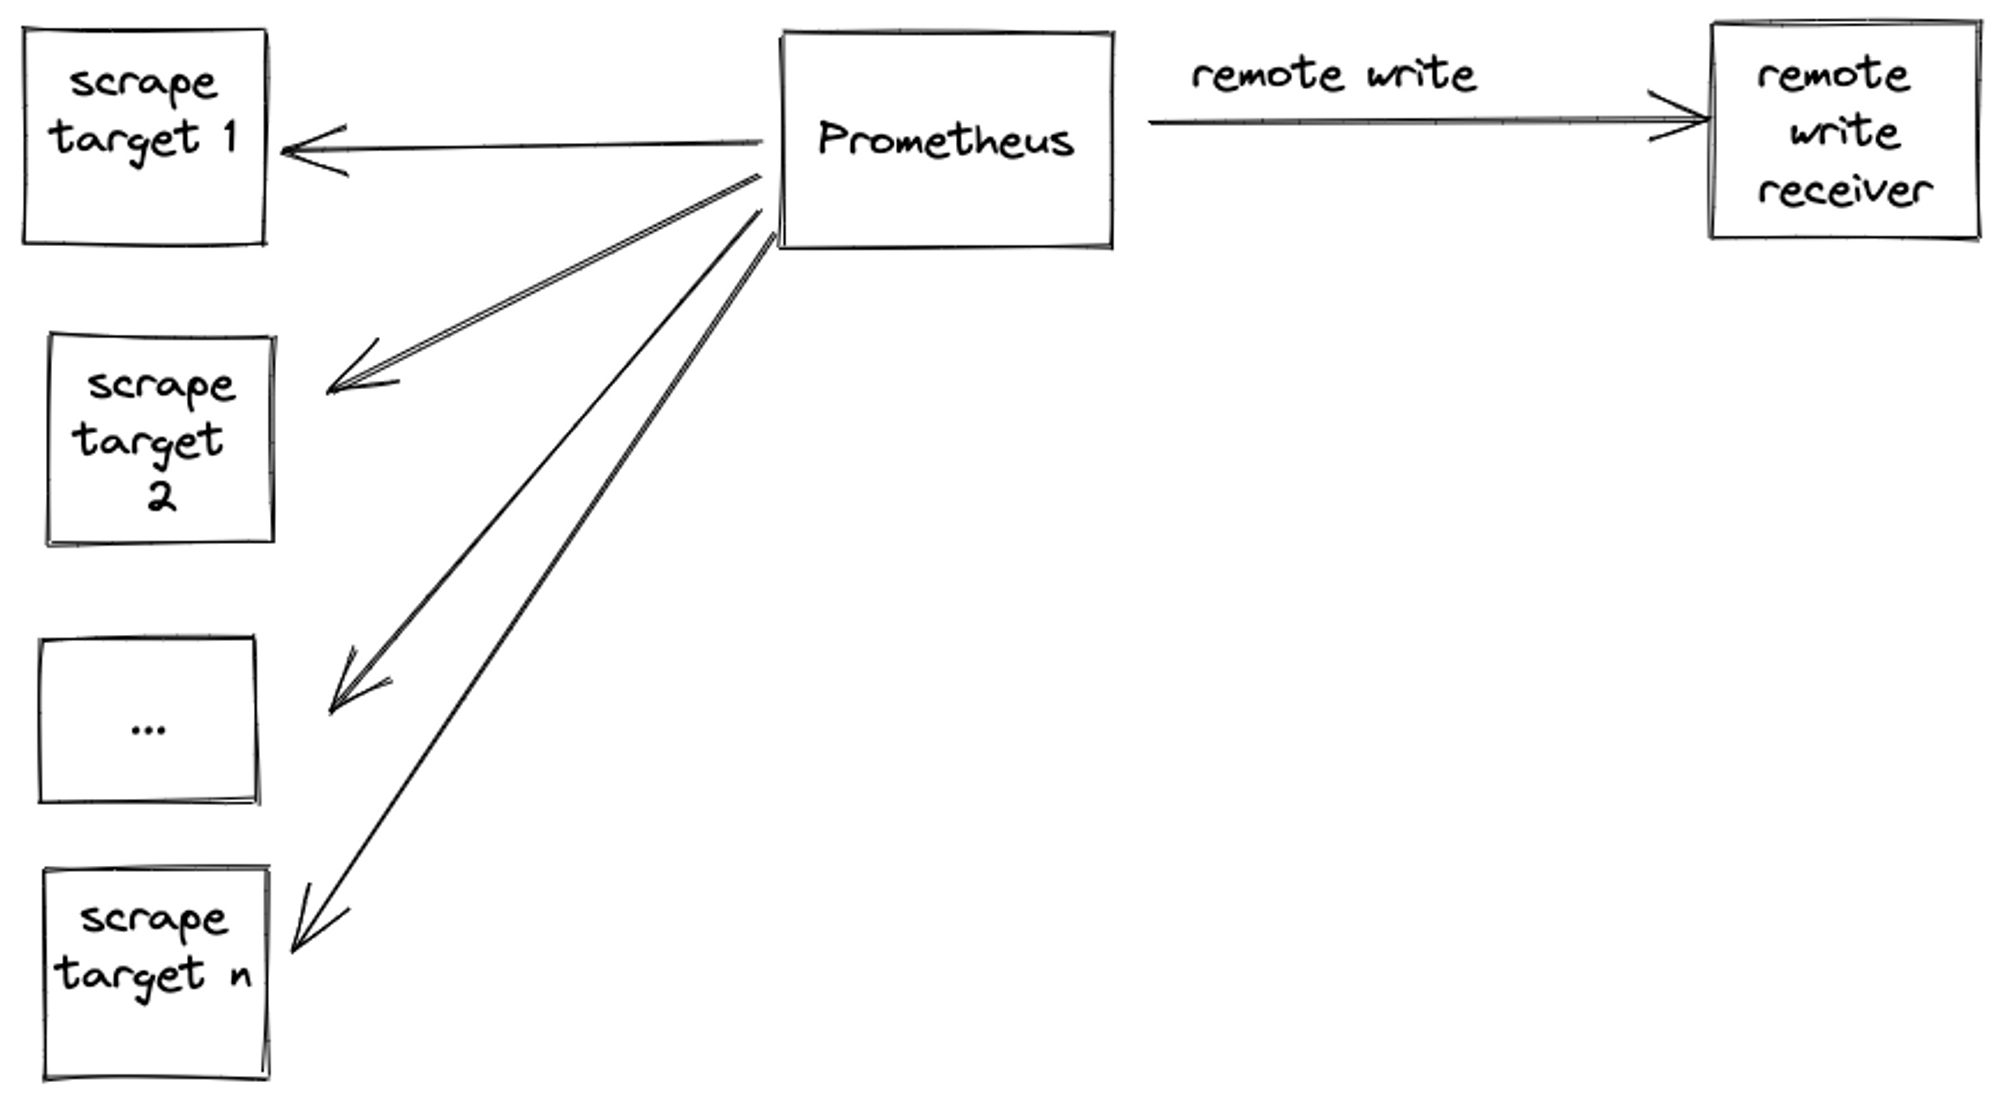
For the purpose of brevity, we will refer to Prometheus remote write sender as sender and Prometheus remote write receiver as receiver for the rest of the post.
One of the most common failure scenarios in the remote write system is an increased sender ingestion rate. This can happen due to the following reasons:
- New targets were discovered as new infra got provisioned e.g. new product launch, autoscaling existing infra, etc.
- An application caused a cardinality explosion by increasing dynamic values for one or more labels e.g customer ids spike caused by bulk onboarding customers.
This increased ingestion rate causes a spike in remote write rate, which can cause one of the following common scenarios:
- Both the sender and receiver continue operating normally.
- The sender couldn’t keep up with the increased ingestion rate and it crashed before it could remote write.
- The sender survived the surge but the receiver couldn’t keep up with the increased remote write throughput or concurrency and crashed, thereby causing backlog build-up on the sender end. When the receiver came up, it was hit with current metrics as well as the previous backlog (provided the sender didn’t discard the backlog due to timeouts).
For scenarios 2 and 3 - the solutions seem obvious - when the sender fails, scale up resources on the sender end and when the receiver fails, do the same for the receiver. This may do the trick in the interim, but you cannot keep on scaling infinitely and the obvious tunables for scale-up are limited e.g. CPU and memory.
What if the obvious tunable scale-ups don’t fix the problem? What if the tunable isn’t CPU or memory but network?
Problem
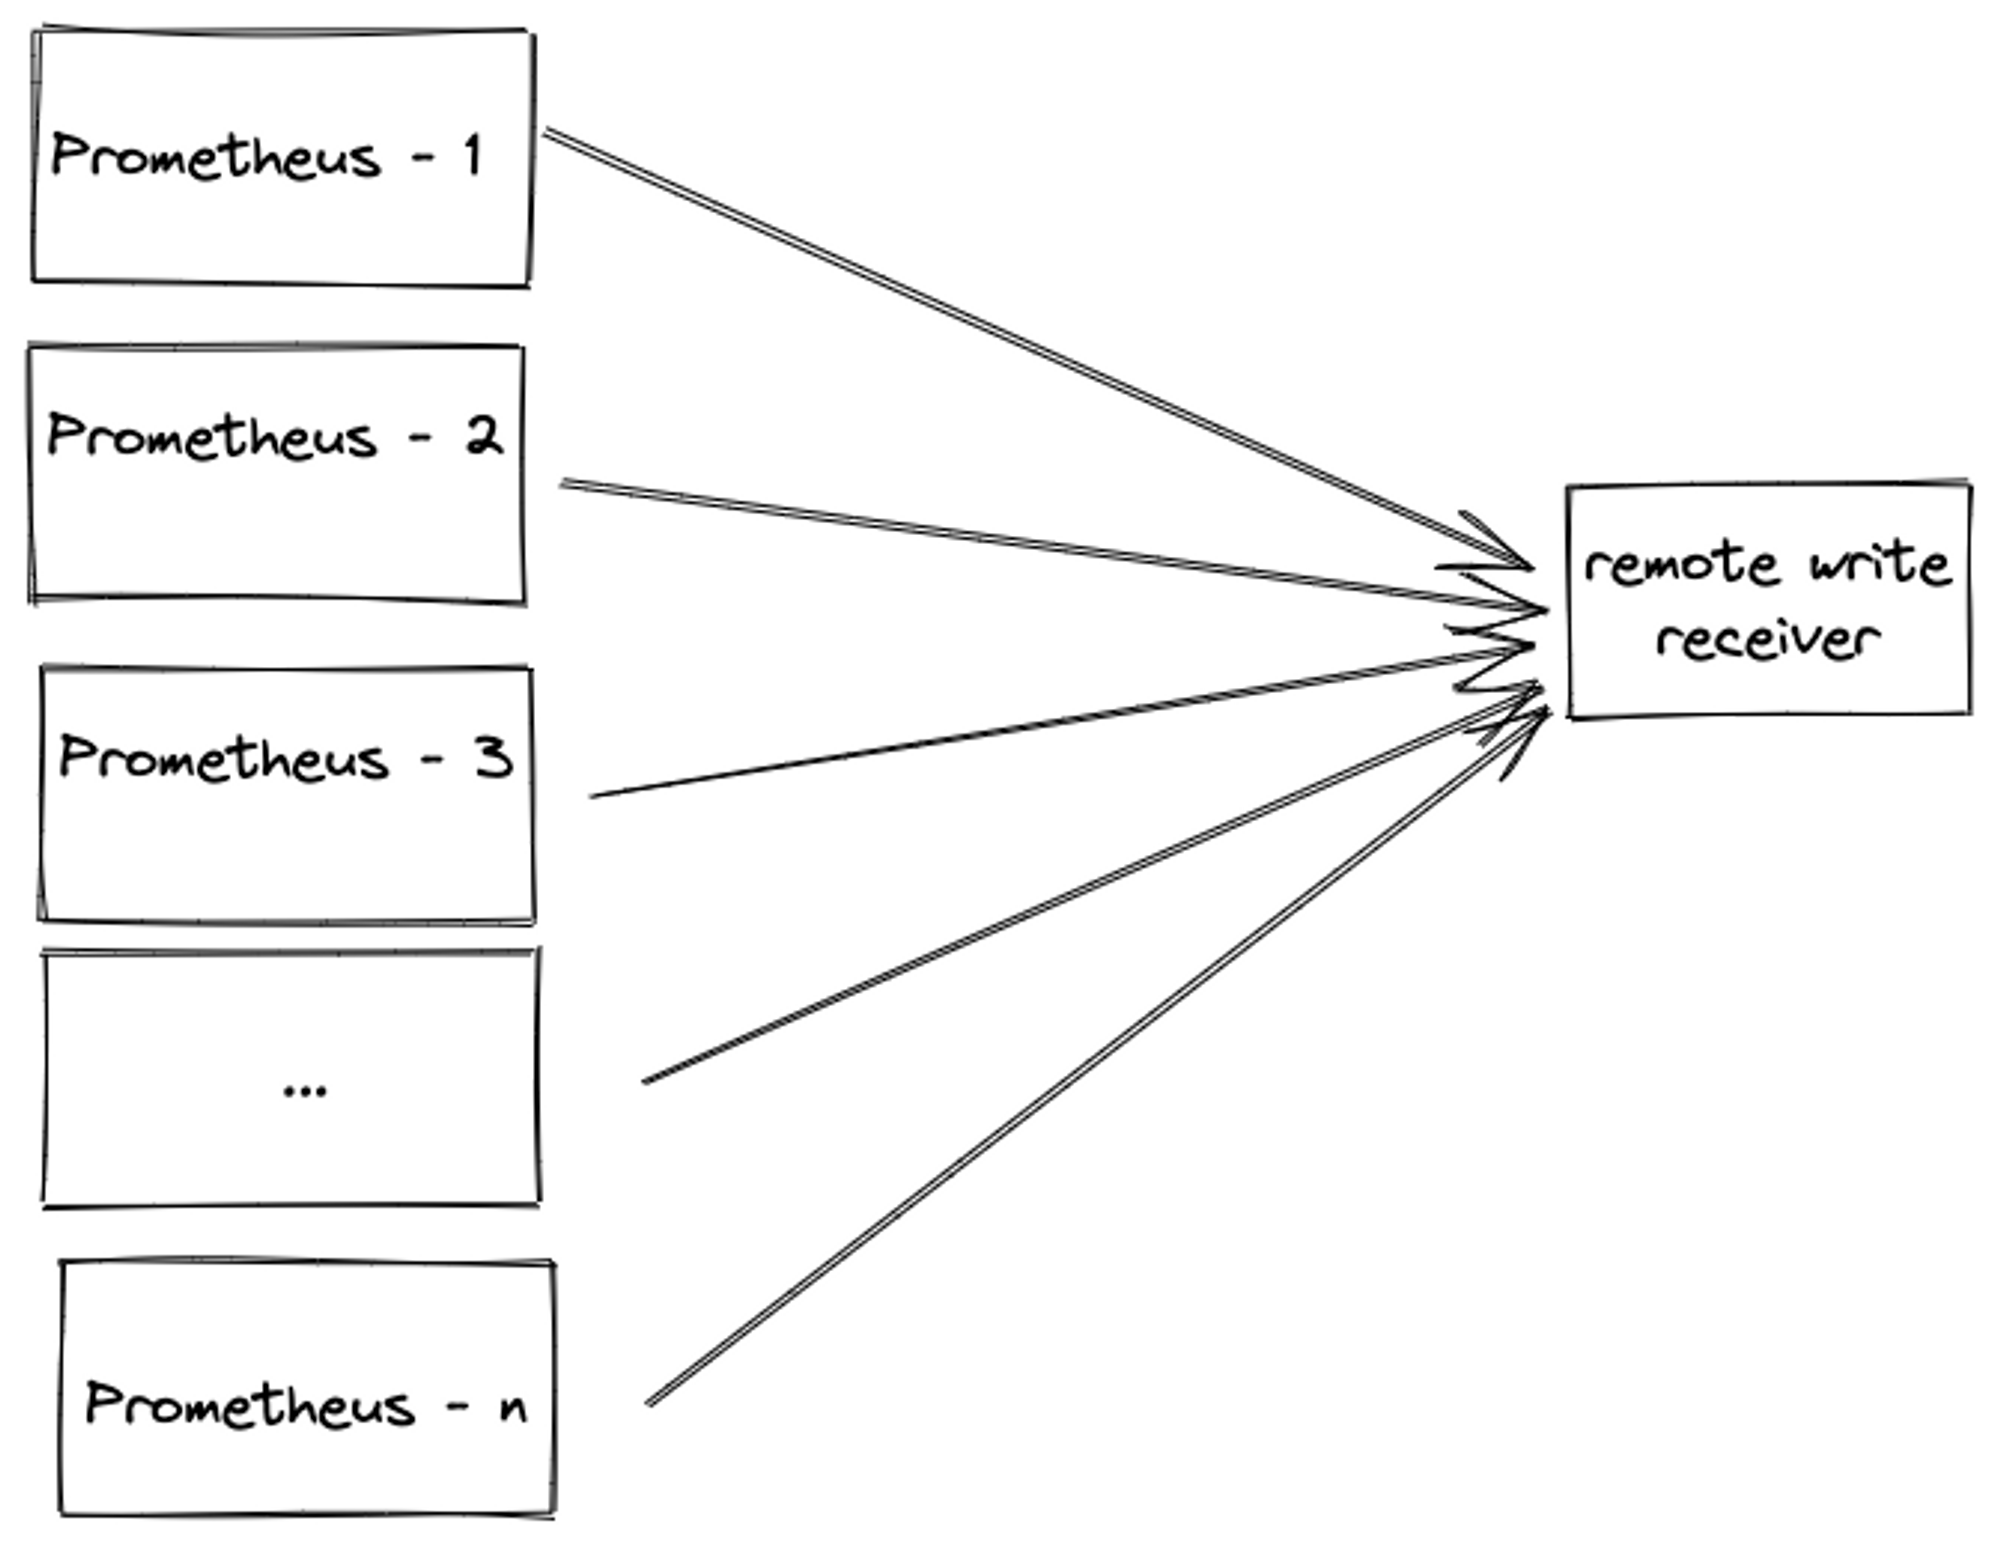
The last question is exactly the scenario we ran into. We had a customer who had around 180 Prometheus instances and planned to remote write to Last9. Each customer Prometheus instance had an ingestion rate of around 250K samples per minute causing the total throughput to Last9 to be 180 X 250000 = 45 million samples per minute. You can also find out your Prometheus ingestion rate by running a simple Prometheus query
sum(sum_over_time(scrape_samples_scraped{}[5m])/5)Ingesting N million samples from a single sender ≠ Ingestion N/M million samples from M senders.
The former can take advantage of the predictability of the single sender’s traffic while the latter has increased concurrency and a higher probability of a subset of M senders deviating from the expected pattern.
During our load tests in staging infra, we found that along with some boilerplate infra scale-up work, we also needed to reduce network communication overhead e.g. reduce connection establishment, teardown, etc. by increasing payload size and reducing parallelism, without impacting samples ingested throughput. This means fine-tuning the sender's Prometheus remote write config.
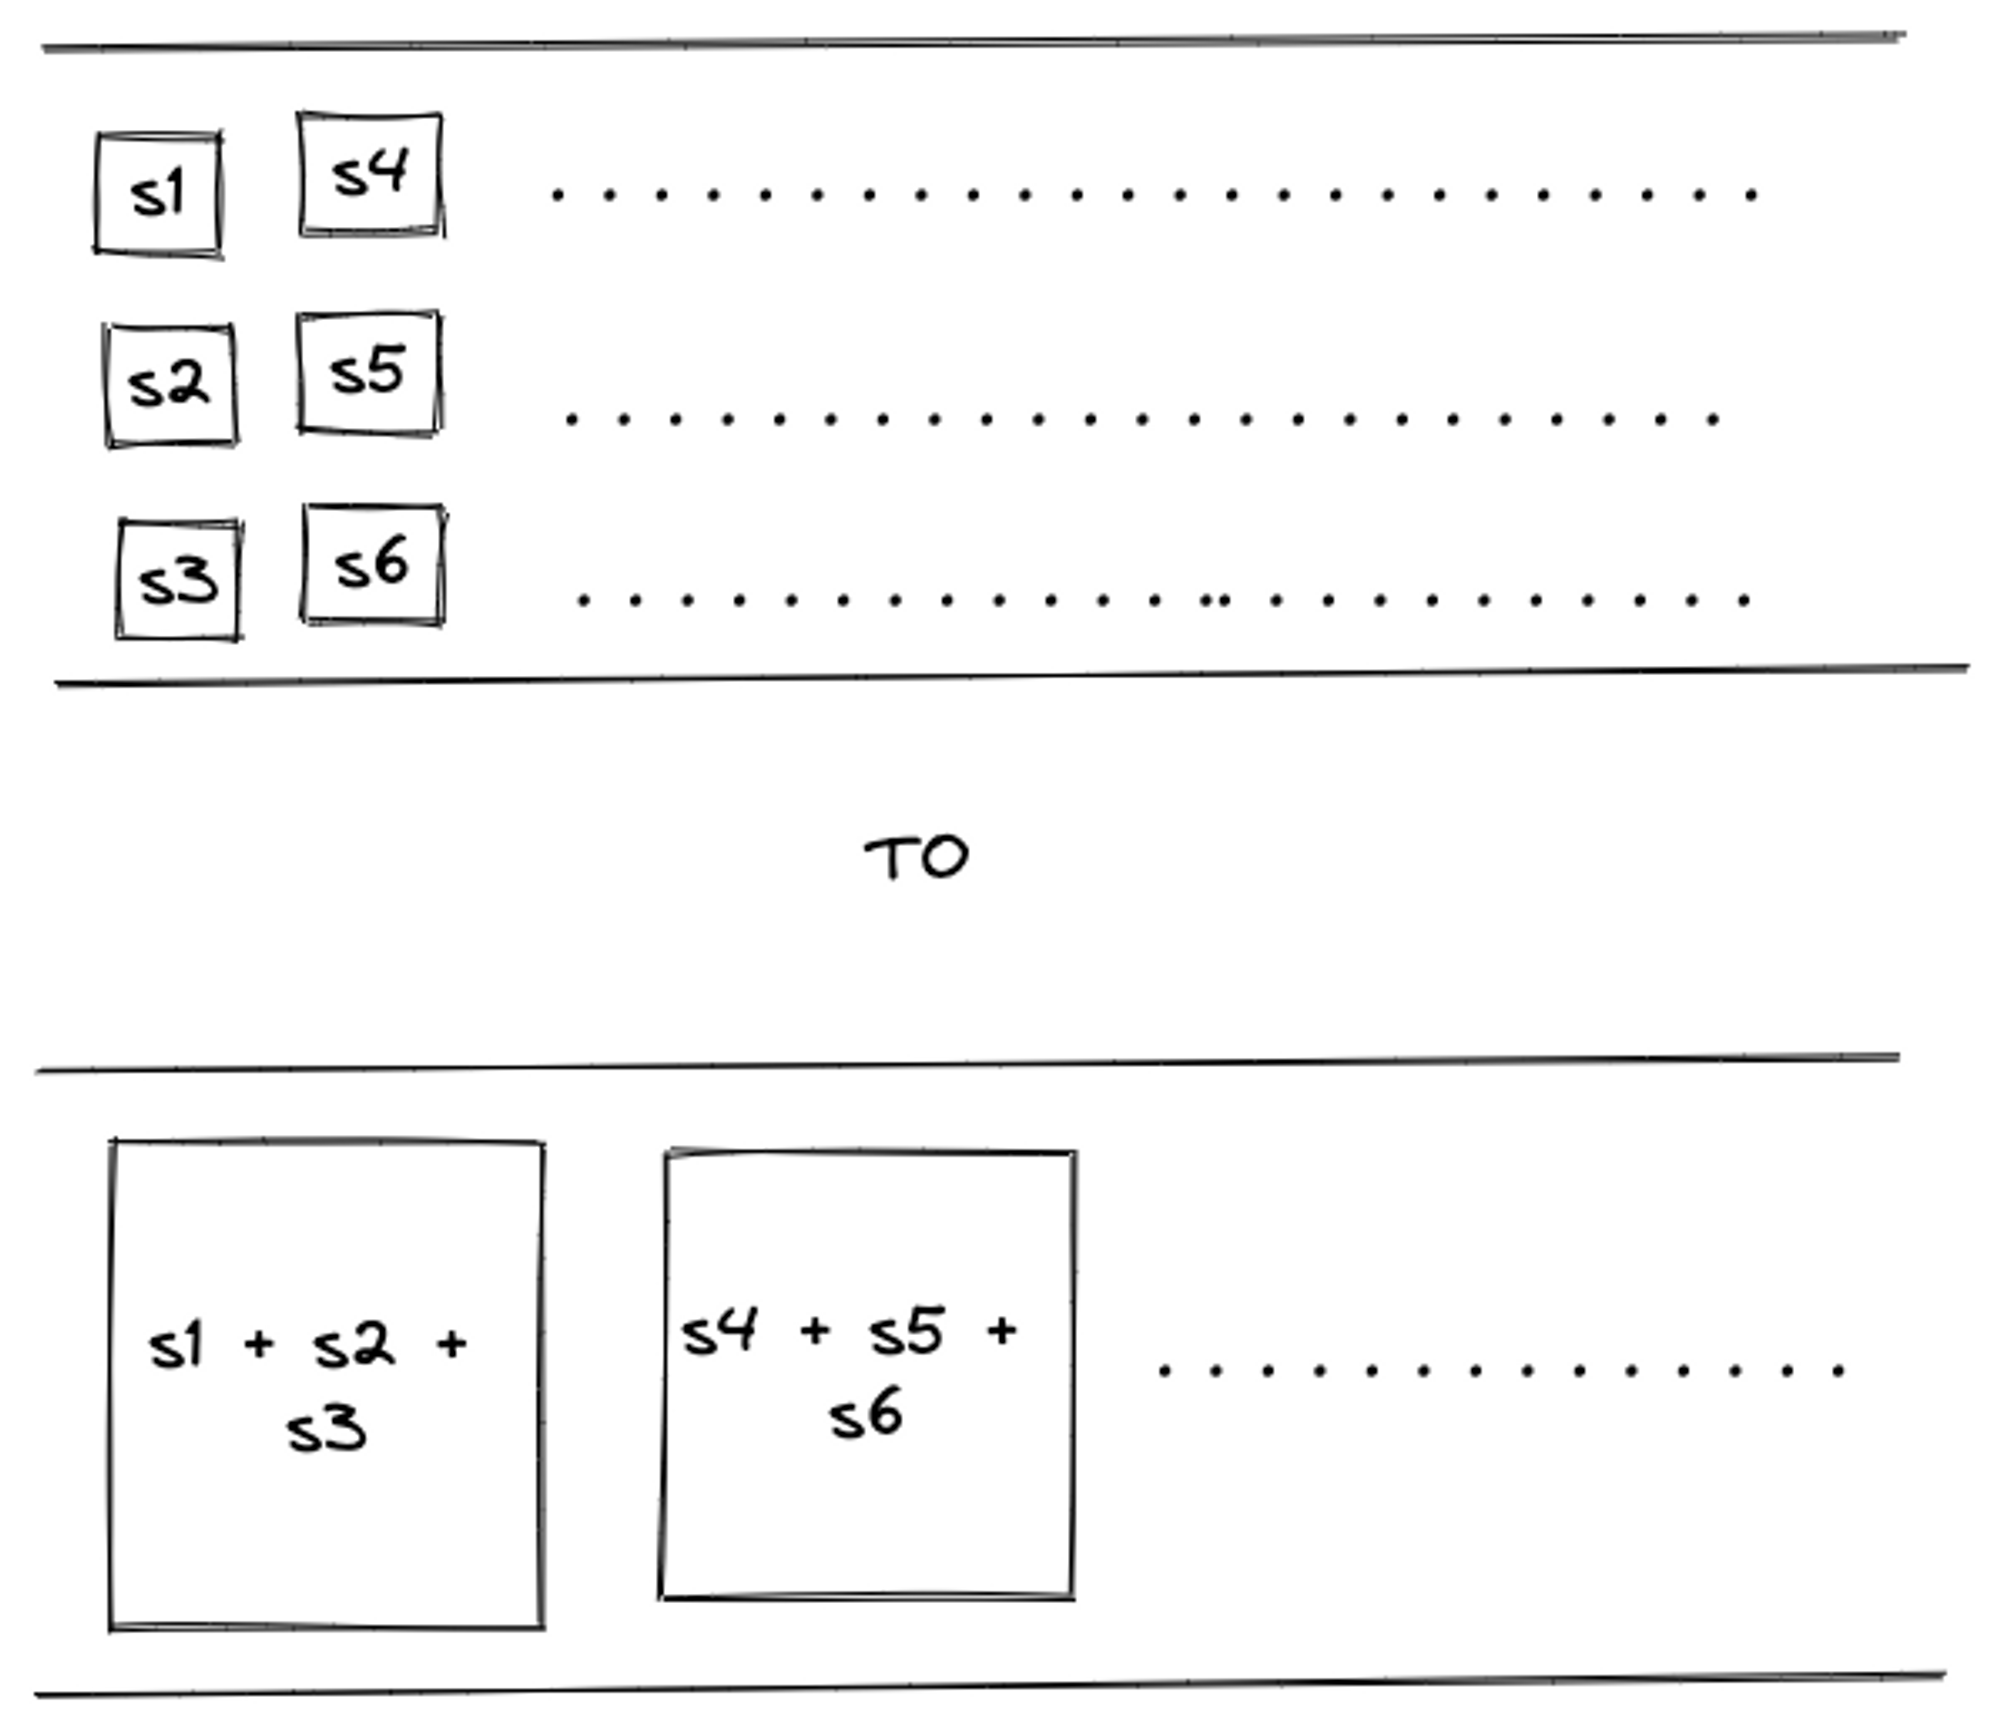
To illustrate the need, we wanted to do the following:
Solution
The tunables to achieve this is called out in the Prometheus remote write tuning doc:
max_shards

Max shards configures the maximum number of shards, or parallelism

max_samples_per send

Max samples per send can be adjusted depending on the backend in use.
Many systems work very well by sending more samples per batch without a
significant increase in latency
as well as in Grafana’s remote writing tuning post:
capacity

You can increase this value to increase the throughput of each shard or
increase this value while reducing max shards to attempt to get the same
throughput for less network overhead.
Let us try to understand this better.
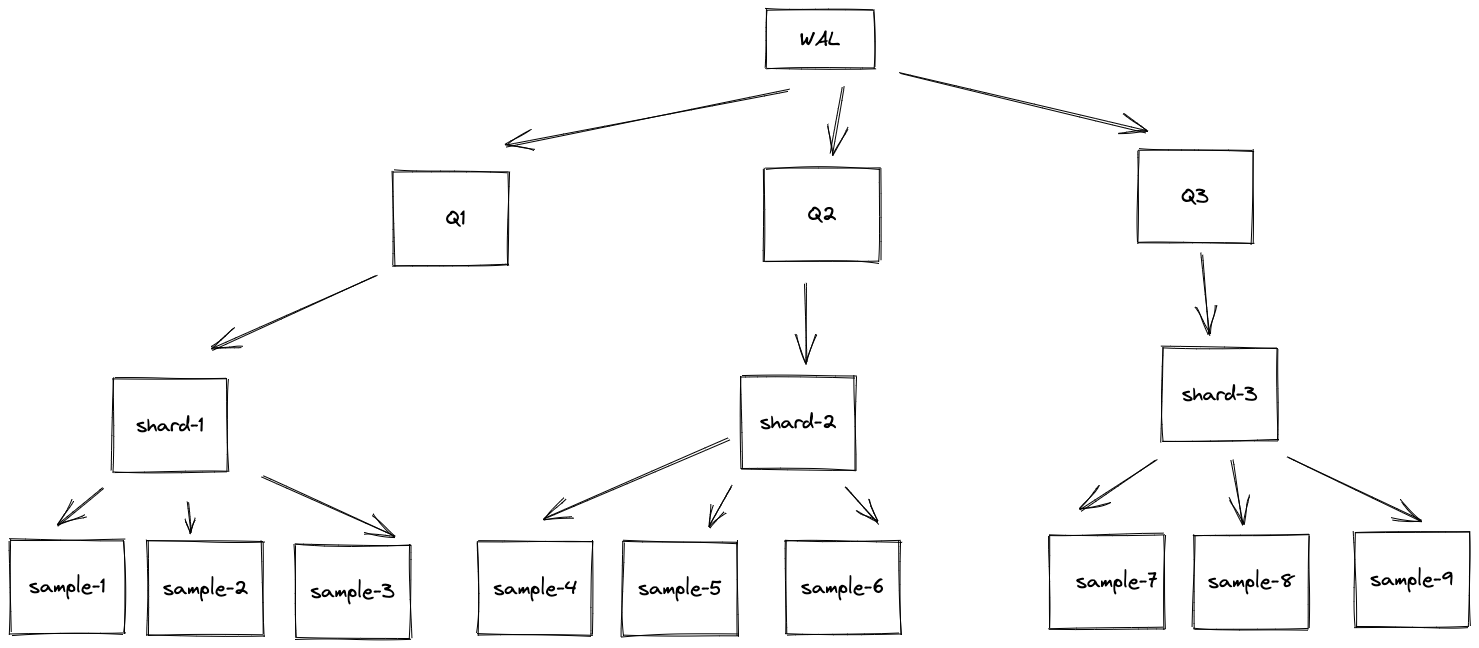
- Write ahead log writes to multiple queues - Q1, Q2, Q3, etc.
- Queues have shards - sample-1, sample-2, etc.
- Shards have metric samples - sample1, sample2, sample3, etc.
capacitycontrols shard memory queue size per shard.max_samples_per_sendcontrol batch size of a single remote write.max_shardscontrols how many batches are sent in parallel.
Reducing max_shards will reduce the concurrency and increase capacity and max_samples_per_send will increase the packet size, thereby balancing throughput.
There is one more vital factor to consider - how tuning these parameters has an impact on the sender’s memory. As we are tuning queue size and remote write batch size, we are playing with what is held in memory. This is clearly explained here
Shard memory is proportional to the number of
shards * (capacity + max_samples_per_send).
When tuning, consider reducing max_shards alongside increases to
capacity and max_samples_per_send to avoid inadvertently running out of memory.

The default values for capacity: 2500 and max_samples_per_send:
500 will constrain shard memory usage to less than 500 kB per shard
Let us tweak these numbers and see the impact on memory:
| Sr. No. | Metric name | default | suggested change |
|---|---|---|---|
| 1. | capacity | 2500 | 5000 |
| 2. | max_shards | 200 | 100 |
| 3. | max_samples_per_send | 500 | 1000 |
| 4. | max_shards * (capacity + max_sampler_per_send) | 600,000 | 600,000 |
We reduced parallelism (max_shards) and increased payload size (capacity and max_samples_per_send ) without impacting memory utilization - 600,000 =~ 500 KB in both cases.
We did the change and achieved the same throughput with reduced network overhead.
Fin. Nope! This is where it gets interesting.
Don’t take my word for it. Let’s create a docker-compose setup which actually does this scenario.
Last9spin
Demo setup
Clone https://github.com/saurabh-hirani/prometheus-remote-write-tuning-parallelism
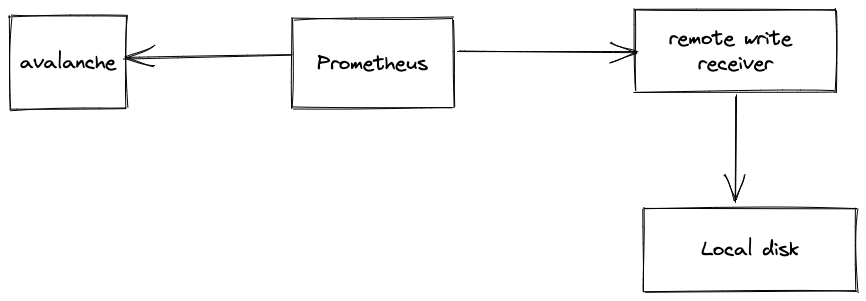
This docker-compose setup contains
avalanchecontainer to generate random metrics.prometheuscontainer to scrape metrics generated by avalanche.remote-write-receivercontainer to accept remote write requests and dump. the requests received in the first minute to the local disk.
Default config demo
./run.sh default
This uses prometheus.yaml.default which has the following remote write queue config
queue_config:
  max_shards: 200
  capacity: 2500
  max_samples_per_send: 500
After a minute’s worth of running, you will see the following output
prometheus-remote-write-to-local-server-remote-write-receiver-1 | count=30 time_spent=58.449963443s file=remote-write-output-20221127152315-30Check ./output/default
# Total number of files created
# Indicative of max_shards
$ ls | wc -l
55

# Total size of directory
# Indicative of throughput
$ du -sh .
1.1 MB

# Average size of each file
# Indicative of max_samples_per_send and capacity
echo "scale=2; $(du -sb . | awk '{ print $1 }') /  $(ls | wc -l) / 1024" | bc
15.93- With the default config, a minute's worth of remote write sent total samples of 1.1 MB, divided amongst 55 requests each of an average size of 15.93 KB.
Updated config demo
./run.sh updated
This uses prometheus.yaml.updated which has the following remote write queue config
queue_config:
  max_shards: 100
  capacity: 5000
  max_samples_per_send: 1000
After a minute’s worth of running, you will see the following output
prometheus-remote-write-to-local-server-remote-write-receiver-1 | count=30 time_spent=58.16556336s file=remote-write-output-20221127154905-30Check ./output/updated
# Total number of files created
# Indicative of max_shards
$ ls | wc -l
30

# Total size of directory
# Indicative of throughput
$ du -sh .
960K

# Average size of each file
# Indicative of max_samples_per_send and capacity
echo "scale=2; $(du -sb . | awk '{ print $1 }') /  $(ls | wc -l) / 1024" | bc
29.00- With the updated config, a minute's worth of remote write sent total samples of 960 KB, divided amongst 30 requests each of an average size of 29 KB.
Conclusion
| Sr. No. | Description | default config | updated config |
|---|---|---|---|
| 1. | Total files | 55 | 30 |
| 2. | Total directory size | 1.1 MB | 960 KB |
| 3. | Average file size | 15 KB | 29 KB |
The updated Prometheus config which doubles capacity and max_samples_per_send plus halves max_shards leads to roughly the same amount of throughput being served in half the number of requests. This reduces network overhead issues as mentioned earlier.
Key Learnings
- Don’t just do something - stand there! - think about the problem at hand. Throwing resources at a problem without understanding the underlying cause is both easy and dangerous.
- Managed services need to be managed - working with customers to fine-tune their remote write settings, reducing cardinality explosion, etc. are extremely important parts of your onboarding cycle. Installing the latest observability fad will not give you extra 9s in your reliability - similarly, blindly opening your flood gates to managed TSDBs without knowing your tunables will lead to unknown problems.
- Demo setups ftw! - in absence of live production traffic, if you can create a demo setup to crunch those numbers, invest that time. You never know which new thing you will learn.
- Exposing the right system tunables requires a lot of thought and rigour. Hat tip to the Prometheus team for doing a great job of it!

