


The NVIDIA DCGM Exporter turns GPU telemetry into Prometheus metrics. It reads data through NVIDIA’s Data Center GPU Manager (DCGM), serves it on port 9400 at /metrics, and covers utilization, memory, temperature, power, XID errors and profiling counters. You run it as a container or a Kubernetes DaemonSet, choose metrics with a CSV file, and add -k to label each GPU with the pod that is using it.
This guide covers installation, the metrics to collect, why DCGM_FI_DEV_GPU_UTIL alone is misleading, how to turn on profiling metrics, Kubernetes pod mapping, and alert rules. Flags, defaults and metric names come from the official dcgm-exporter repository and NVIDIA’s DCGM documentation, which now holds the install and command reference.
What is the NVIDIA DCGM Exporter?
The DCGM Exporter is NVIDIA’s open-source Prometheus exporter for data center GPUs. Its repository describes it as an “NVIDIA GPU metrics exporter for Prometheus leveraging DCGM.”
DCGM is NVIDIA’s management and monitoring layer for data center GPUs. It reads hardware counters through the driver and adds features such as health checks and profiling metrics. The exporter wraps those readings in the Prometheus text format so Prometheus, or any backend that scrapes Prometheus endpoints, can collect them.
Teams use it to answer questions that nvidia-smi answers for one machine at a time:
- Which GPUs in the cluster are busy, idle or close to running out of memory?
- Are any GPUs overheating, throttling or reporting hardware errors?
- Which pod, team or training job is using each GPU?
For a vendor-neutral view of which GPU signals matter and why, see our guide to the GPU metrics that matter.
How do you install the DCGM Exporter?
The exporter needs a Linux host with a supported NVIDIA GPU and driver. The official container image already includes DCGM.
Docker. NVIDIA’s install guide runs the exporter with access to every GPU and publishes port 9400. This uses the current release tag:
docker run -d --gpus all --cap-add SYS_ADMIN --rm -p 9400:9400 \ nvcr.io/nvidia/k8s/dcgm-exporter:4.6.0-4.8.3-distrolessCheck that it works with curl localhost:9400/metrics. You should see lines like these, one per GPU:
DCGM_FI_DEV_SM_CLOCK{gpu="0",UUID="GPU-604ac76c-d9cf-fef3-62e9-d92044ab6e52"} 139DCGM_FI_DEV_MEM_CLOCK{gpu="0",UUID="GPU-604ac76c-d9cf-fef3-62e9-d92044ab6e52"} 405Kubernetes with Helm. NVIDIA publishes a chart that deploys the exporter as a DaemonSet on GPU nodes:
helm repo add gpu-helm-charts https://nvidia.github.io/dcgm-exporter/helm-chartshelm repo updatehelm install dcgm-exporter gpu-helm-charts/dcgm-exporter \ --namespace gpu-monitoring \ --create-namespaceIf your cluster uses the NVIDIA GPU Operator, it can deploy the exporter for you, so check whether one is already running before you install a second copy.
Prometheus scrape config. Point a job at port 9400 on each GPU node:
scrape_configs: - job_name: dcgm scrape_interval: 30s static_configs: - targets: ["gpu-node-1:9400", "gpu-node-2:9400"]In Kubernetes, use a ServiceMonitor or pod discovery instead of static targets.
Which DCGM Exporter flags matter?
Each flag has an environment variable equivalent, which is easier to set in a container spec. These are the ones most setups touch, with the defaults from NVIDIA’s command-line reference:
| Flag | Environment variable | Default | What it does |
|---|---|---|---|
-f, --collectors | DCGM_EXPORTER_COLLECTORS | /etc/dcgm-exporter/default-counters.csv | CSV file listing the metrics to collect |
-a, --address | DCGM_EXPORTER_LISTEN | :9400 | HTTP listen address |
-c, --collect-interval | DCGM_EXPORTER_INTERVAL | 30000 (milliseconds) | How often DCGM collects values |
-k, --kubernetes | DCGM_EXPORTER_KUBERNETES | false | Map metrics to Kubernetes pods |
-d, --devices | DCGM_EXPORTER_DEVICES_STR | f | Which GPUs and GPU instances to monitor |
-r, --remote-hostengine-info | DCGM_REMOTE_HOSTENGINE_INFO | Embedded mode | Connect to a separate DCGM host engine |
--web-config-file | DCGM_EXPORTER_WEB_CONFIG_FILE | Unset | TLS and authentication settings |
The collection interval matters for your scrape config. With the 30 second default, scraping every 10 seconds returns the same value three times. Match the scrape interval to the collection interval, or lower DCGM_EXPORTER_INTERVAL if you need finer resolution.
Which DCGM metrics should you collect?
The default CSV enables a useful starting set. These are the metrics most teams chart and alert on:
| Metric | Type | Description from the default CSV |
|---|---|---|
DCGM_FI_DEV_GPU_UTIL | gauge | GPU utilization (in %) |
DCGM_FI_DEV_MEM_COPY_UTIL | gauge | Memory utilization (in %) |
DCGM_FI_DEV_FB_USED | gauge | Framebuffer memory used (in MiB) |
DCGM_FI_DEV_FB_FREE | gauge | Framebuffer memory free (in MiB) |
DCGM_FI_DEV_GPU_TEMP | gauge | GPU temperature (in C) |
DCGM_FI_DEV_MEMORY_TEMP | gauge | Memory temperature (in C) |
DCGM_FI_DEV_POWER_USAGE | gauge | Power draw (in W) |
DCGM_FI_DEV_SM_CLOCK | gauge | SM clock frequency (in MHz) |
DCGM_FI_DEV_XID_ERRORS | gauge | Value of the last XID error encountered |
DCGM_FI_DEV_PCIE_REPLAY_COUNTER | counter | Total number of PCIe retries |
DCGM_FI_DEV_UNCORRECTABLE_REMAPPED_ROWS | counter | Number of remapped rows for uncorrectable errors |
DCGM_FI_DEV_ROW_REMAP_FAILURE | gauge | Whether remapping of rows has failed |
DCGM_FI_PROF_GR_ENGINE_ACTIVE | gauge | Ratio of time the graphics engine is active |
DCGM_FI_PROF_PIPE_TENSOR_ACTIVE | gauge | Ratio of cycles the tensor (HMMA) pipe is active |
DCGM_FI_PROF_DRAM_ACTIVE | gauge | Ratio of cycles the device memory interface is active sending or receiving data |
DCGM_FI_DEV_FB_USED and DCGM_FI_DEV_FB_FREE together give memory pressure. Divide used by the sum of used and free to get the fraction of GPU memory in use, which is the number that predicts out-of-memory errors in training and inference.
Why is DCGM_FI_DEV_GPU_UTIL misleading?
DCGM_FI_DEV_GPU_UTIL is the metric most dashboards lead with, and it is the one most likely to mislead. NVIDIA’s NVML reference defines it as the “percent of time over the past sample period during which one or more kernels was executing on the GPU.”
That definition measures time, not capacity. A GPU running one small kernel that uses a handful of its streaming multiprocessors (SMs) reports 100% utilization, the same as a GPU running a large training step that keeps every SM busy. A dashboard showing every GPU at 100% can hide a fleet that is mostly idle inside.
The profiling metrics measure how much of the chip is working. NVIDIA’s DCGM profiling documentation defines SM activity as “the fraction of time at least one warp was active on a multiprocessor, averaged over all multiprocessors,” and says: “A value of 0.8 or greater is necessary, but not sufficient, for effective use of the GPU. A value less than 0.5 likely indicates ineffective GPU usage.”
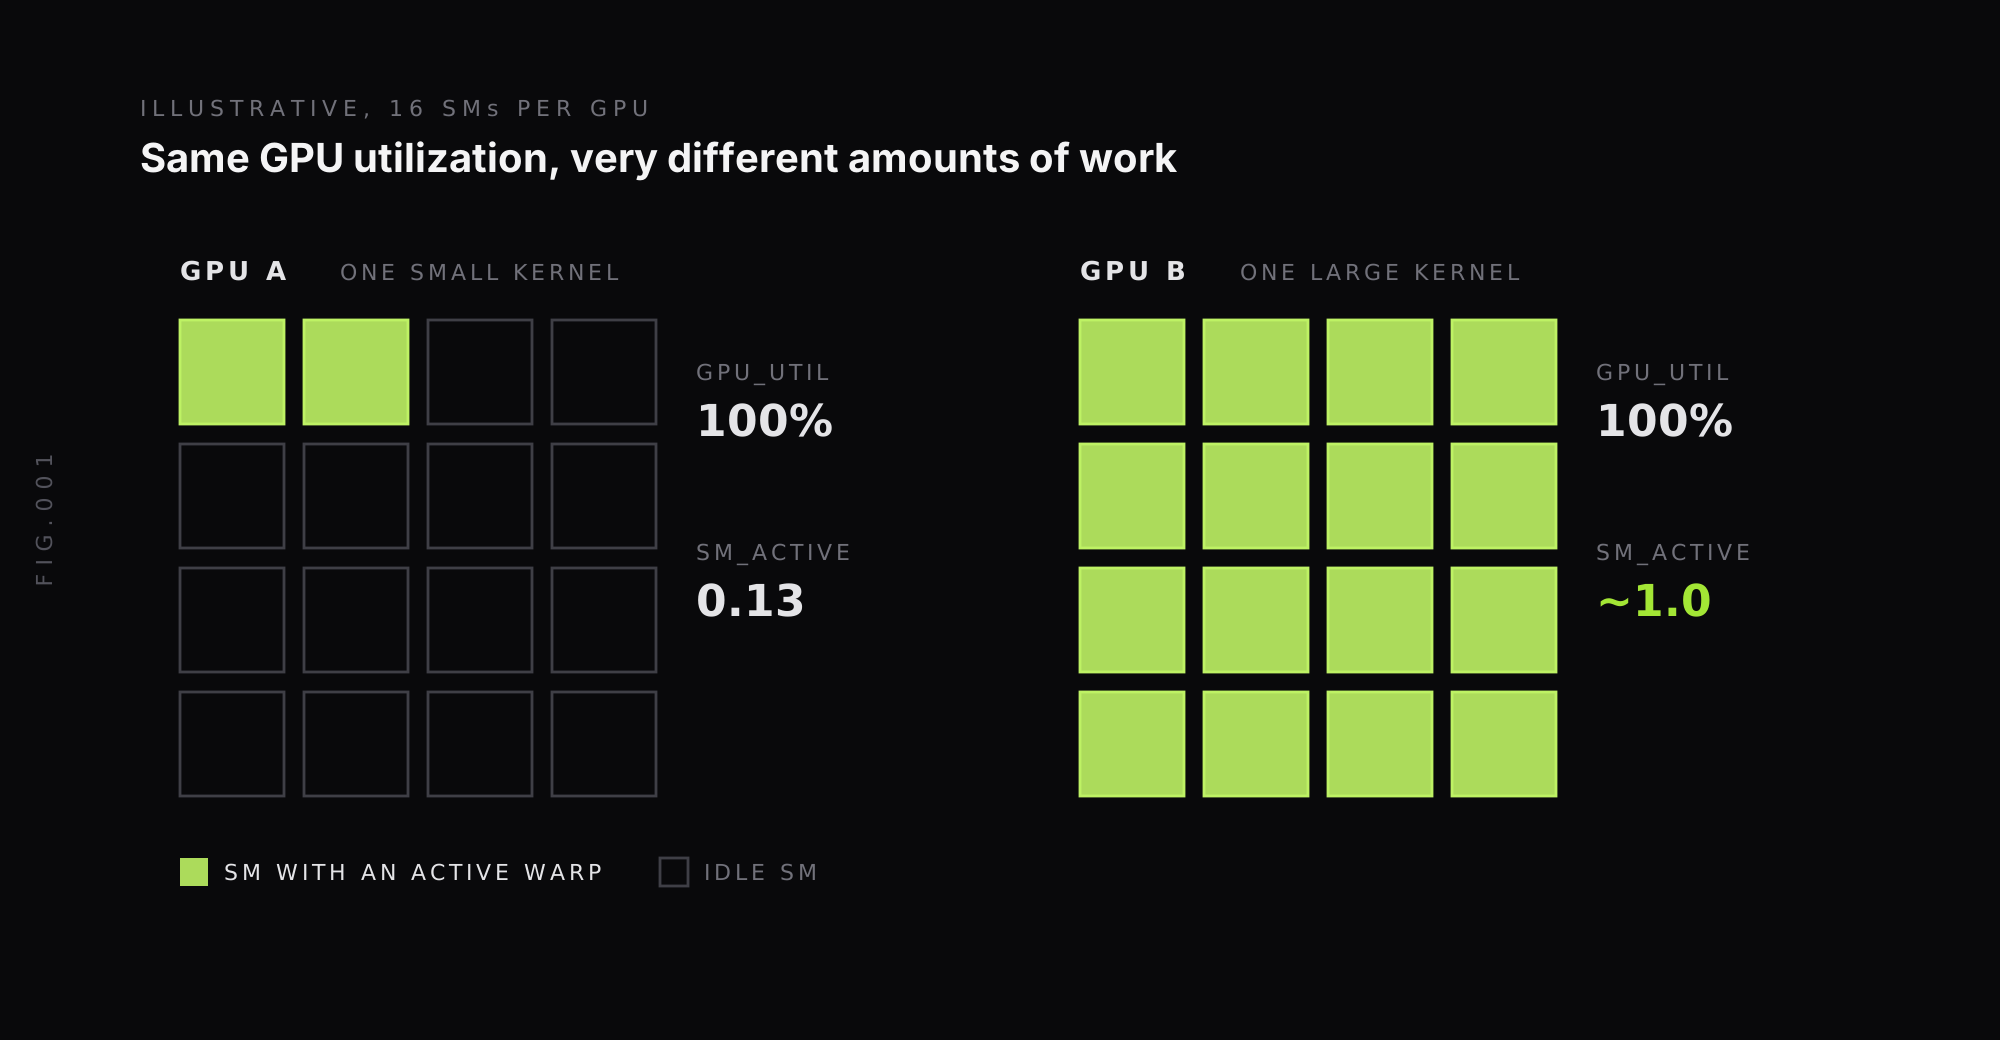
For capacity planning and cost questions, chart DCGM_FI_PROF_SM_ACTIVE or DCGM_FI_PROF_GR_ENGINE_ACTIVE next to utilization, and add DCGM_FI_PROF_PIPE_TENSOR_ACTIVE for deep learning workloads that should be using tensor cores.
How do you enable DCGM profiling metrics?
Some useful profiling metrics ship disabled. In the default CSV, DCGM_FI_PROF_SM_ACTIVE, DCGM_FI_PROF_SM_OCCUPANCY and the FP64, FP32 and FP16 pipe metrics are commented out. To turn them on, create your own CSV in the same three-column format:
# field name, Prometheus type, help textDCGM_FI_DEV_GPU_UTIL, gauge, GPU utilization (in %).DCGM_FI_DEV_FB_USED, gauge, Framebuffer memory used (in MiB).DCGM_FI_DEV_FB_FREE, gauge, Framebuffer memory free (in MiB).DCGM_FI_DEV_GPU_TEMP, gauge, GPU temperature (in C).DCGM_FI_DEV_POWER_USAGE, gauge, Power draw (in W).DCGM_FI_DEV_XID_ERRORS, gauge, Value of the last XID error encountered.DCGM_FI_PROF_GR_ENGINE_ACTIVE, gauge, Ratio of time the graphics engine is active.DCGM_FI_PROF_SM_ACTIVE, gauge, The ratio of cycles an SM has at least 1 warp assigned.DCGM_FI_PROF_PIPE_TENSOR_ACTIVE, gauge, Ratio of cycles the tensor (HMMA) pipe is active.DCGM_FI_PROF_DRAM_ACTIVE, gauge, Ratio of cycles the device memory interface is active sending or receiving data.Point the exporter at it with -f /etc/dcgm-exporter/custom-counters.csv or DCGM_EXPORTER_COLLECTORS. In Kubernetes, store the file in a ConfigMap and mount it into the exporter pods.
Three points from NVIDIA’s documentation matter before you add more:
- Not every profiling metric can be read at once. The DCGM docs explain that some metrics need multiple passes, so only certain groups can be read together. DCGM multiplexes by sampling groups in turn, so adding many profiling fields lowers the accuracy of each one.
- GPU model matters. Profiling field support varies by GPU, so check NVIDIA’s DCGM profiling documentation for your model before you rely on a field.
- Tensor activity is a blend. NVIDIA’s docs explain that a tensor activity of 0.2 could mean 20% of SMs fully busy or every SM 20% busy, so read it as an average, not a per-SM figure.
How do you map GPU metrics to Kubernetes pods?
Without pod mapping, every metric is labelled by GPU index and UUID, which tells you that GPU 3 on a node is busy but not who is using it. Running the exporter with -k, or setting DCGM_EXPORTER_KUBERNETES=true, maps metrics to Kubernetes pods. The exporter reads which pod has each GPU allocated from the kubelet’s pod-resources information and adds pod, namespace and container labels.
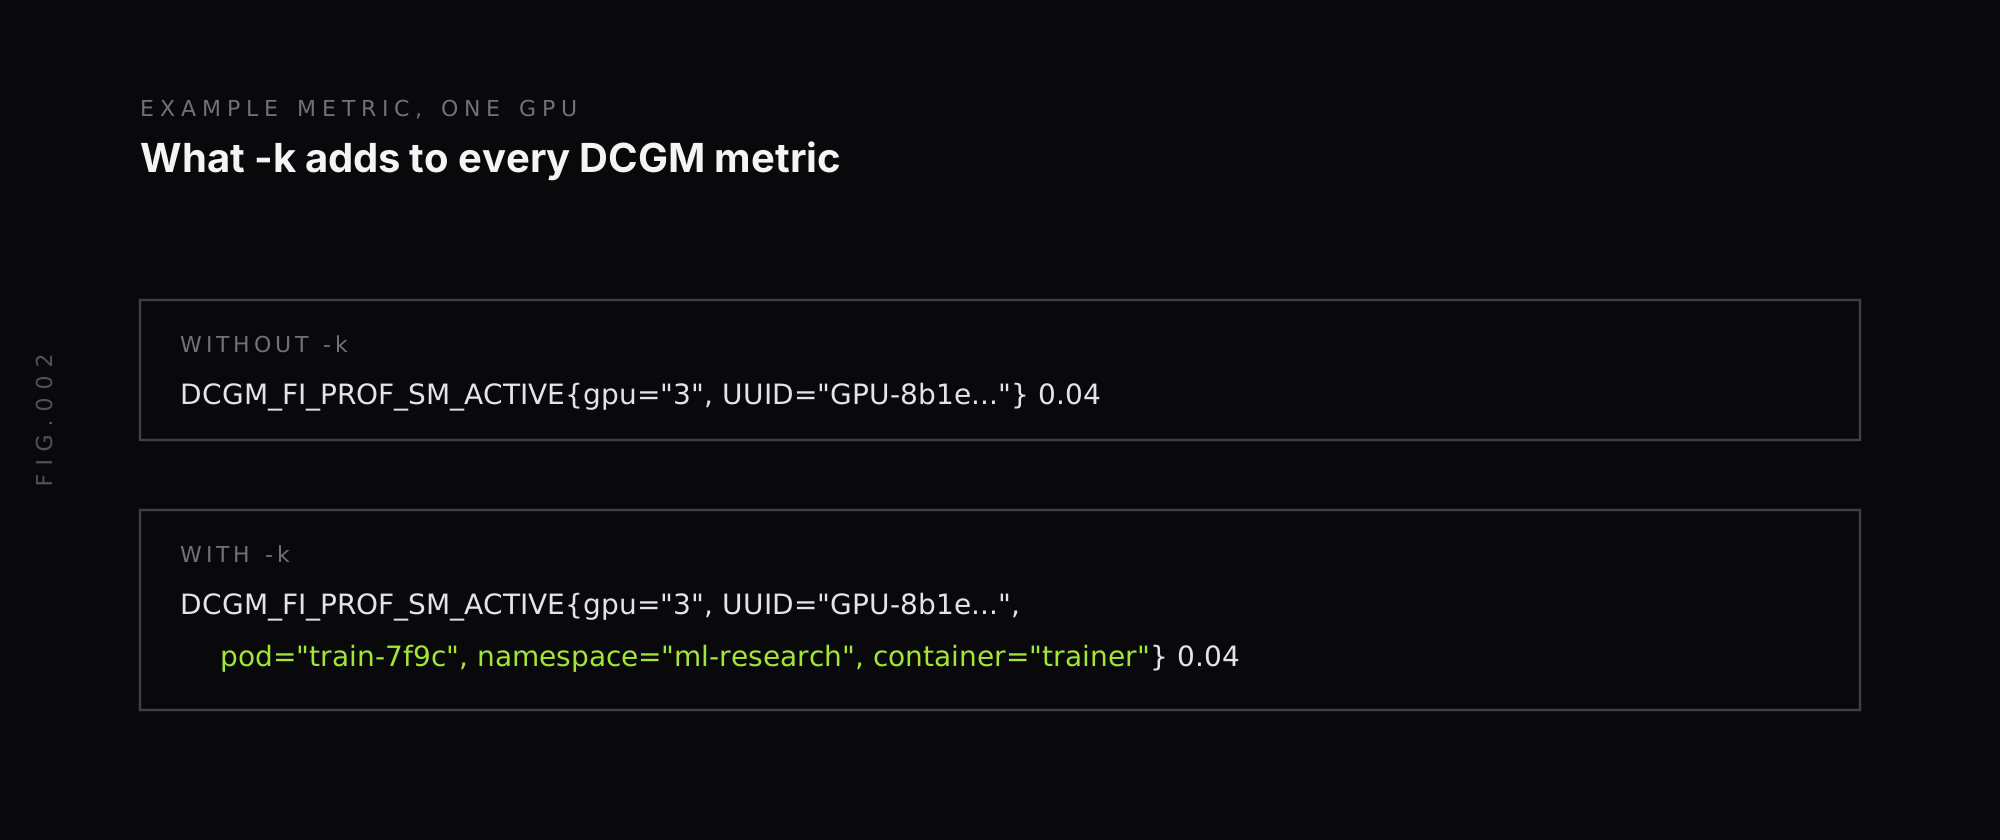
With those labels, per-team and per-job questions become simple PromQL:
# Average SM activity by namespaceavg by (namespace) (DCGM_FI_PROF_SM_ACTIVE)
# GPUs allocated to a pod but doing almost no workDCGM_FI_PROF_SM_ACTIVE{pod!=""} < 0.1
The second query is often the most valuable one in a GPU cluster. It finds GPUs that a scheduler has handed to a workload that is not using them, which is capacity no other job can claim.
Pod mapping covers Kubernetes only. Slurm jobs and other schedulers need their own attribution, and GPUs from other vendors need other exporters. Our 8 layers of GPU observability post explains why the link between a GPU and the workload on it is the hardest part to get right.
What alert rules should you set for DCGM metrics?
Start with rules for failures and memory pressure. They catch the problems that kill jobs, and they do not depend on workload-specific tuning:
groups:  - name: gpu    rules:      - alert: GPUXidError        expr: DCGM_FI_DEV_XID_ERRORS > 0        for: 1m        labels:          severity: critical        annotations:          summary: "GPU {{ $labels.gpu }} on {{ $labels.instance }} reported XID {{ $value }}"
      - alert: GPURowRemapFailure        expr: DCGM_FI_DEV_ROW_REMAP_FAILURE == 1        labels:          severity: critical        annotations:          summary: "GPU {{ $labels.gpu }} failed to remap memory rows"
      - alert: GPUMemoryNearlyFull        expr: DCGM_FI_DEV_FB_USED / (DCGM_FI_DEV_FB_USED + DCGM_FI_DEV_FB_FREE) > 0.95        for: 10m        labels:          severity: warning        annotations:          summary: "GPU {{ $labels.gpu }} memory is over 95% used"
      - alert: GPUAllocatedButIdle        expr: DCGM_FI_PROF_SM_ACTIVE{pod!=""} < 0.1        for: 30m        labels:          severity: info        annotations:          summary: "{{ $labels.namespace }}/{{ $labels.pod }} holds a GPU but uses almost none of it"
The 95% memory and 0.1 SM activity thresholds are examples to tune for your workloads. For temperature and power, set thresholds from the specifications of your GPU model rather than a generic number, since safe ranges differ between cards. Route critical and informational alerts to different receivers in Alertmanager, so an idle-GPU notice opens a ticket instead of paging someone.
How does Last9 fit with the DCGM Exporter?
We are Prometheus-compatible, so DCGM Exporter metrics can be sent to Last9 with Prometheus remote write and queried with the same PromQL used above. Labels such as pod, namespace and GPU UUID stay on the metrics, so per-workload breakdowns keep working as GPU fleets grow.
We also built l9gpu, an open-source GPU telemetry agent for teams that need more than DCGM covers. It reads NVIDIA GPUs through NVML and DCGM, AMD GPUs through amdsmi and Intel Gaudi through hl-smi, and exports metrics in OpenTelemetry’s gpu.* namespace.
Every l9gpu metric carries GPU identity (gpu.uuid, gpu.model, gpu.vendor) and workload attribution such as k8s.pod.name, k8s.namespace.name and slurm.job.id. It runs as a DaemonSet in Kubernetes or a systemd unit on Slurm nodes, and sends data over OTLP to any backend. Our GPU observability page covers per-pod attribution and GPU chargeback by namespace.
Measure how much of each GPU is working
The DCGM Exporter is the standard way to get NVIDIA GPU metrics into Prometheus. Install it with Docker or Helm, scrape port 9400, and match your scrape interval to its 30 second collection interval. Then go beyond the defaults: enable DCGM_FI_PROF_SM_ACTIVE so dashboards show how much of each GPU is working, and turn on -k so every metric names the pod using the GPU.
Start with alerts for XID errors, row remap failures and memory pressure, then add an idle-GPU rule once pod labels are in place. When you need GPU metrics across vendors and schedulers with workload attribution built in, l9gpu and Last9 cover that layer.
FAQ
What is the NVIDIA DCGM Exporter?
The NVIDIA DCGM Exporter is an open-source Prometheus exporter from NVIDIA that reads GPU telemetry through the Data Center GPU Manager (DCGM) and serves it on an HTTP /metrics endpoint, port 9400 by default. It exposes metrics such as GPU utilization, memory used, temperature, power draw, XID errors and profiling counters, and it can label each metric with the Kubernetes pod that is using the GPU.
What port does the DCGM Exporter use?
The DCGM Exporter listens on port 9400 by default and serves metrics at /metrics. The listen address is set with the —address flag or the DCGM_EXPORTER_LISTEN environment variable, both of which default to :9400.
What is the difference between DCGM_FI_DEV_GPU_UTIL and DCGM_FI_PROF_SM_ACTIVE?
DCGM_FI_DEV_GPU_UTIL reports the percent of time one or more kernels was running on the GPU, so a single small kernel can push it to 100%. DCGM_FI_PROF_SM_ACTIVE reports the fraction of time at least one warp was active on each streaming multiprocessor, averaged across all of them, which shows how much of the GPU’s compute is in use. NVIDIA’s DCGM documentation says an SM activity value below 0.5 likely indicates ineffective GPU usage.
How do I add custom metrics to the DCGM Exporter?
The DCGM Exporter reads the list of metrics to collect from a three-column CSV file of field name, Prometheus type and help text. The default file is /etc/dcgm-exporter/default-counters.csv. To change it, copy the file, uncomment or add DCGM fields such as DCGM_FI_PROF_SM_ACTIVE, and point the exporter at the new file with the -f flag or the DCGM_EXPORTER_COLLECTORS environment variable. In Kubernetes, the custom file is usually mounted from a ConfigMap.
How does the DCGM Exporter map GPU metrics to Kubernetes pods?
When the DCGM Exporter runs with the -k flag, or DCGM_EXPORTER_KUBERNETES set to true, it maps GPU metrics to Kubernetes pods using the kubelet’s pod-resources information. Each GPU metric then carries pod, namespace and container labels for the workload that has that GPU allocated, which makes it possible to break GPU usage down by team or job.
How often does the DCGM Exporter collect metrics?
The DCGM Exporter collects GPU metrics every 30,000 milliseconds, or 30 seconds, by default. The interval is set with the —collect-interval flag or the DCGM_EXPORTER_INTERVAL environment variable, in milliseconds. A Prometheus scrape interval shorter than the collection interval returns the same values more than once.


