

The p99 alert for checkout fires. The metric tells you which service is slow and since when. It does not tell you why. The cause is in a trace you have not opened and a log line you have not found, and the two live in different tools.
So you copy a timestamp from the alert, paste it into a log search, filter by service name, and scroll. Detection took seconds. Root cause takes the rest of the incident.
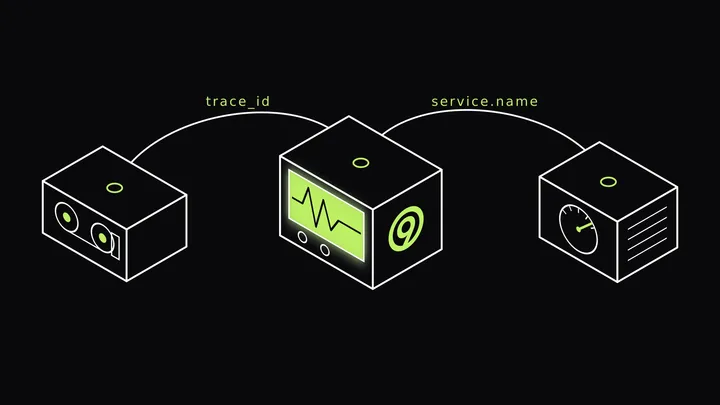
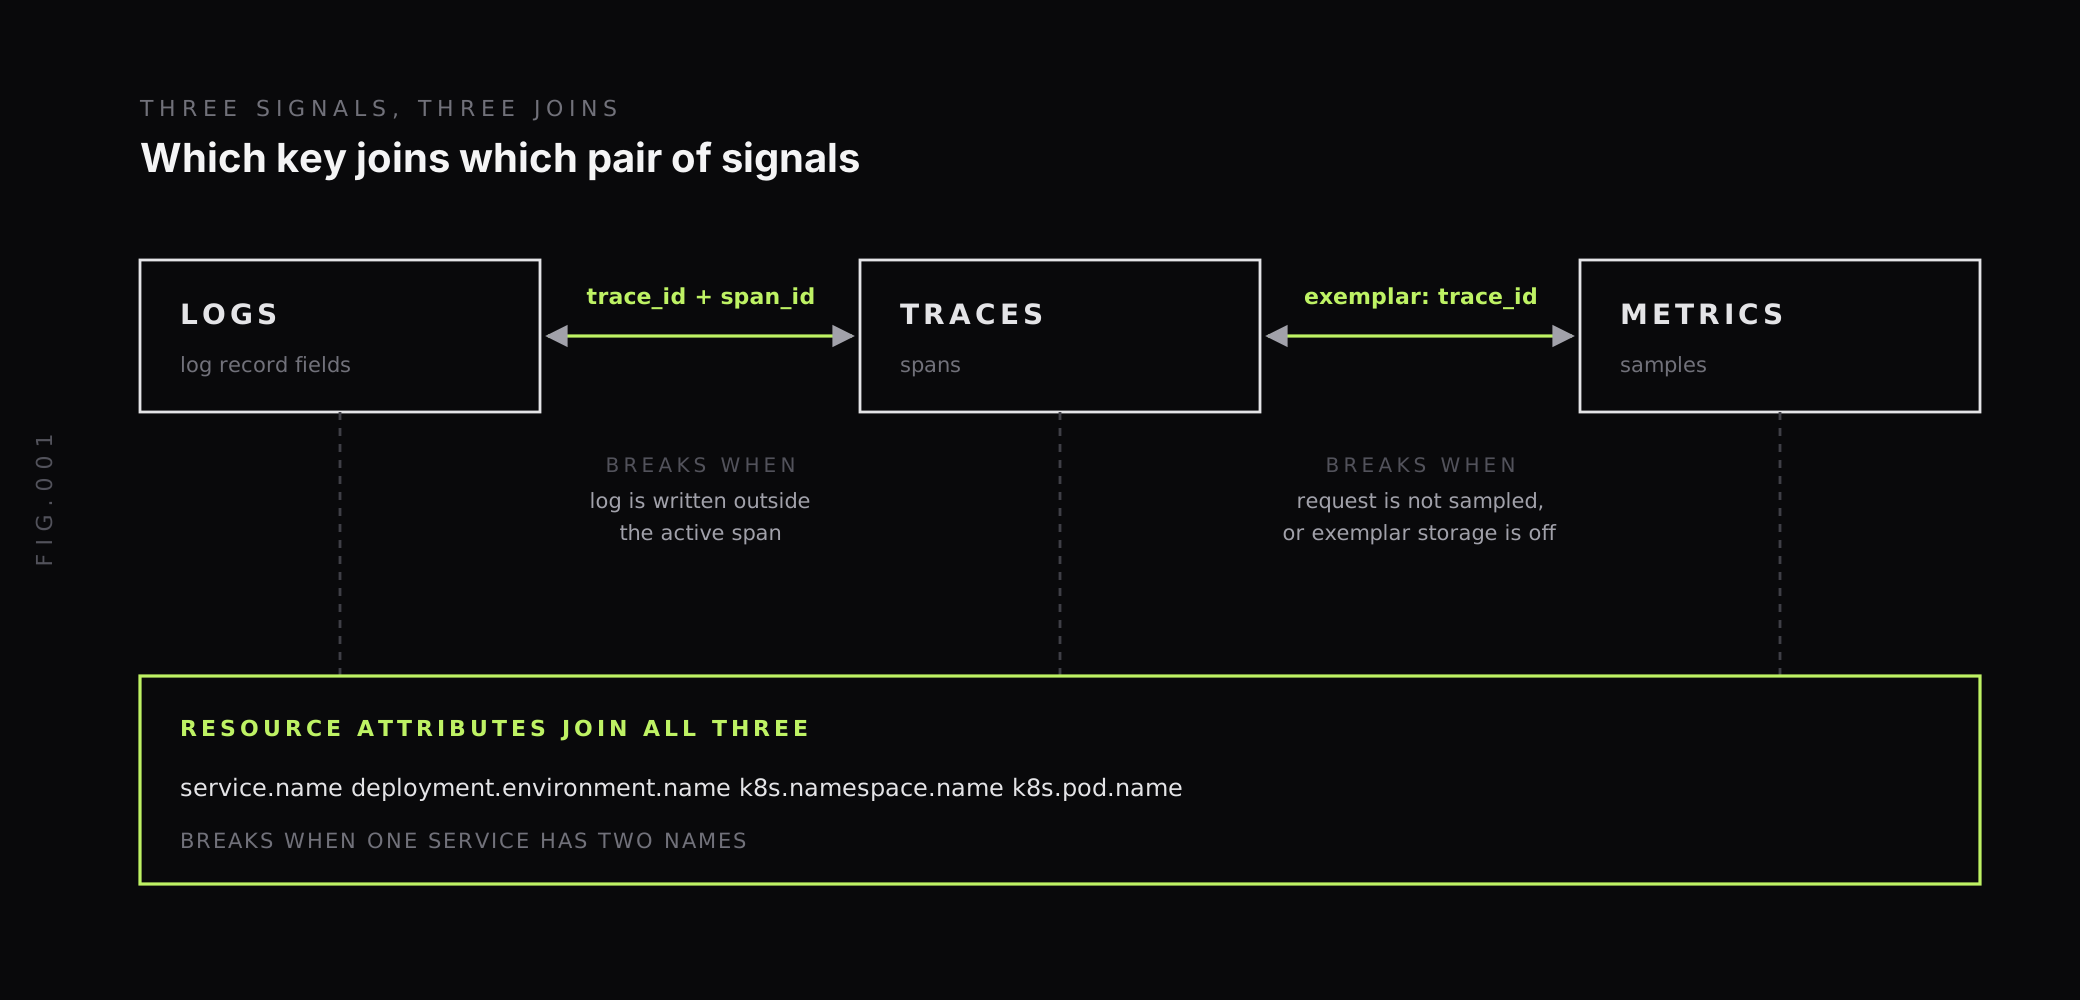
How do you correlate logs, traces and metrics? Put shared keys in the data when it is emitted. Log lines carry the trace_id and span_id of the active span, latency metrics carry exemplars that point at traces, and all three signals carry the same resource attributes, such as service.name. With those in place, root cause is a lookup by key, not a search by timestamp.
The sections below cover those keys, how to put them in place with OpenTelemetry, where they break, and how the pivot looks in Last9.
Why detection is fast and root cause is not
An alert is a threshold on one metric. It is cheap to compute and it fires fast. A cause is a specific request, on a specific instance, doing something specific: waiting on a lock, retrying a downstream call, reading a cold cache.
That evidence is spread across three signals:
- Metrics say the shape of the problem: latency up, errors up, saturation up.
- Traces say which operation in which request was slow.
- Logs say what the code reported while it was slow.
Each signal answers a different question, so you need all three. The slow part is matching them. Without a shared key, the match is a guess: same minute, same service name, similar-looking message. That works on a quiet system and fails on a busy one, where hundreds of requests share the same minute and service.
A shared dashboard does not fix this. A shared key does: if a log line carries the ID of the trace it belongs to, you can find it directly.
The join keys that connect the three signals
OpenTelemetry gives each signal a place to carry identity. Three joins cover almost every pivot you need.
| Join | Key | Where it is set | How it breaks |
|---|---|---|---|
| Log to trace | TraceId, SpanId on the log record | The SDK, when a log is emitted inside an active span | Log written outside a span, or after context is lost |
| Metric to trace | Exemplar with trace_id and span_id | The SDK, from the active span at measurement time | Request not sampled, exemplar storage off, or a metric type with no exemplars |
| Any to any | Resource attributes such as service.name | The SDK resource, or the Collector | Two names for one service, or an attribute missing on one signal |
The OpenTelemetry logs data model defines optional TraceId and SpanId fields on the log record. The trace ID format itself comes from W3C Trace Context, the same standard behind the traceparent header we cover in our post on how traceparent connects your microservices.
Note what is missing from the table: timestamps. They are a fallback, not a key. Clocks drift, and a timestamp matches thousands of unrelated records.
Put trace context into your logs
If you use the OpenTelemetry logging SDK or a log bridge, trace context is added for you when the log is emitted inside a span. Many services still log through the standard library or a framework logger and ship lines with a file tailer. For those, you add the IDs yourself.
In Python, the logging instrumentation can do it. The OpenTelemetry Python docs say to set OTEL_PYTHON_LOG_CORRELATION to true, which makes otelTraceID, otelSpanID and otelServiceName available to your log format:
export OTEL_PYTHON_LOG_CORRELATION=trueIf you would rather own the format, a short logging filter that reads the current span does the same job:
import jsonimport loggingfrom opentelemetry import trace

class TraceContextFilter(logging.Filter):    def filter(self, record):        ctx = trace.get_current_span().get_span_context()        record.trace_id = format(ctx.trace_id, "032x") if ctx.is_valid else ""        record.span_id = format(ctx.span_id, "016x") if ctx.is_valid else ""        return True

class JsonFormatter(logging.Formatter):    def format(self, record):        return json.dumps({            "level": record.levelname,            "msg": record.getMessage(),            "trace_id": record.trace_id,            "span_id": record.span_id,        })

handler = logging.StreamHandler()handler.addFilter(TraceContextFilter())handler.setFormatter(JsonFormatter())logger = logging.getLogger("checkout")logger.setLevel(logging.INFO)logger.addHandler(handler)
Run inside a span, this emits "trace_id": "4bf92f3577b34da6a3ce929d0e0e4736" on the line. Run outside one, it emits an empty string. The hex widths matter: a trace ID is 32 hex characters and a span ID is 16, the same form you see in a trace UI.
In Go, our agent does this for slog and zap. It injects trace_id and span_id when the context passed to the log call holds an active span. The setup is in the Go log-trace correlation docs.
Where trace_id goes missing
Most missing IDs come from three places:
- Logging outside the span. Startup code, shutdown hooks and background threads run with no active span, so the field is empty. That is correct. The fix is to log the request’s events inside the request’s span.
- Context lost at an async hop. A thread pool, a task queue or a message broker drops the current context unless you carry it across. Our guide to OpenTelemetry context propagation covers the carriers.
- A logger that never saw the context. In Go, calling
slog.Infoinstead ofslog.InfoContextpasses no context, so there is nothing to read.
Link metrics to traces with exemplars
A metric aggregates many requests into one number. An exemplar is one real request kept next to that number. In OpenMetrics terms, it is a label set and a value attached to a sample, and the spec’s stated use is “IDs of program traces”.
On a latency histogram, the bucket that holds your slow requests can carry the trace_id of one of them. This is what a scrape looks like in the OpenMetrics text format:
http_server_request_duration_seconds_bucket{le="1.0",service="checkout"} 8 # {trace_id="4bf92f3577b34da6a3ce929d0e0e4736",span_id="00f067aa0ba902b7"} 0.93 1730312040.123The part after the # is the exemplar: a trace, a span, the observed value (0.93 seconds) and a timestamp. Click the bucket on a chart, get a trace that landed in it.
Three things have to be true for that to work:
- The SDK attaches exemplars. The OpenTelemetry metrics SDK decides which measurements can become exemplars with an exemplar filter. The default is
trace_based, which keeps measurements recorded in the context of a sampled span. It is set withOTEL_METRICS_EXEMPLAR_FILTER. - The exposition format carries them. Exemplars are part of OpenMetrics, so the target must be scraped in that format.
- The store keeps them. Prometheus has exemplar storage behind a flag, and it holds exemplars in a fixed-size in-memory circular buffer:
prometheus --enable-feature=exemplar-storageThe buffer size is max_exemplars under storage.exemplars, which the Prometheus configuration reference lists with a default of 100000. The Prometheus feature flag docs describe the storage, and the OpenTelemetry metrics SDK spec describes filters and reservoirs.
The tradeoff: exemplars are sampled
An exemplar is a sample, not a census. A trace_based filter only keeps exemplars from sampled traces, so if your trace sampling rate is low, the slow request you want may have no trace behind it. OpenMetrics allows one exemplar per histogram bucket and caps the exemplar’s label set at 128 UTF-8 characters, which is why only IDs fit there.
Exemplars give you a representative slow request fast. They do not promise that your specific complaint has a trace. For that, you still need the log-to-trace join, which does not depend on sampling the same way.
Keep resource attributes identical across signals
The first two joins link records. The third one links whole services. service.name, deployment.environment.name and the Kubernetes attributes describe where telemetry came from, and a pivot from a trace to the logs of the same pod only works if both signals spell the pod the same way.
Typical mismatches:
checkouton traces andcheckout-serviceon logs, because two teams set the name in two places.deployment.environmenton older SDKs anddeployment.environment.nameon newer ones. OpenTelemetry deprecated the first in favor of the second, so mixed fleets split an environment into two.- A metric pipeline that drops resource attributes, so metrics carry a
joband no environment.
The Collector can stamp an attribute on everything passing through it:
processors: resource: attributes: - key: deployment.environment.name value: production action: upsertMetrics need one more step if you use Prometheus. By default it turns only service.name, service.namespace and service.instance.id into labels (job and instance) and puts the rest on target_info. To filter and group on the others, promote them:
otlp: promote_resource_attributes: - service.instance.id - service.name - deployment.environment.name - k8s.namespace.name - k8s.pod.nameOur post on OpenTelemetry semantic conventions across signals goes through the naming rules in more depth.
A walkthrough: from p99 alert to the failing query
This is an illustrative scenario, not a customer incident. The names and values are made up to show the order of the pivots.
A p99 latency alert fires for checkout in production. Here is the path when the three joins exist.
- Start at the metric. The latency histogram shows the slow requests sit in the 1s bucket and above, and only for
checkout. An exemplar on that bucket points at one trace. If your setup has no exemplars, filter traces forcheckoutslower than one second in the alert window. - Read the trace. The waterfall shows the slow request spends almost all of its time in one child span, a database call. The rest of the request is fast. You now know where, but not why.
- Pivot to its logs. Take the trace’s
trace_idand search logs for it. Among the lines for that request is one atERRORlevel:timeout acquiring connection from pool. The database is not slow. The request waited for a connection. - Check the infrastructure. Open metrics for the same pod and namespace, and look at connection pool and CPU for that instance. If one pod is saturated and its neighbours are not, you have a hot instance. If all are, you have a pool sized too small for the load.
Four steps, three signals, and no timestamp matching. The root cause (pool exhaustion) came from a log line that no metric or trace would have shown. Our post on tracking down the real cause of sudden latency spikes covers this failure mode and others in more detail.
How this looks in Last9
Last9 is OpenTelemetry-native and Prometheus compatible, with PromQL, LogQL and TraceQL for the three signals. The pivots below are the ones our docs describe.
- From a log line. Click a line in Logs Explorer and the Log Details panel opens with Related Logs, Related Traces and Related Metrics tabs. Related Logs shows surrounding lines from the same service, and you can match on service, instance, pod or trace ID. Related Metrics charts CPU and memory for the container, instance and pod.
- From a trace. In Traces Explorer, a span’s context shows its attributes, resource info and related logs.
- From a dashboard. A dashboard panel opens related logs and traces on click when the dashboard has a service variable.
For naming mismatches, Remapping in the Control Plane standardizes service names, environments and other attributes on logs and traces, with no code change or redeploy. It covers logs and traces, so metric attribute names still need fixing at the source or in the Collector.
Some limits matter more than the feature list:
- Pivots depend on your instrumentation. If your logs carry no
trace_id, no tool can join them to a trace by key. - Related Traces is attribute-based. Our docs say it works from the service and other attributes of the selected log line. We do not describe it as an exact trace ID match.
- Exemplars are not covered. Our docs and changelogs say nothing about exemplar links from metric charts to traces, so this post does not claim them. Check your backend before building a workflow around exemplars.
Where to start: five checks for correlatable telemetry
Run these before the next incident, not during it.
- trace_id in logs. Pull recent lines from a service that handles requests. If the field is empty on request logs, fix that service first. In Logs Explorer’s Editor mode, a LogQL query like this counts JSON log lines with no ID. Adjust the label to your field name:
sum(count_over_time({service="checkout"} | json | trace_id="" [5m]))- Matching resource attributes. List the distinct values of
service.nameanddeployment.environment.nameon each signal. One service should have one name. - Propagation across hops. Pick a request that crosses a queue or a thread pool and confirm the downstream span and logs carry the same
trace_id. - Exemplars, if you rely on them. Confirm the SDK filter, the scrape format and the storage flag, then query one exemplar end to end.
- Clock sync. Timestamps are the fallback join. Check that hosts sync to NTP so the fallback is not off by seconds.
If a check fails, fix the key at the source. Correlation added at query time only guesses, and a key written at emit time is a fact. For the underlying vocabulary, our post on trace ID vs correlation ID explains when a trace ID can double as a correlation ID.
FAQ
How do I correlate logs and traces in OpenTelemetry?
Emit each log record inside an active span so it carries the span’s TraceId and SpanId. The OpenTelemetry logs data model defines both as optional fields on the log record. In Python, set OTEL_PYTHON_LOG_CORRELATION to true or add a logging filter that copies the current span context onto the record. Then search your logs by trace_id from any trace.
What is an exemplar and how does it link a metric to a trace?
An exemplar is a reference attached to a metric sample, usually a trace_id and span_id of one request that produced the value. A histogram bucket can carry one, so you can jump from a slow bucket to a trace that landed in it. Exemplars are sampled, so the link points at a representative request, not every request. Prometheus needs exemplar storage enabled to keep them.
Why are my logs missing trace_id?
The usual causes are logging outside an active span, such as in startup code or a background thread, losing context across an async hop or a message queue, and a logging library that was never given the trace context. Check that the log call runs while the span is current, and that the logger formats trace_id and span_id into the output.
Do I need one tool for logs, traces and metrics to correlate them?
No. Correlation depends on shared keys in the data, not on a shared vendor. If logs carry trace_id and span_id and all three signals carry the same resource attributes, you can pivot between separate tools by copying a key. One backend that understands those keys saves the copying and the timestamp guesswork.
Which resource attributes should match across signals?
At minimum service.name and deployment.environment.name. On Kubernetes, add k8s.namespace.name and k8s.pod.name, plus service.instance.id so one instance can be told from another. The value for each attribute must be spelled identically on logs, traces and metrics.


