

Apache Spark monitoring starts with three tools that ship with Spark: the Spark UI on port 4040, the history server on port 18080, and a metrics system that can send driver and executor metrics to Prometheus, JMX or Graphite. The catch is that the Spark UI lives inside the driver. When a job ends or crashes, the UI goes with it, unless you turned on event logging before the job started.
This guide covers what to watch in a Spark application, how to keep the UI after a job ends, how to read the stage page to find skew and spill, how executor memory is split, how to export metrics to Prometheus without creating new series on every run, and which alerts to set first. Every config name and default comes from the Apache Spark monitoring documentation and the Spark configuration and tuning guides.
What should you monitor in Apache Spark?
A Spark application has a driver that plans the work and executors that run it. The driver splits each action into jobs, each job into stages at shuffle boundaries, and each stage into tasks, one per partition. Monitoring Spark means watching four layers:
- Jobs and stages: how long each stage takes, how many tasks failed, and whether one stage dominates the run.
- Tasks: how evenly the work is spread. One slow task holds up its whole stage.
- Executors: memory, garbage collection (GC) time, spill to disk, and lost executors.
- The driver: heap use and how long it takes to schedule work. A driver out of memory fails the whole application.
Streaming applications add a fifth: whether processing keeps up with the rate data arrives.
Executors run on the JVM, so the usual heap and GC signals apply. Our guide to JVM metrics covers those in more depth.
What does the Spark UI show?
The Spark documentation states that “every SparkContext launches a Web UI, by default on port 4040, that displays useful information about the application.” Open http://<driver-node>:4040 to see it. If several SparkContexts run on the same host, they bind to 4041, 4042 and so on.
The tabs that matter most for monitoring:
| Tab | What it shows | Use it for |
|---|---|---|
| Jobs | Every job, its stages and status | Finding the job that failed or ran long |
| Stages | Per-stage summary metrics and a task table | Skew, spill, GC time and shuffle volume |
| Executors | Memory, disk, cores, task counts, GC time per executor | Lost executors and memory pressure |
| SQL | Each DataFrame or SQL query with its operator graph | Which join or scan produced the slow stage |
| Structured Streaming | Input rate, process rate, batch duration | Whether a stream keeps up |
The stage detail page is where most debugging happens. Its summary table shows the minimum, 25th percentile, median, 75th percentile and maximum for each task metric, including duration, GC time, scheduler delay, peak execution memory, shuffle read size and shuffle spill.
How do you keep the Spark UI after a job finishes?
By default, Spark UI data “is only available for the duration of the application.” For batch jobs that run at night and fail at 3 a.m., that means nothing to look at by morning. The fix is event logging plus the history server.
Turn on event logging when you submit the job:
spark-submit \ --conf spark.eventLog.enabled=true \ --conf spark.eventLog.dir=hdfs:///spark-events \ my_job.pyspark.eventLog.enabled defaults to false, and spark.eventLog.dir defaults to file:///tmp/spark-events on the driver’s own disk. The Spark docs suggest a shared location such as an HDFS directory so the history server can read logs from every job. Object storage works the same way.
Then set spark.history.fs.logDirectory in spark-defaults.conf on the history server host, and start the history server:
spark.history.fs.logDirectory hdfs:///spark-events./sbin/start-history-server.shThe history server serves the same UI at http://<server-url>:18080 for completed and running applications. Running applications refresh on the spark.history.fs.update.interval setting, 10 seconds by default. Event logs grow with every job, and spark.history.fs.cleaner.enabled is false by default, so turn on the cleaner or set a lifecycle rule on the storage bucket.
Which Spark metrics matter most?
Spark records metrics for every task and every executor. These are the ones that explain most slow or failed jobs, with the definitions from the Spark monitoring docs:
| Metric | Level | What it measures | What a bad value means |
|---|---|---|---|
executorRunTime | Task | Time the executor spent running the task, including fetching shuffle data, in ms | Slow tasks; compare max with median for skew |
jvmGCTime | Task | Time the JVM spent in garbage collection during the task, in ms | Memory pressure on the executor |
memoryBytesSpilled | Task | In-memory bytes spilled by the task | Execution memory too small for the data |
diskBytesSpilled | Task | On-disk bytes spilled by the task | Same, and extra disk I/O |
peakExecutionMemory | Task | Peak memory used by data structures in shuffles, aggregations and joins | How close tasks run to the memory limit |
shuffleReadMetrics.fetchWaitTime | Task | Time the task waited for remote shuffle blocks, in ms | Network or slow-executor bottleneck |
shuffleWriteMetrics.writeTime | Task | Time spent blocking on shuffle writes, in ns | Slow local disks |
JVMHeapMemory | Executor | Peak heap memory used | Executors near their heap limit |
OnHeapExecutionMemory | Executor | Peak on-heap execution memory in use, in bytes | Pressure on the shuffle and join memory pool |
MajorGCTime | Executor | Total major GC time, in ms | Full GCs stalling tasks |
Watch the units: executorRunTime and jvmGCTime are in milliseconds, while executorCpuTime and shuffleWriteMetrics.writeTime are in nanoseconds. Mixing them on one chart makes CPU time look a million times larger than run time.
A useful ratio is GC time divided by task duration. The Spark tuning guide says that if a full GC is invoked multiple times before a task completes, there isn’t enough memory available for executing tasks.
How is Spark executor memory split?
Spill and GC numbers make more sense once you know where executor memory goes. Spark reserves 300 MiB of the heap, then spark.memory.fraction (default 0.6) of the rest becomes a unified region shared by execution memory (shuffles, joins, sorts and aggregations) and storage memory (cached data). The remaining 40% is user memory for your own objects and Spark’s internal metadata.
Inside the unified region, spark.memory.storageFraction (default 0.5) marks the share of cached data that execution cannot evict. For an executor with spark.executor.memory=8g, the split works out like this:
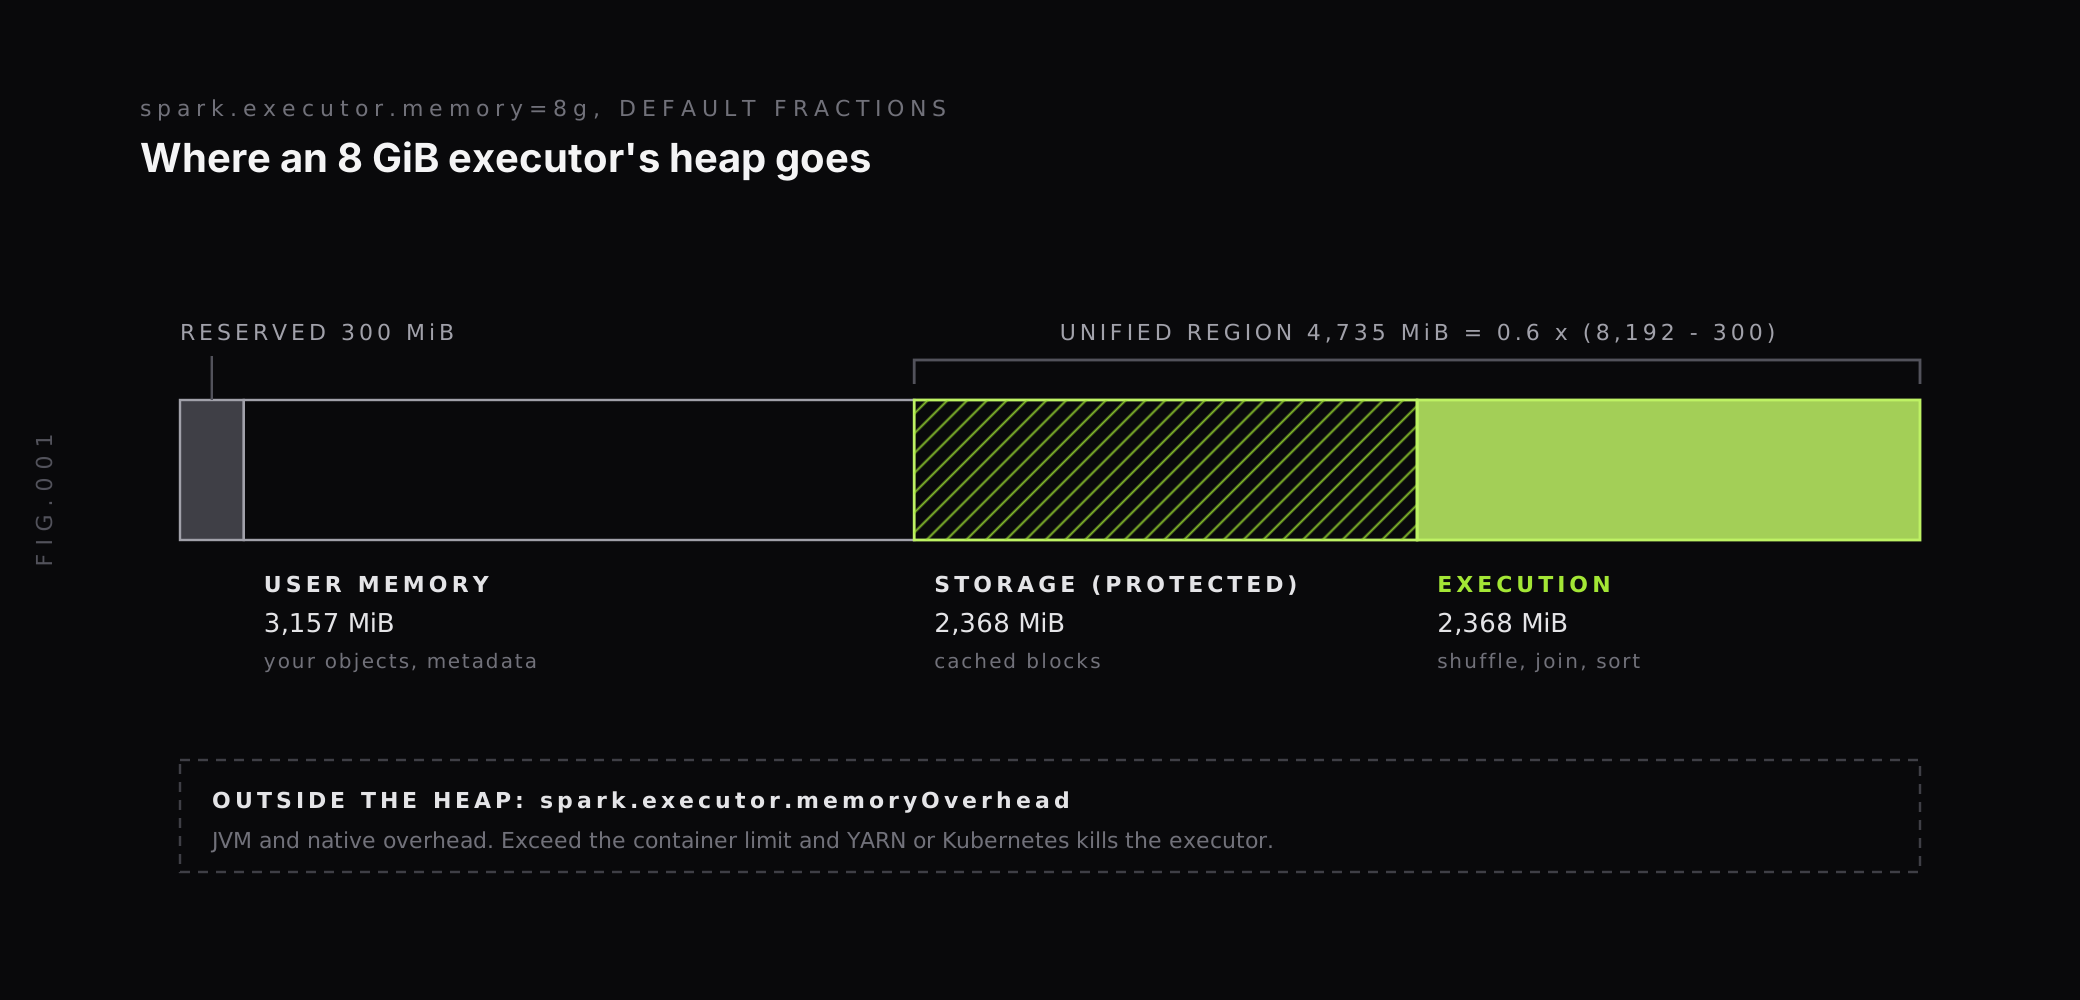
So an “8 GB executor” has about 4.6 GiB for execution and caching, and execution can borrow storage space only down to the protected half. Tasks whose shuffle or join data exceeds what is left spill to disk.
Two more limits sit outside the heap:
spark.executor.memoryOverheadcovers JVM overhead, interned strings and other native memory, and grows with executor size (the docs say typically 6 to 10%). On YARN and Kubernetes, the container size is the sum of executor memory, overhead, off-heap memory and PySpark memory. An executor that exceeds it is killed by the cluster manager, which shows up in Spark as a lost executor rather than anOutOfMemoryError.- The driver has its own heap. Collecting a large result to the driver, or broadcasting a large table, can run it out of memory. Our guide to Java OutOfMemoryError explains the heap error messages you will see.
How do you find data skew in Spark?
Skew means a few partitions hold far more data than the rest. Each partition is one task, so a stage with 199 tasks that finish in 40 seconds and one that runs for 12 minutes takes 12 minutes. Total cluster use looks low, because most executors are idle while they wait.
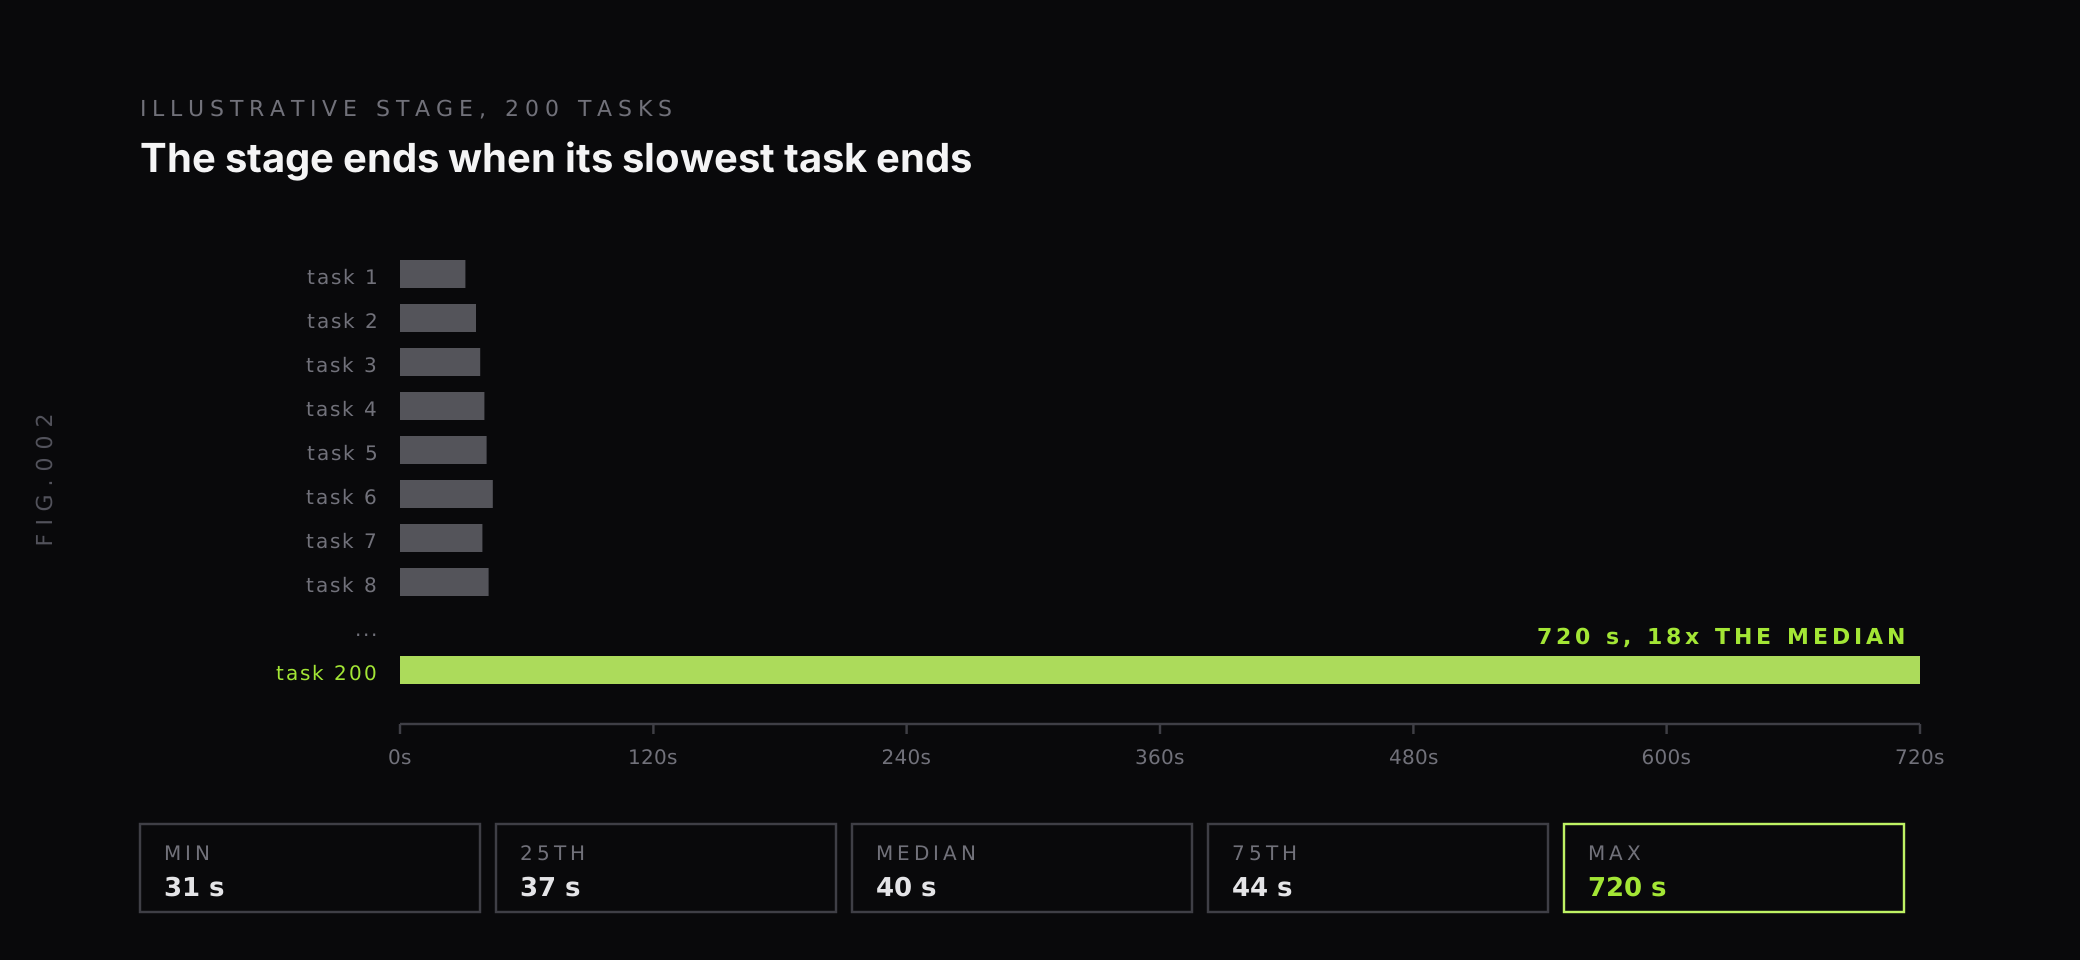
The stage detail page shows this directly. Compare the Max column with the Median column for Duration and Shuffle Read Size. If both are many times larger at the max, the slow task is reading more data, and the cause is skew. If duration is high but shuffle read size is even, look at GC time or the executor that ran the task instead.
The REST API returns the same distribution for scripts and alerts. This call asks for the median, 99th percentile and maximum of each task metric for attempt 0 of stage 12:
curl -s "http://driver-host:4040/api/v1/applications/$APP_ID/stages/12/0/taskSummary?quantiles=0.5,0.99,1.0"For Spark SQL and DataFrame jobs, adaptive query execution handles some skew on its own. spark.sql.adaptive.enabled and spark.sql.adaptive.skewJoin.enabled are both true by default, and Spark treats a partition as skewed when it is larger than spark.sql.adaptive.skewJoin.skewedPartitionFactor (5.0) times the median partition size and also larger than 256MB.
Skewed sort-merge joins are split automatically. Skew in aggregations, or partitions under the 256MB threshold, still need a fix in the job itself, such as salting the hot key.
How do you export Spark metrics to Prometheus?
The Spark UI is good for one job. Dashboards and alerts across every job need the metrics system, which Spark builds on the Dropwizard Metrics library. It reads $SPARK_HOME/conf/metrics.properties, or the same keys passed as spark.metrics.conf.* settings, and sends metrics from each instance (driver, executor, master, worker and others) to one or more sinks.
Spark 3.0 added a PrometheusServlet sink, still marked experimental in the docs, that serves metrics in Prometheus format from the existing UI ports. Add these lines to metrics.properties:
*.sink.prometheusServlet.class=org.apache.spark.metrics.sink.PrometheusServlet*.sink.prometheusServlet.path=/metrics/prometheusmaster.sink.prometheusServlet.path=/metrics/master/prometheusapplications.sink.prometheusServlet.path=/metrics/applications/prometheus| Component | Port | Prometheus endpoint |
|---|---|---|
| Driver | 4040 | /metrics/prometheus/ |
| Driver (executor metrics) | 4040 | /metrics/executors/prometheus/ |
| Standalone master | 8080 | /metrics/master/prometheus/ |
| Standalone worker | 8081 | /metrics/prometheus/ |
The executor endpoint is controlled by spark.ui.prometheus.enabled, which the current configuration docs list as true by default. Check the docs for your Spark version, since older releases shipped it turned off.
Set spark.metrics.namespace before you scrape
There is one setting to change before pointing Prometheus at the driver. Spark’s docs explain that driver and executor metrics use spark.app.id as their root namespace by default, and the app ID changes on every run. The example output in the original Spark pull request shows what that looks like:
metrics_app_20190911211130_0000_driver_BlockManager_memory_maxMem_MB_Value 732The app ID is part of the metric name itself. Every run of the same job creates brand new metric names, so dashboards cannot compare runs and the series count grows with every submission. Set a stable namespace per job:
spark-submit \ --conf spark.metrics.namespace=nightly_orders_etl \ --conf "spark.metrics.conf.*.sink.prometheusServlet.class=org.apache.spark.metrics.sink.PrometheusServlet" \ --conf "spark.metrics.conf.*.sink.prometheusServlet.path=/metrics/prometheus" \ my_job.pyThe executor endpoint takes a different approach and puts the application in labels instead, for example metrics_executor_rddBlocks{application_id="...", application_name="...", executor_id="..."}. That keeps metric names stable, but application_id still creates new series on every run. Our guide to managing high cardinality metrics covers how to keep that under control.
Short batch jobs need one more step. A job that runs for four minutes may finish between two scrapes, so its last values never get collected. Scrape the driver at a short interval while it runs, or rely on the history server and event logs for after-the-fact analysis of short jobs.
How do you monitor Spark Structured Streaming?
A streaming query is healthy when it processes data at least as fast as data arrives. The Structured Streaming tab in the Spark UI charts this with Input Rate, Process Rate, Input Rows, Batch Duration and Operation Duration.
In code, query.lastProgress and query.recentProgress return progress reports with fields such as numInputRows, inputRowsPerSecond and processedRowsPerSecond, and a StreamingQueryListener receives the same reports as events. To send streaming metrics through the metrics system as well, set spark.sql.streaming.metricsEnabled to true and give each query a name with queryName(), so the metric names stay stable between restarts.
The signals to watch:
- Process rate below input rate for several batches means the query is falling behind and a backlog is building.
- Batch duration above the trigger interval means each batch takes longer than the time between batches, so batches start late.
- Growing state size in stateful queries (aggregations, joins, deduplication) means watermarks are not dropping old state, and executor memory will follow.
Which alerts should you set for Spark?
Start with alerts that catch failed and stuck jobs, then add the ones that catch slow jobs before they miss a deadline. These thresholds are starting points to tune against your own jobs:
| Alert | Condition | Why |
|---|---|---|
| Job failed | Application or job status failed, or failed task count above 0 for a critical job | Missed data and broken downstream tables |
| Job running long | Run time above the job’s normal p95 plus a margin | Skew, data growth or a stuck task |
| Executors lost | Executor count drops during a run | Container kills from memory overhead or node loss |
| GC pressure | GC time above 10% of task time for 10 minutes | Executors short on memory |
| Heavy spill | Disk spill per stage far above the job’s normal level | Execution memory too small, or too few partitions |
| Driver heap | Driver heap above 85% of max | Driver out of memory fails the whole job |
| Streaming lag | Process rate below input rate for 5 batches | Backlog building in a streaming query |
| History server | No new event log files in the log directory for a day | Event logging broken, nothing to debug with later |
The last alert is easy to forget. Event logging usually breaks quietly, through a permissions change on the log directory or a full disk, and nobody notices until the night a job fails and there is no UI to look at.
Route these through the same alerting setup as the rest of your stack. Our guide to Prometheus Alertmanager covers grouping and routing if you alert from Prometheus.
How does Last9 fit with Spark monitoring?
Once Spark exposes Prometheus metrics, Prometheus or an OpenTelemetry Collector scrapes them and sends them to Last9 with Prometheus remote write. Our Prometheus integration needs only a remote_write block with your Last9 endpoint and credentials, and Prometheus can run in agent mode so it scrapes and forwards without storing data locally. Last9 also exposes a Prometheus-compatible query API, so existing PromQL dashboards and alert rules keep working.
Spark creates series quickly: every executor, every application ID and every job namespace becomes a label value, and a busy cluster runs hundreds of jobs a day. Last9 handles 20M series per metric per day by default, with no sampling, so per-executor detail stays queryable. Our Control Plane lets you drop, remap, redact, forward and aggregate metrics, logs and traces at ingest, for example dropping application_id from metrics where you only need the job name.
Find the slow stage before blaming the cluster
Most Spark problems hide one level below where teams look. A job runs long because one stage runs long, and a stage runs long because one task reads 18 times more data than the median. Executors look healthy on average while one of them spends a third of its time in GC. The Spark UI shows all of this, but only while the driver is alive, unless event logs are on.
Start with three changes: turn on event logging to shared storage with the history server running, set spark.metrics.namespace on every job before you scrape it, and add alerts for failed jobs, lost executors and GC pressure. Then compare max and median task duration whenever a stage is slow. When you want Spark metrics next to the rest of your infrastructure, Last9 takes Prometheus remote write and queries it with PromQL.
FAQ
How do you monitor an Apache Spark application?
Apache Spark has three built-in monitoring interfaces. The Spark UI runs on the driver at port 4040 while an application is running. The history server, on port 18080 by default, rebuilds the UI from event logs after the application ends. The metrics system, based on the Dropwizard Metrics library, sends driver and executor metrics to sinks such as JMX, CSV files, Graphite or a Prometheus endpoint.
What port does the Spark UI run on?
The Spark UI runs on port 4040 on the driver by default, set by spark.ui.port. If several SparkContexts run on the same host, each one binds to the next free port: 4041, 4042 and so on. The Spark history server uses port 18080 by default, and the standalone master and worker UIs use ports 8080 and 8081.
Why does the Spark UI disappear when a job finishes?
The Spark UI is served by the driver, so it stops when the application ends. To see it afterwards, set spark.eventLog.enabled to true so Spark writes its events to storage, point spark.eventLog.dir at a shared location such as HDFS or object storage, and run the Spark history server against that directory. The history server rebuilds the same UI from the event logs.
How do you expose Spark metrics to Prometheus?
Since Spark 3.0, Spark includes an experimental PrometheusServlet sink. Set the sink class to org.apache.spark.metrics.sink.PrometheusServlet and a sink path in metrics.properties, or pass the same keys with the spark.metrics.conf. prefix. The driver then serves its metrics at /metrics/prometheus/ on port 4040, and executor metrics are available at /metrics/executors/prometheus/ when spark.ui.prometheus.enabled is on.
How do you detect data skew in Spark?
Open the stage detail page in the Spark UI and compare the maximum task duration with the median in the summary metrics table. A maximum many times the median, with matching differences in shuffle read size, means a few partitions hold far more data than the rest. Spark’s adaptive query execution treats a partition as skewed when it is larger than 5 times the median partition size and larger than 256MB by default.
What do shuffle spill memory and spill disk mean in Spark?
Spill happens when a task’s shuffle, sort, join or aggregation data does not fit in execution memory, so Spark writes part of it to disk. In the Spark UI, Shuffle spill (memory) is the size of the deserialized data in memory and Shuffle spill (disk) is the size of the serialized data written to disk. Steady spill on many tasks usually means executors need more memory or the stage needs more partitions.


