


APM Logs: How to Get Started for Faster Debugging
Understand how APM logs connect metrics, traces, and events to speed up debugging and uncover root causes faster.
Anjali Udasi
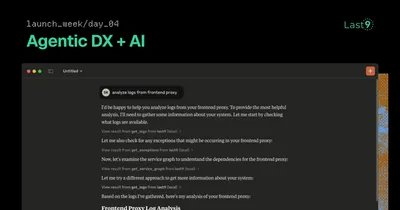
From Cloud Native to AI Native: Why Your Observability Stack Needs to Speak Agent
Your production telemetry now speaks agent: ask questions in Slack, debug in VS Code, optimize in real-time. Same data, conversational interface.
Nishant Modak
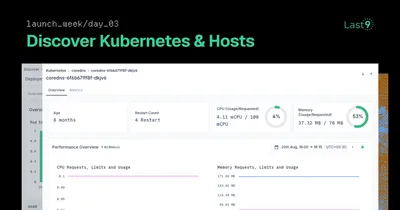
Your Apps Are Green. Your Infrastructure Is Dying.
Infra problems hide behind green dashboards. Discover Infrastructure monitors K8s and hosts from the same telemetry—unified visibility, AI-powered debugging.
Nishant Modak

A Detailed Guide to Azure Kubernetes Service Monitoring
Track the right AKS metrics, integrate with Azure Monitor, and optimize dashboards for reliable, cost-efficient Kubernetes operations.
Faiz Shaikh
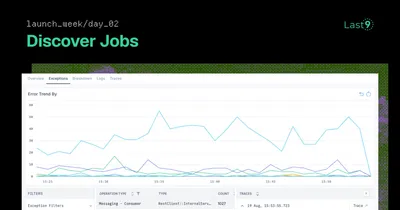
Your APIs Are Green. Your Background Jobs Are Dying.
Background jobs fail silently while your APIs look healthy. Discover Jobs gives async operations the same deep visibility as APIs—automatic detection, operation-level debugging.
Nishant Modak

What is Real User Monitoring
Understand how Real User Monitoring captures real user interactions to reveal true app performance, errors, and user experience patterns.
Anjali Udasi
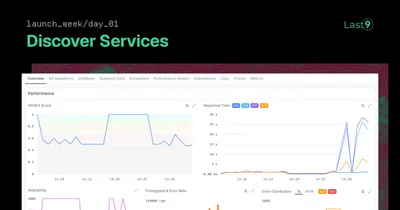
The Service Discovery Problem Every Developer Knows (But Pretends Doesn't Exist)
New services deploy faster than you can track them. Discover Services auto-discovers your entire architecture from traces—convention over configuration. No manual catalogs.
Nishant Modak

Top 12 LogicMonitor Alternatives for Developers in 2025
LogicMonitor fits traditional infra, but for microservices, high-cardinality data, and Kubernetes, these 12 alternatives work better.
Faiz Shaikh

Top 13 Application Performance Monitoring Tools
Discover 7 reliable APM tools that help you monitor performance, spot issues early, and keep your applications running without surprises.
Anjali Udasi