


A Detailed Guide to Azure Kubernetes Service Monitoring
Track the right AKS metrics, integrate with Azure Monitor, and optimize dashboards for reliable, cost-efficient Kubernetes operations.
Faiz Shaikh
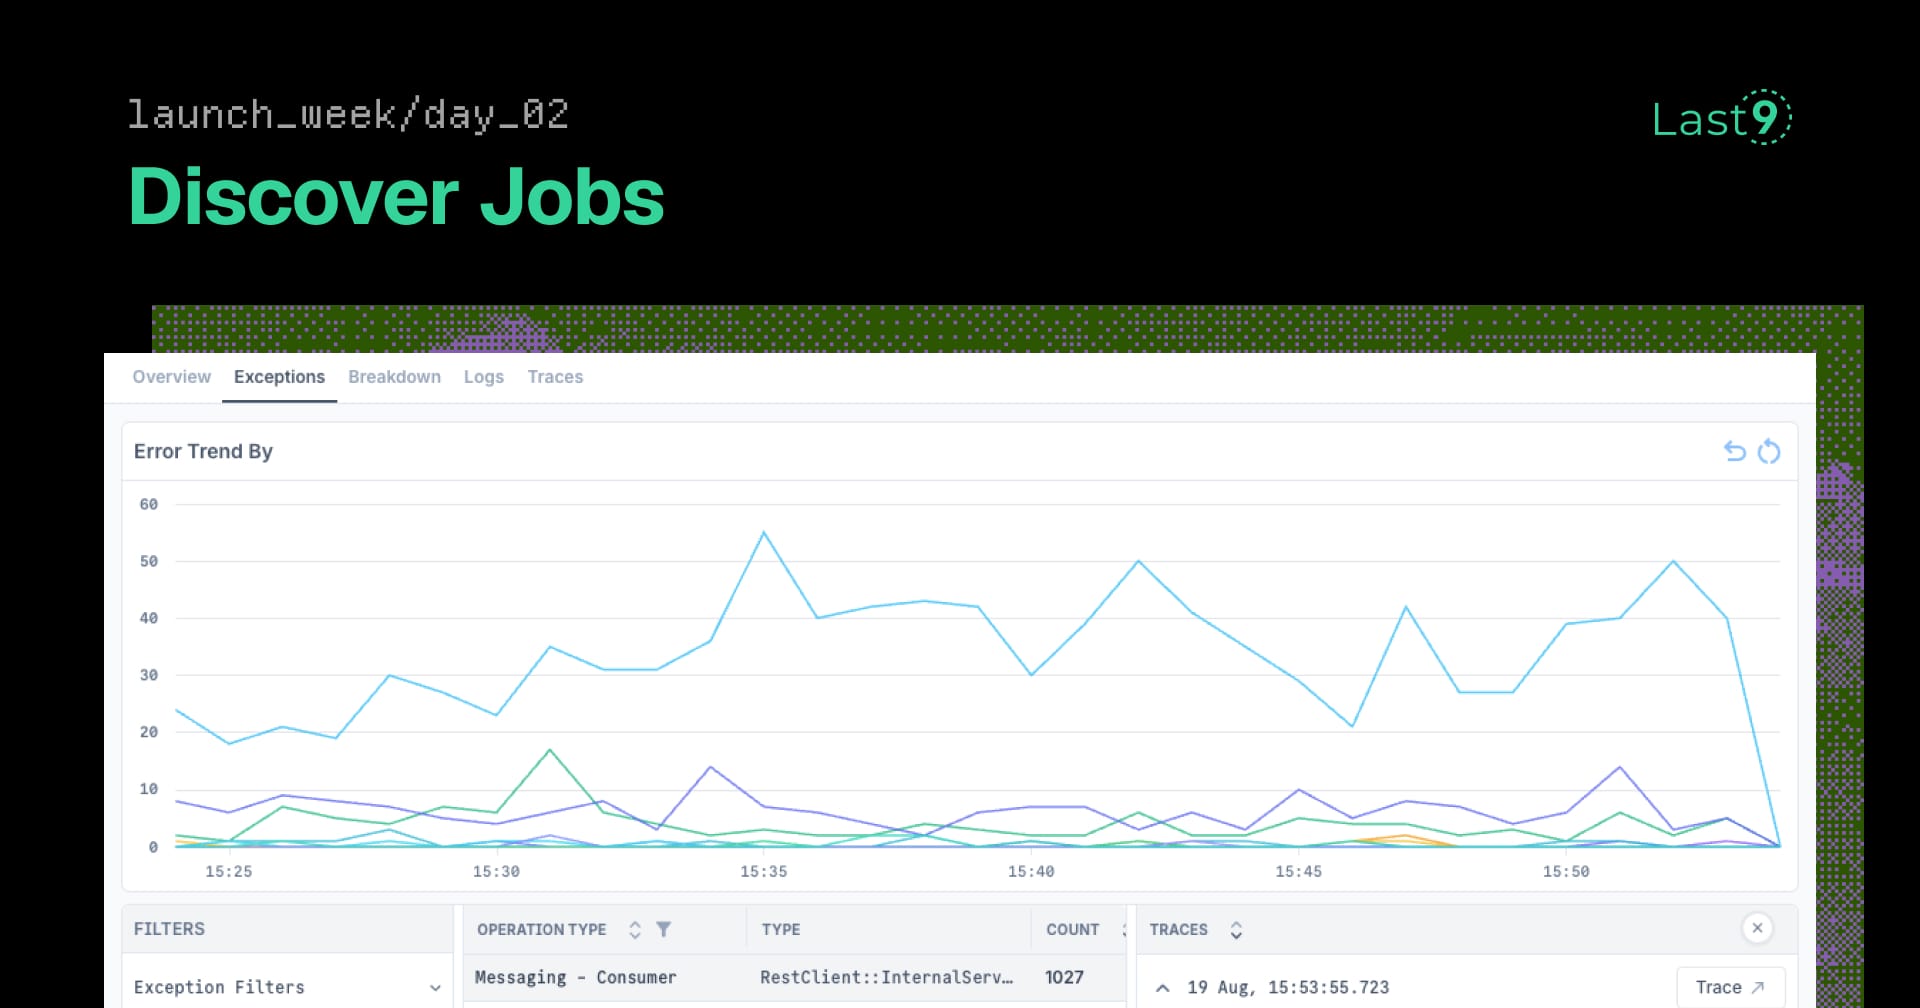
Your APIs Are Green. Your Background Jobs Are Dying.
Background jobs fail silently while your APIs look healthy. Discover Jobs gives async operations the same deep visibility as APIs—automatic detection, operation-level debugging.
Nishant Modak

What is Real User Monitoring
Understand how Real User Monitoring captures real user interactions to reveal true app performance, errors, and user experience patterns.
Anjali Udasi
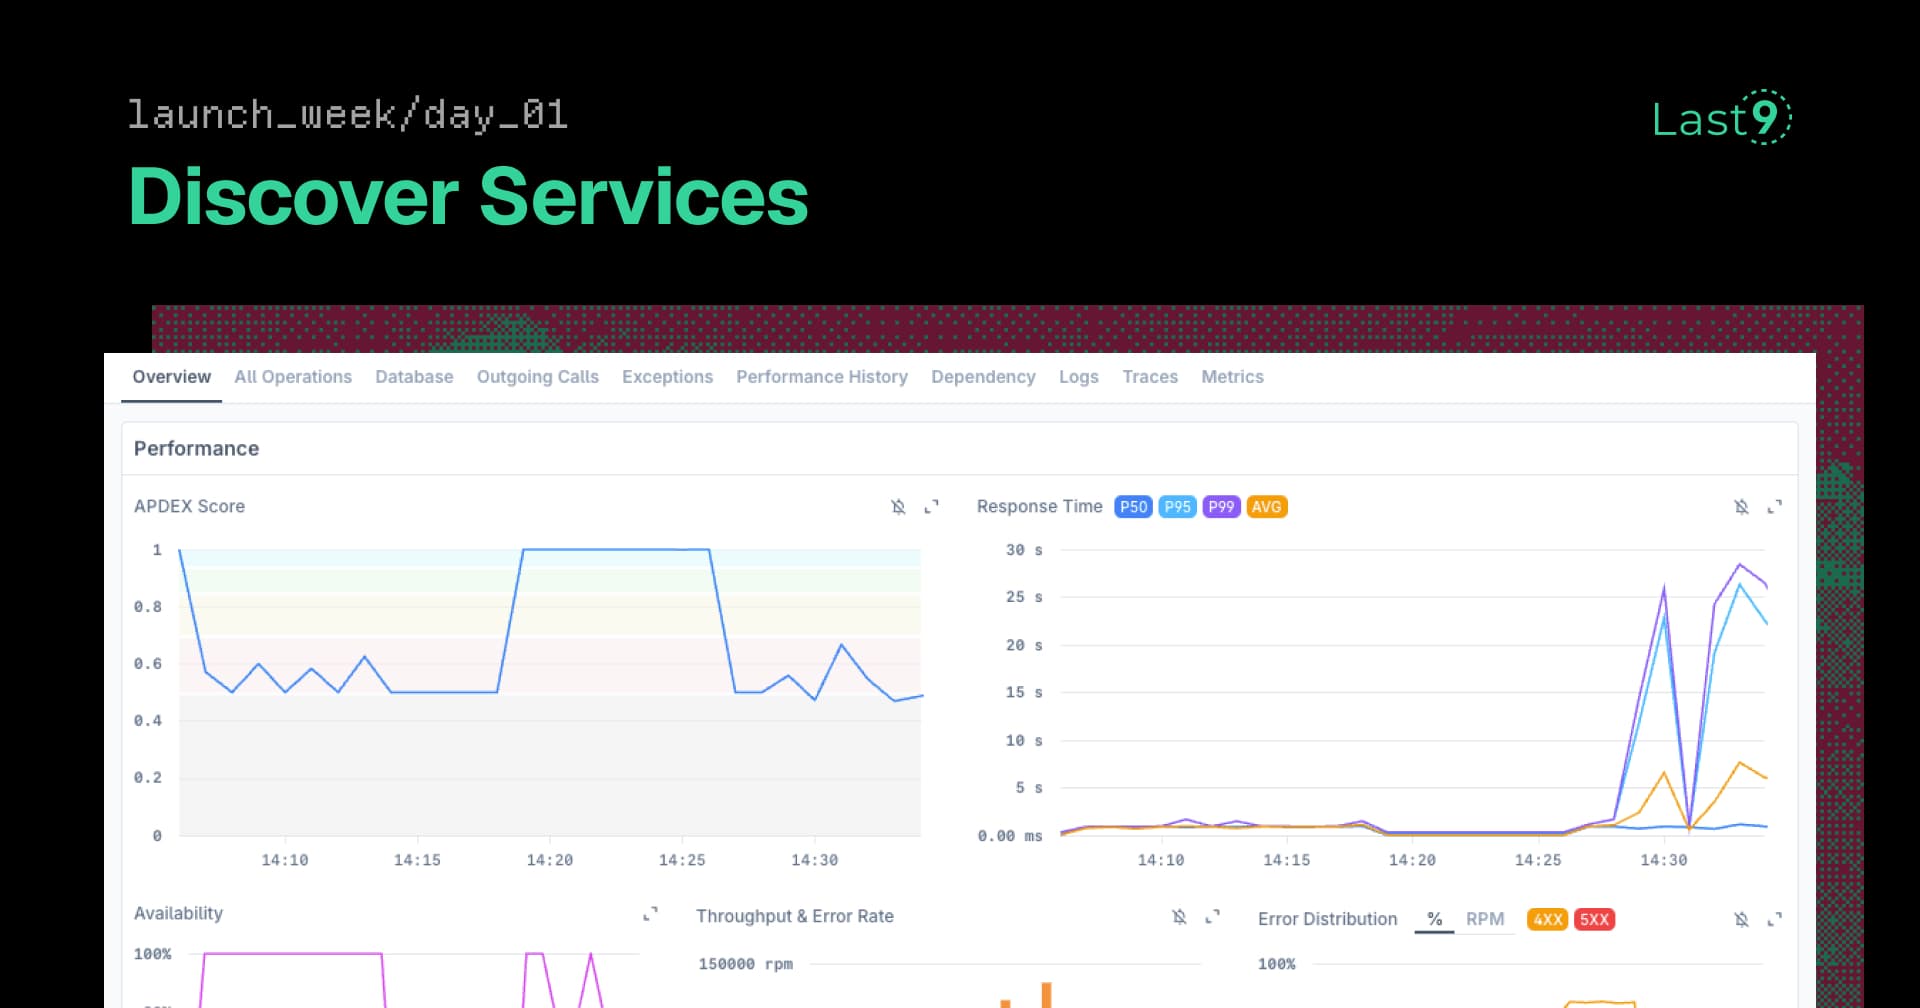
The Service Discovery Problem Every Developer Knows (But Pretends Doesn't Exist)
New services deploy faster than you can track them. Discover Services auto-discovers your entire architecture from traces—convention over configuration. No manual catalogs.
Nishant Modak

Top 12 LogicMonitor Alternatives for Developers in 2025
LogicMonitor fits traditional infra, but for microservices, high-cardinality data, and Kubernetes, these 12 alternatives work better.
Faiz Shaikh

Top 13 Application Performance Monitoring Tools
Discover 7 reliable APM tools that help you monitor performance, spot issues early, and keep your applications running without surprises.
Anjali Udasi

Log Format Standards: JSON, XML, and Key-Value Explained
A practical look at common log format standards, how JSON, XML, and key-value logs work, and when to use each in production systems.
Faiz Shaikh

PostgreSQL Performance Tuning: Cut Query Latency 50-80%
Slow Postgres queries killing your app? Learn proven tuning techniques for indexes, VACUUM, connection pooling, and query optimization. Real fixes that cut latency 50-80%.
Faiz Shaikh

What are Application Metrics?
Application metrics are key performance signals, like latency, error rate, and throughput, that help you understand how your app behaves in production.
Anjali Udasi