Last9 comes with Embedded Grafana, which allows you to create dashboards for various metrics and components. Last9 also comes with Alert Studio and Changeboards to monitor the health of services and components.
So far, these two operations – visualization and alerting – have been at two different places. You could create and visualize the metrics in dashboards and set up and monitor health with Alert Studio and Changeboards. They were two separate views within Last9. But that's not how one would go about monitoring their services. The first step is to create a dashboard.
But while looking at a dashboard, service owners also want to know if there is anything broken on this dashboard. Or add alerts for the dashboard. If they can do this, they can:
- Take quick actions to mitigate the incident.
- Perform impact analysis right there with additional system information via panels.
- Leverage the dashboard to inspect over longer ranges to understand health degradation better.
Most notably in a single view, without switching tabs or context.
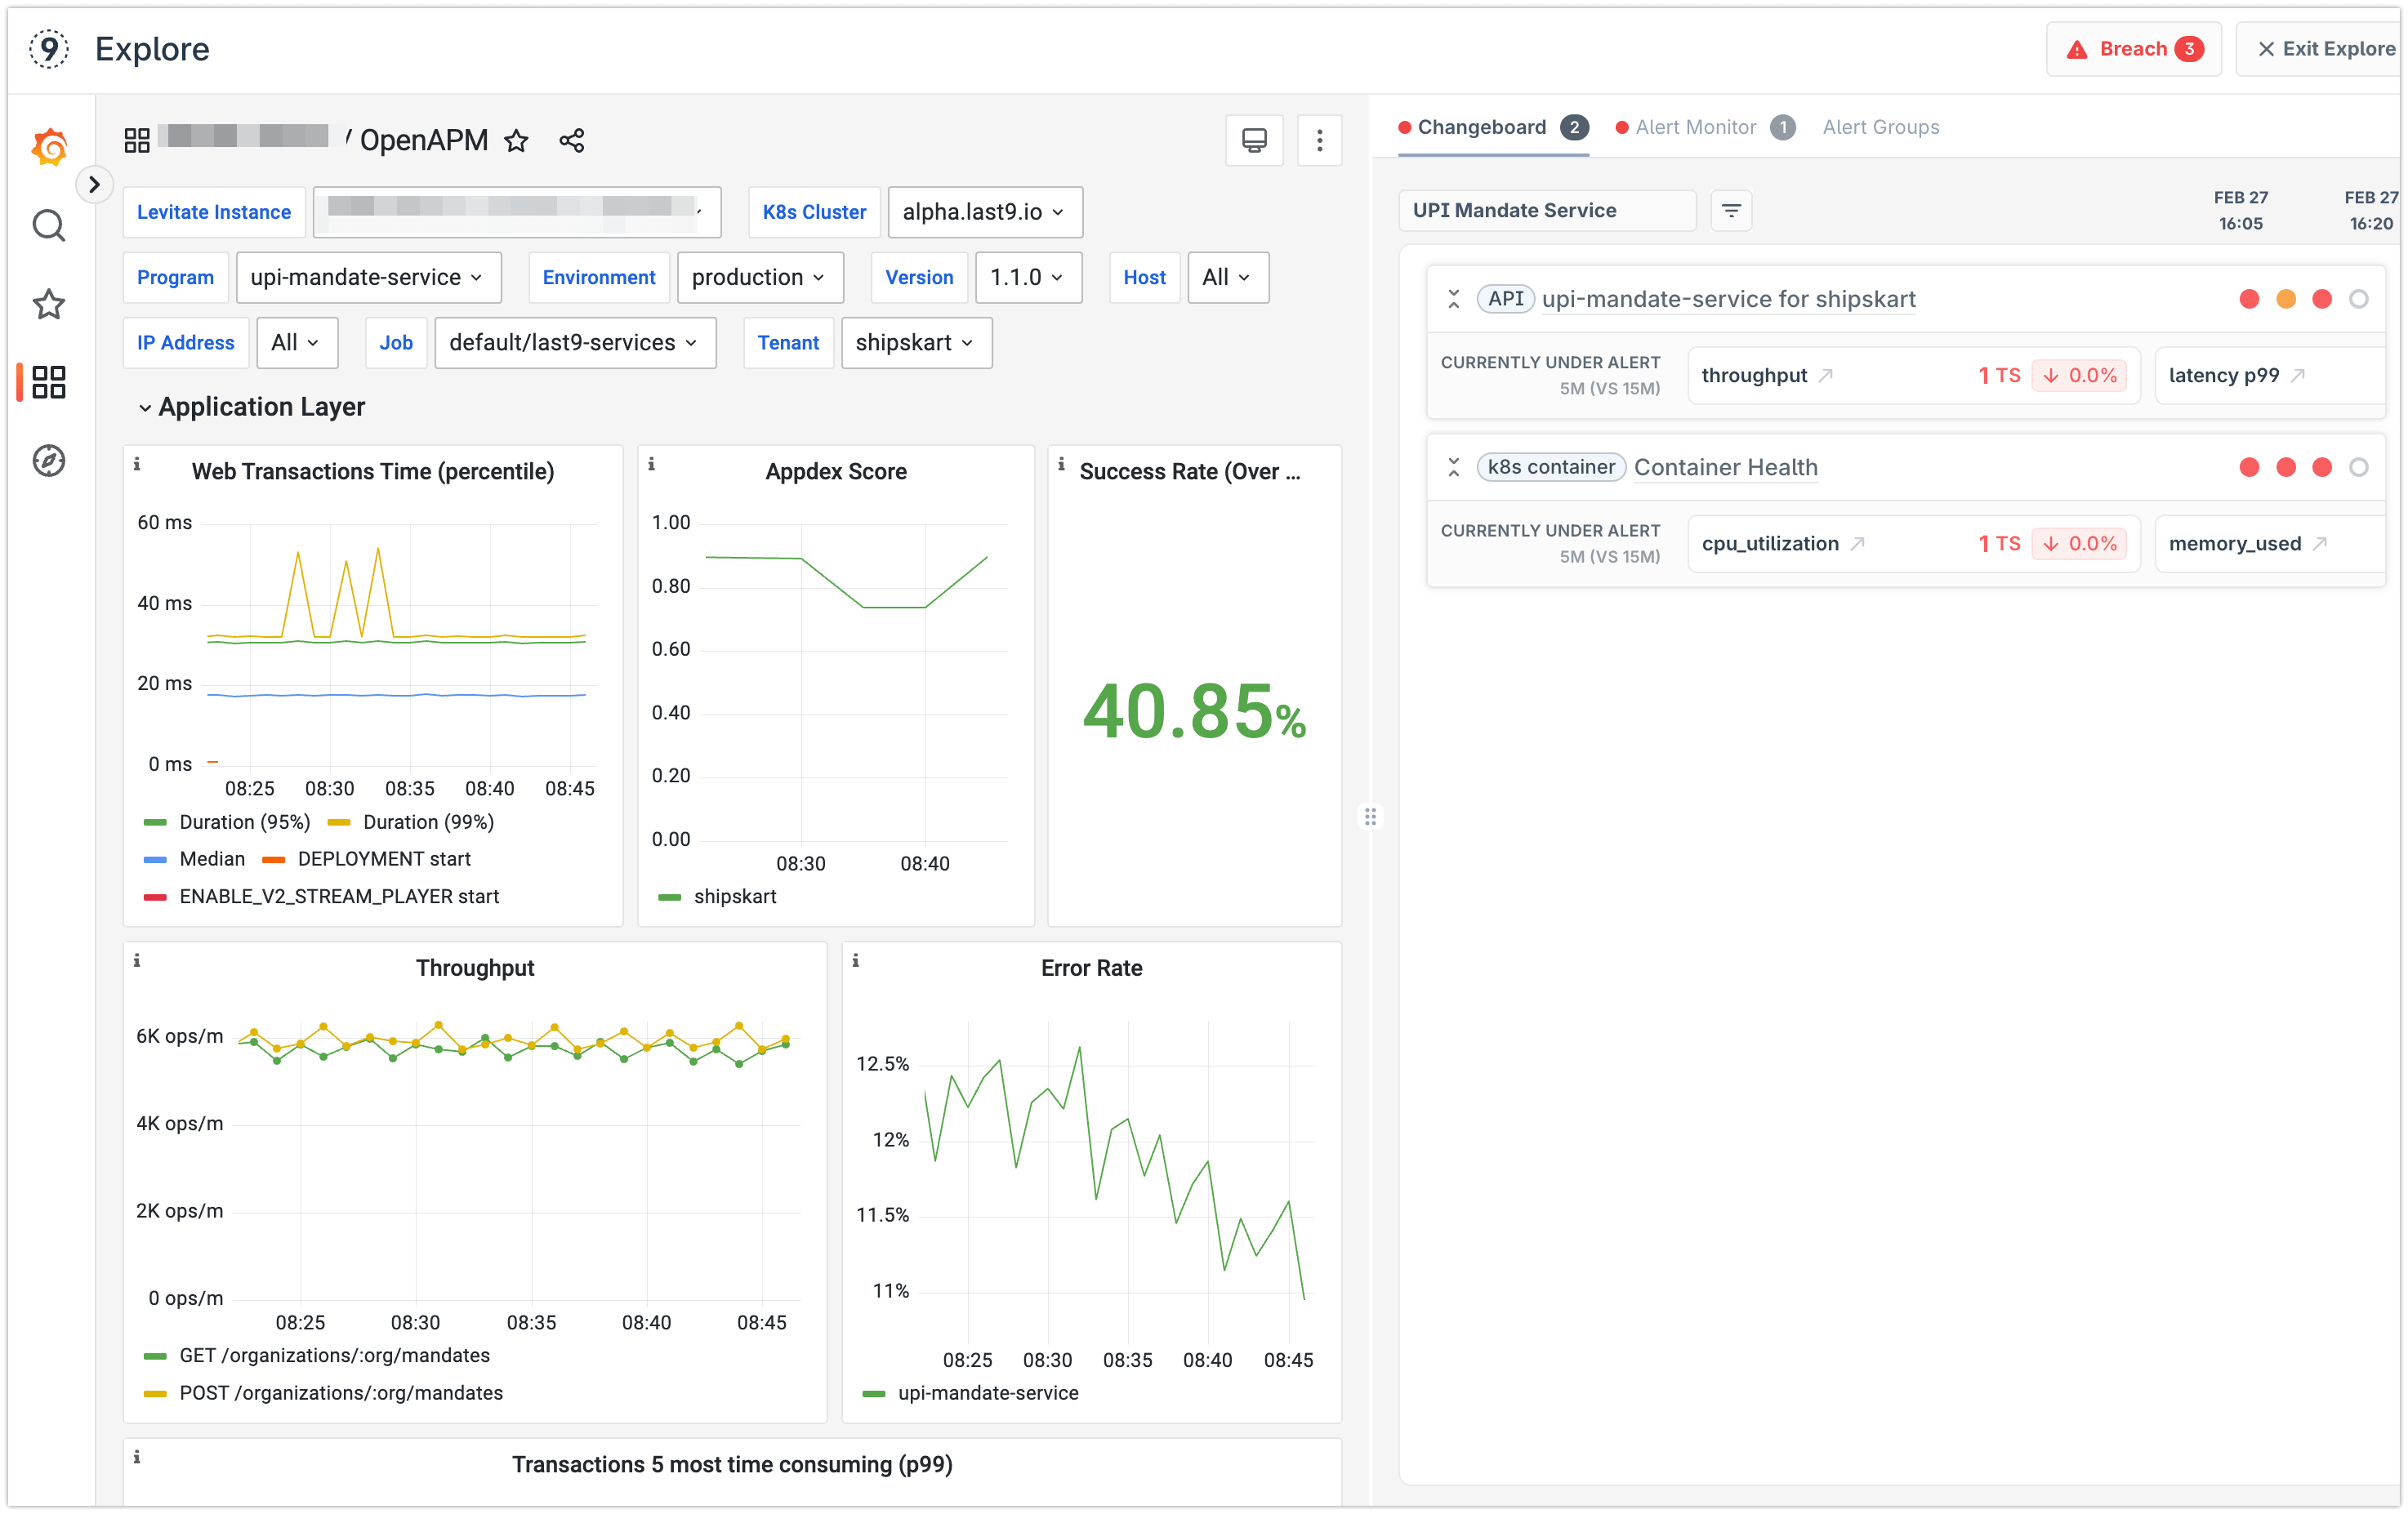
Dashboards with Alert Monitor
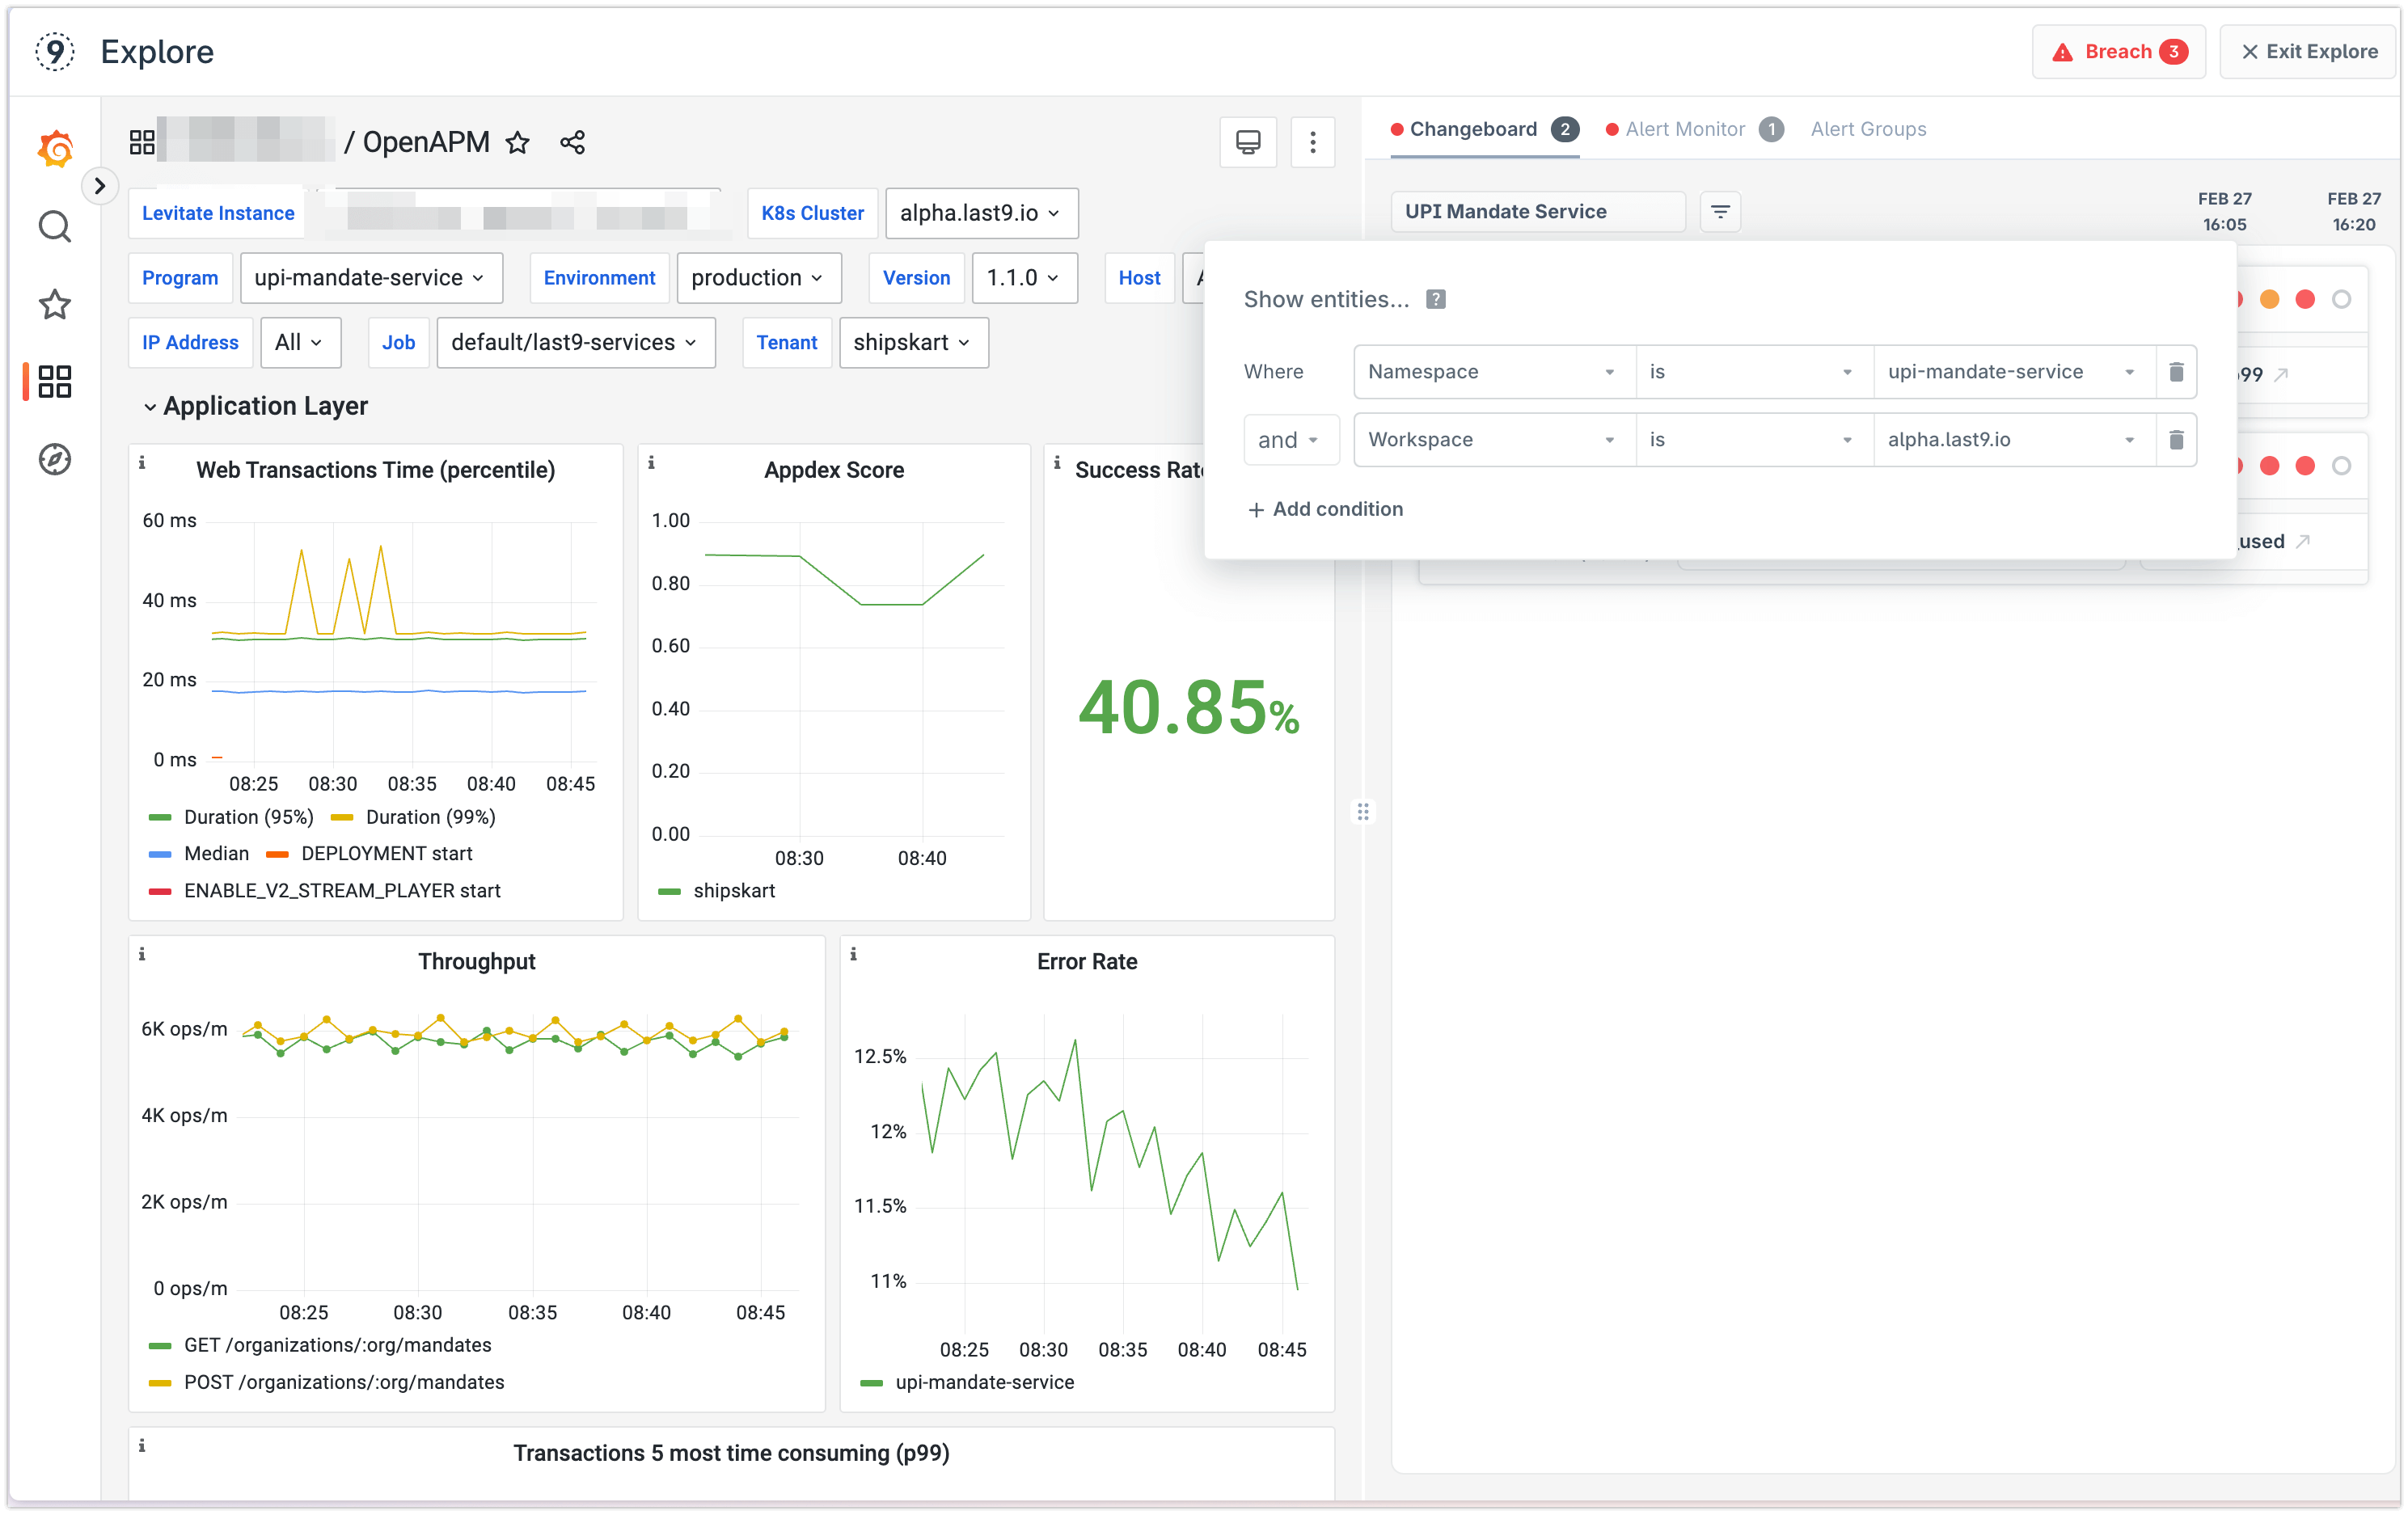
You can see if any alert is failing alongside the dashboard. You can also see alert groups linked to a dashboard.
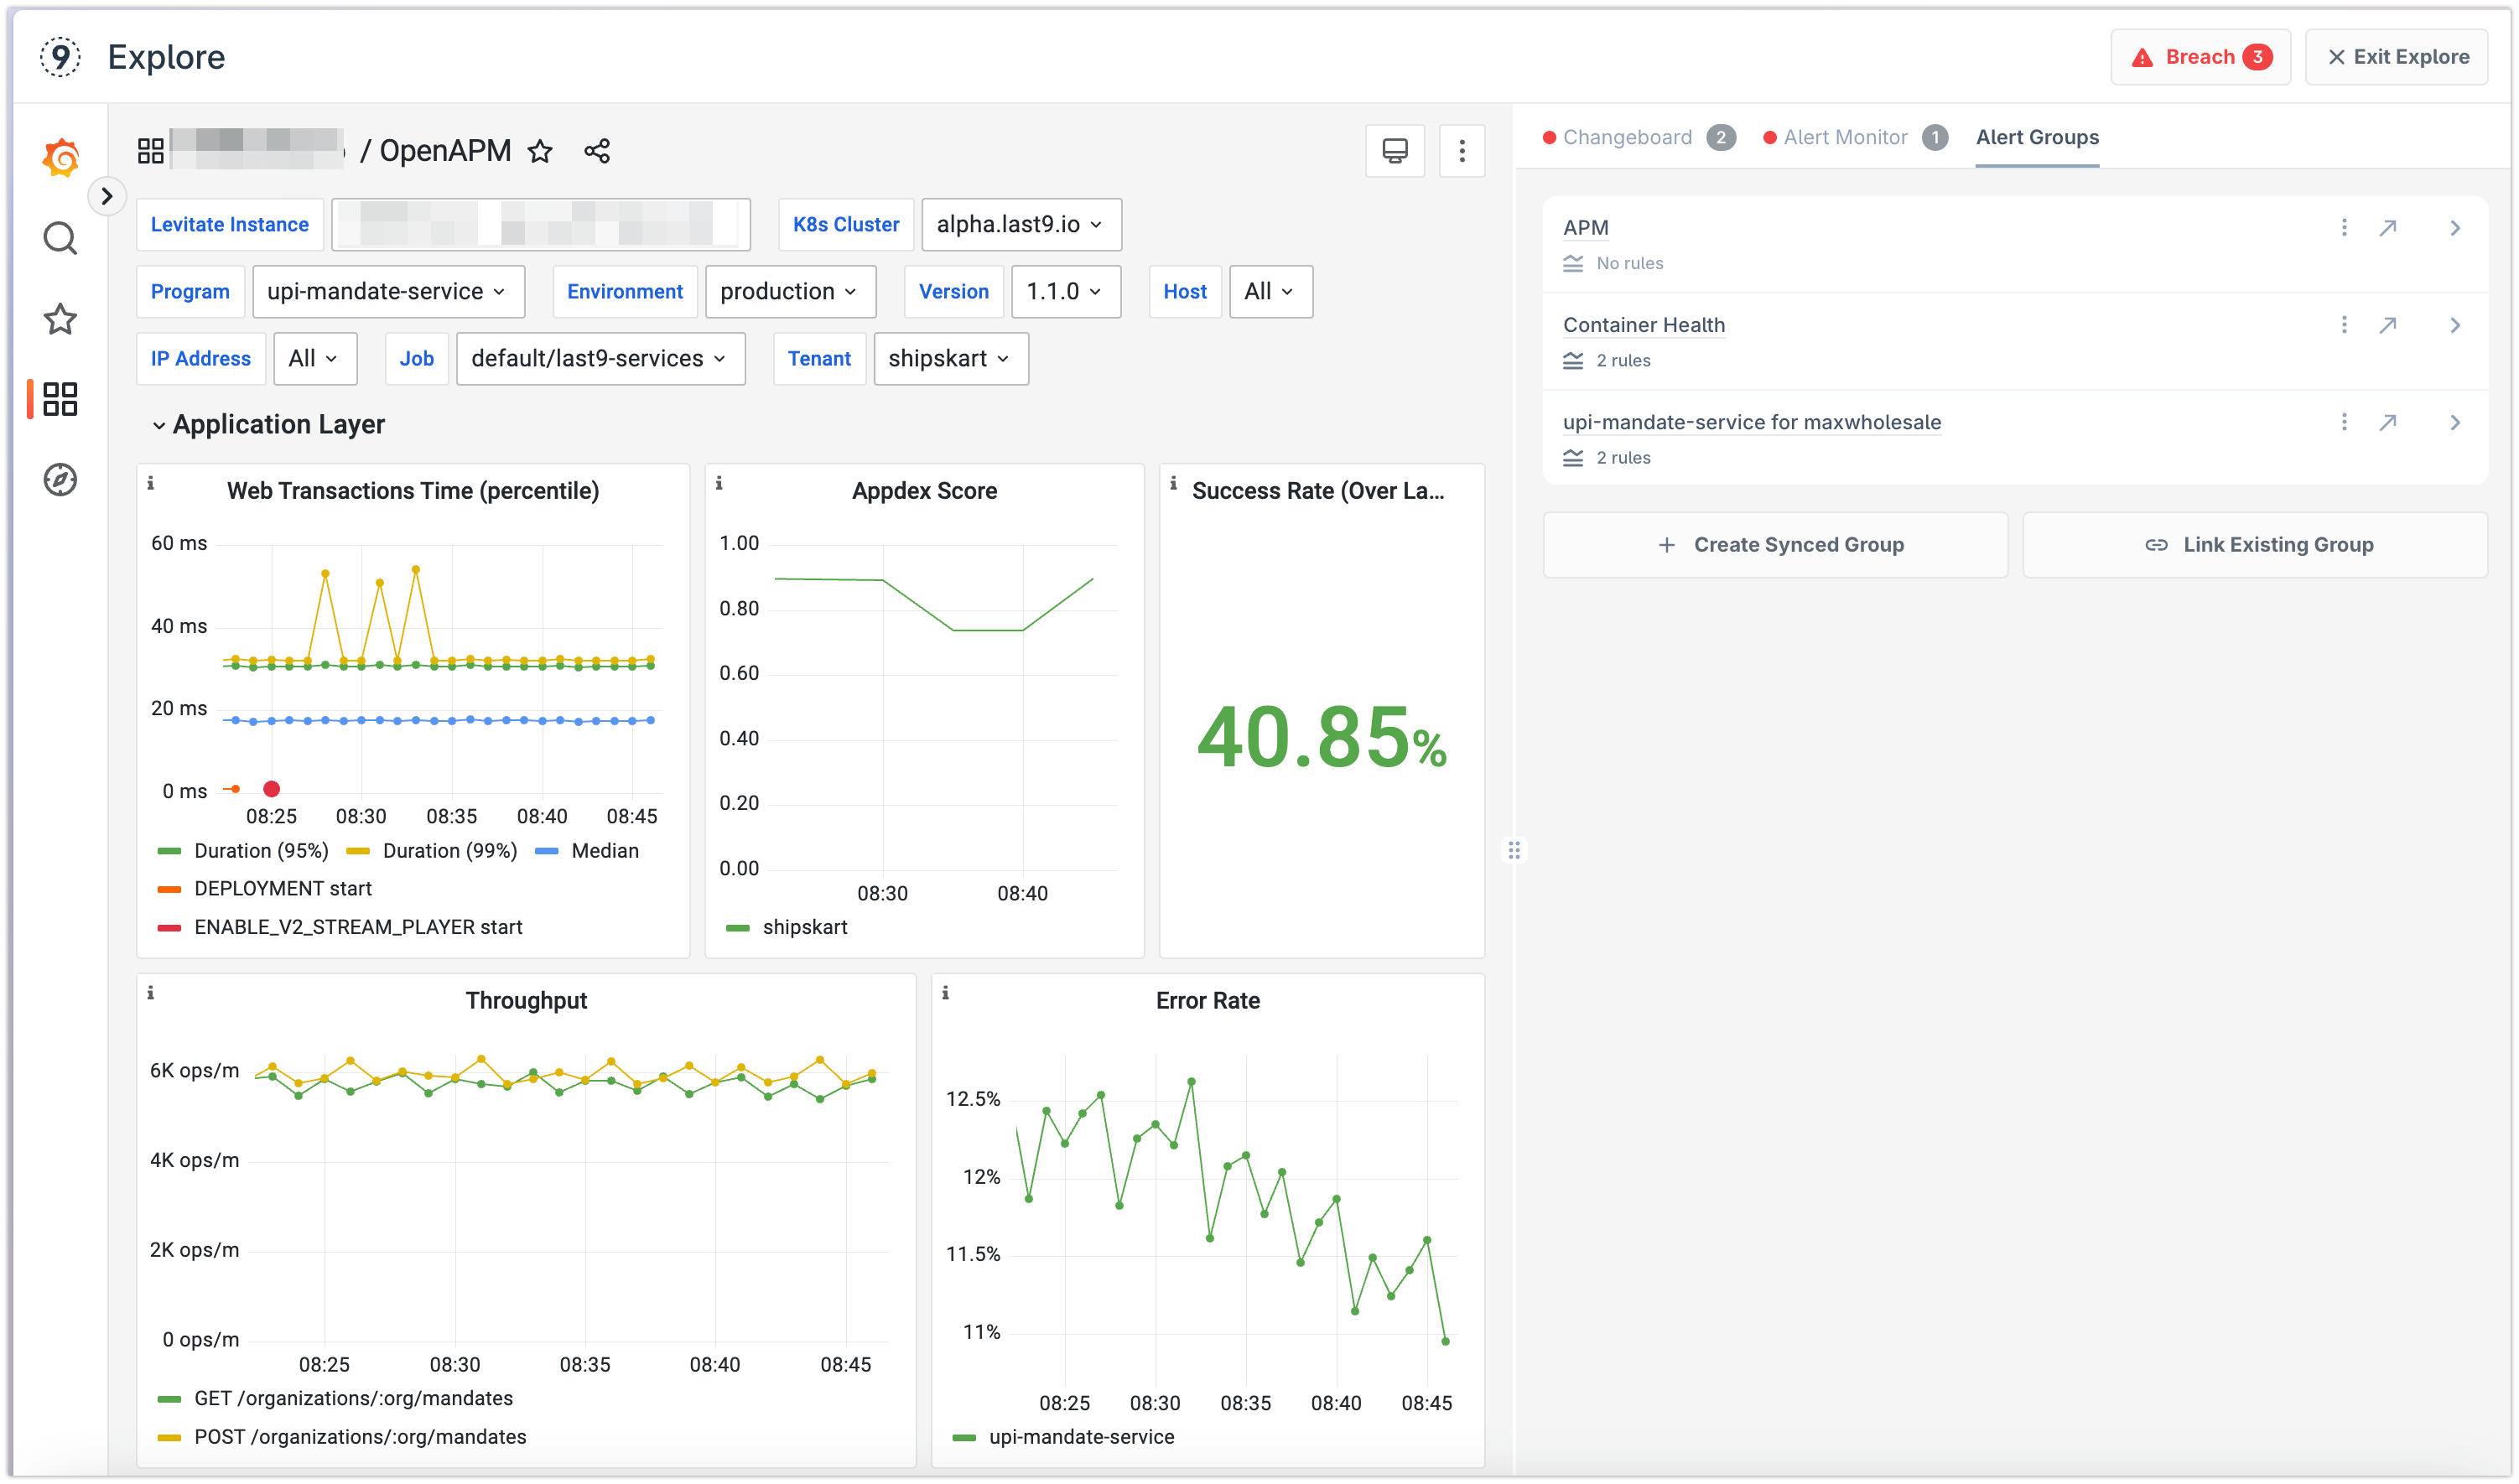
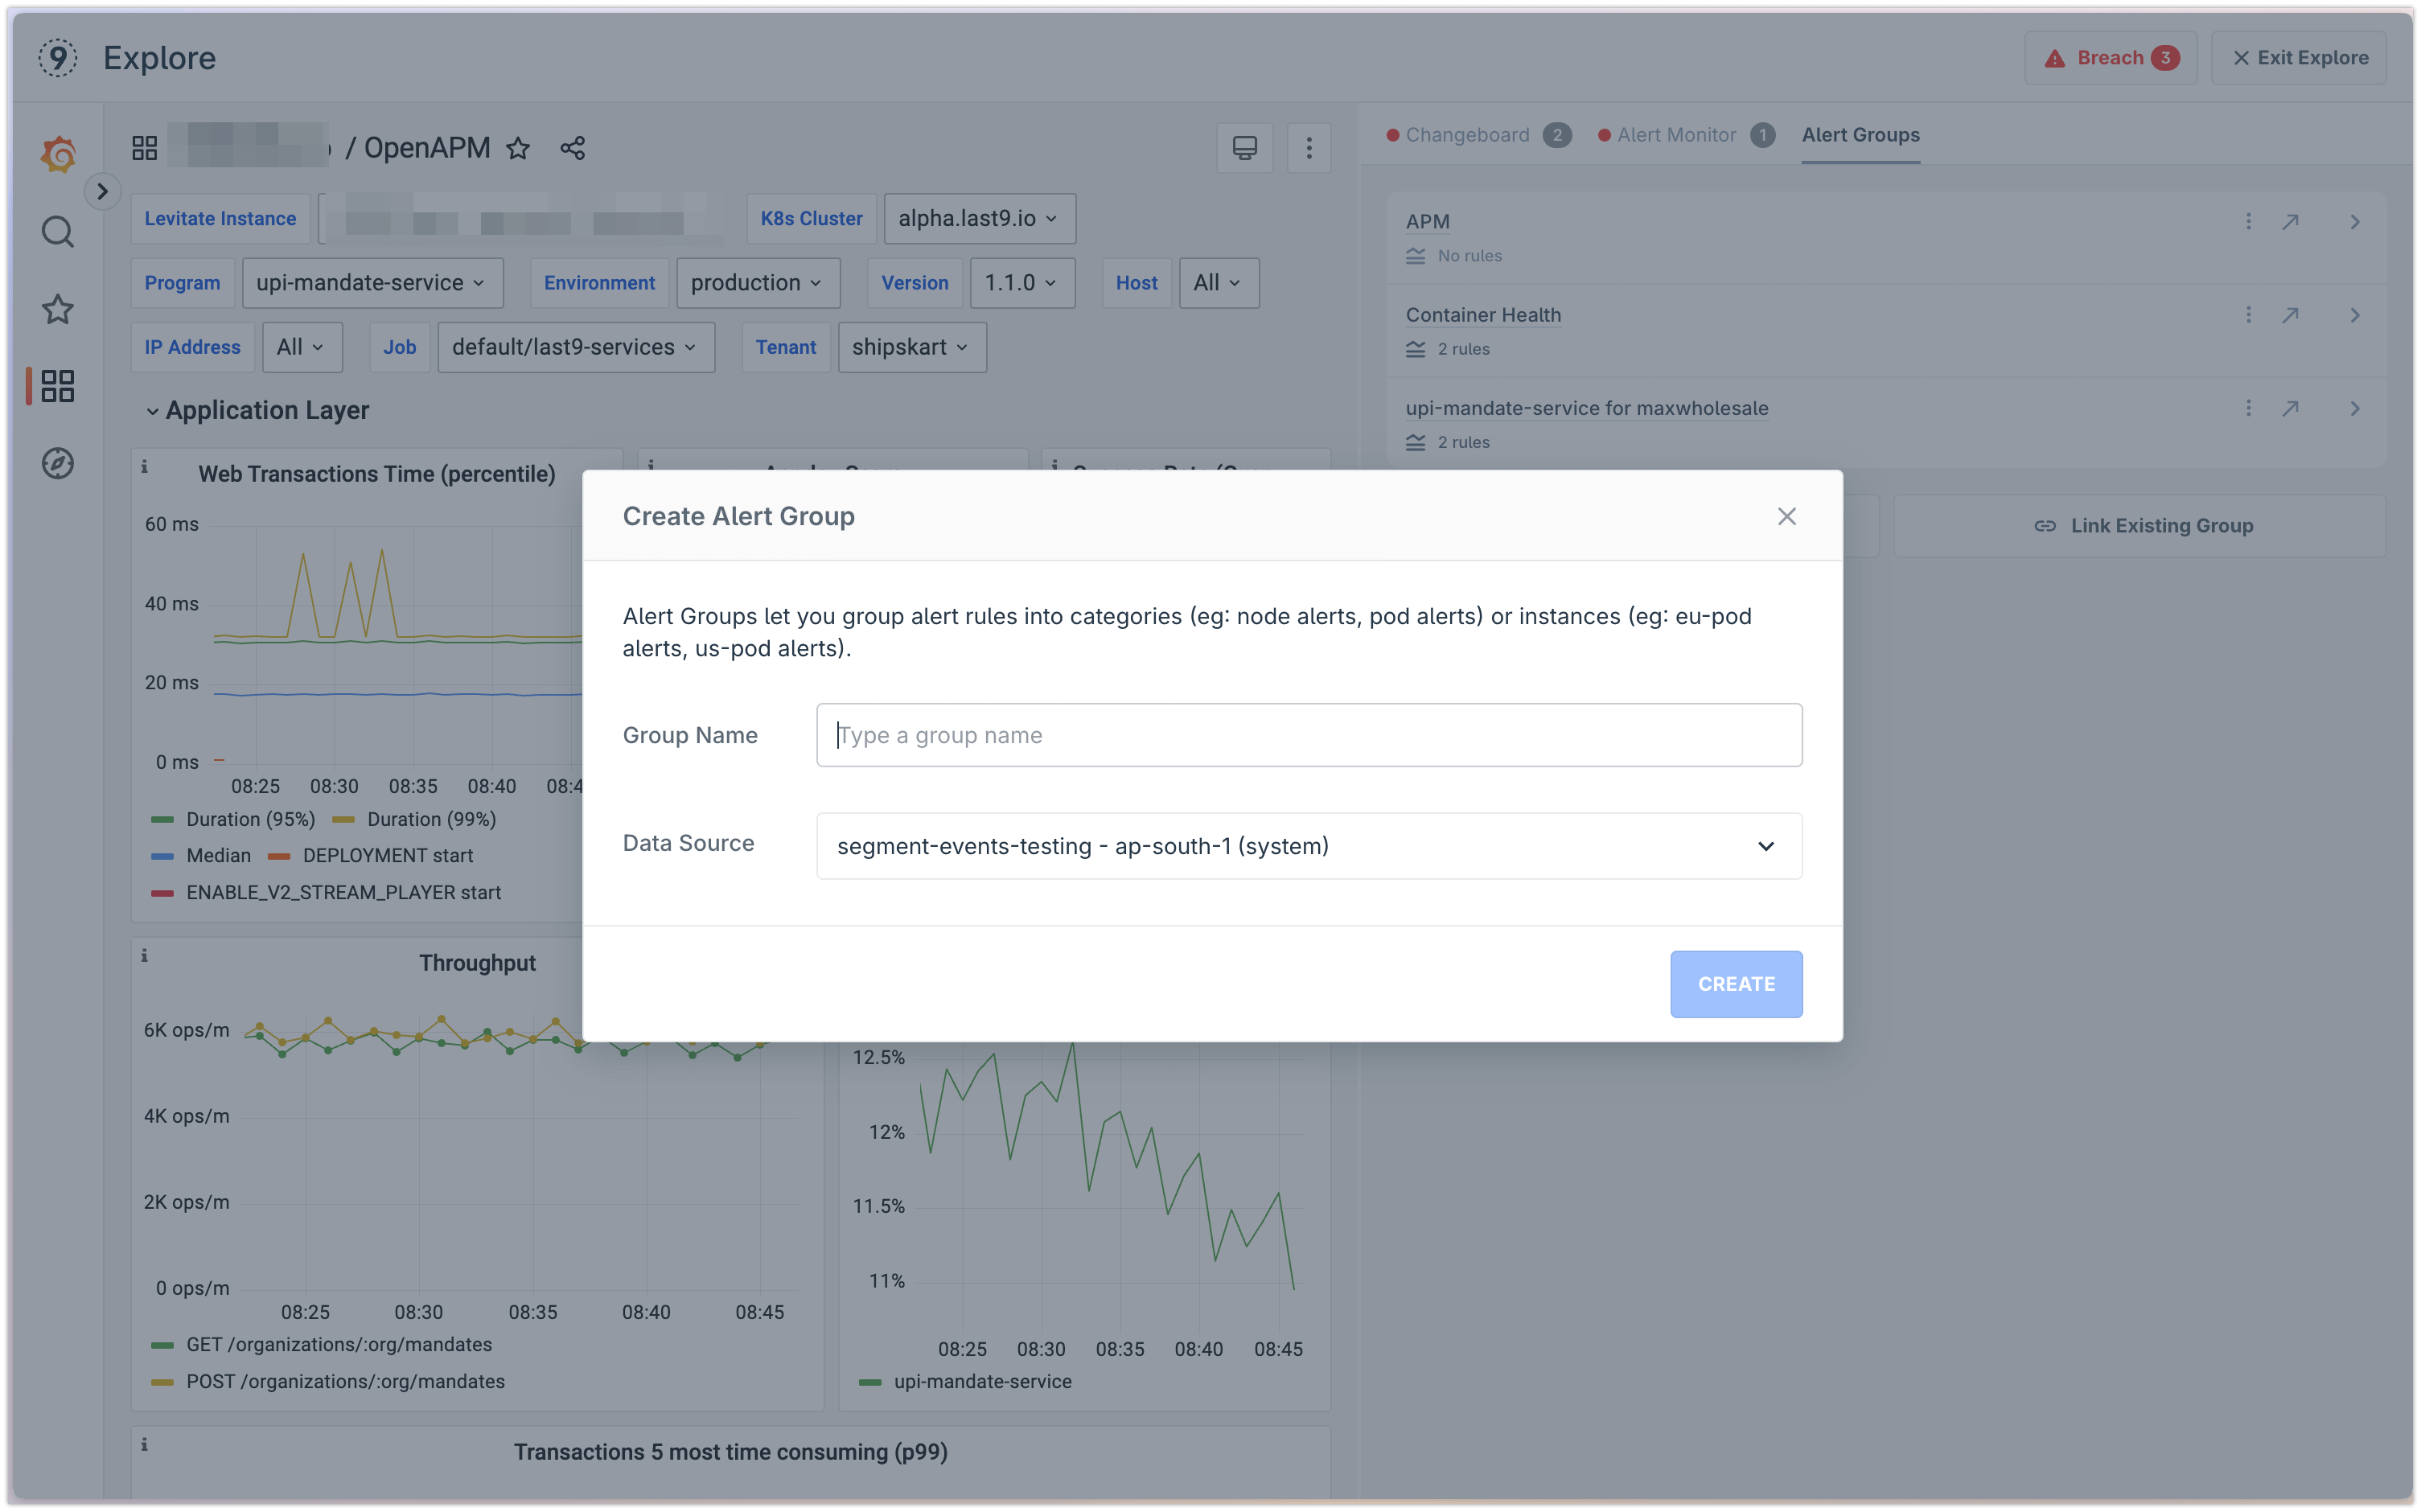
Creating an alert group from a Dashboard
Click on Create Synced Group and follow along. You can import metrics from across dashboard panels or only specific ones.
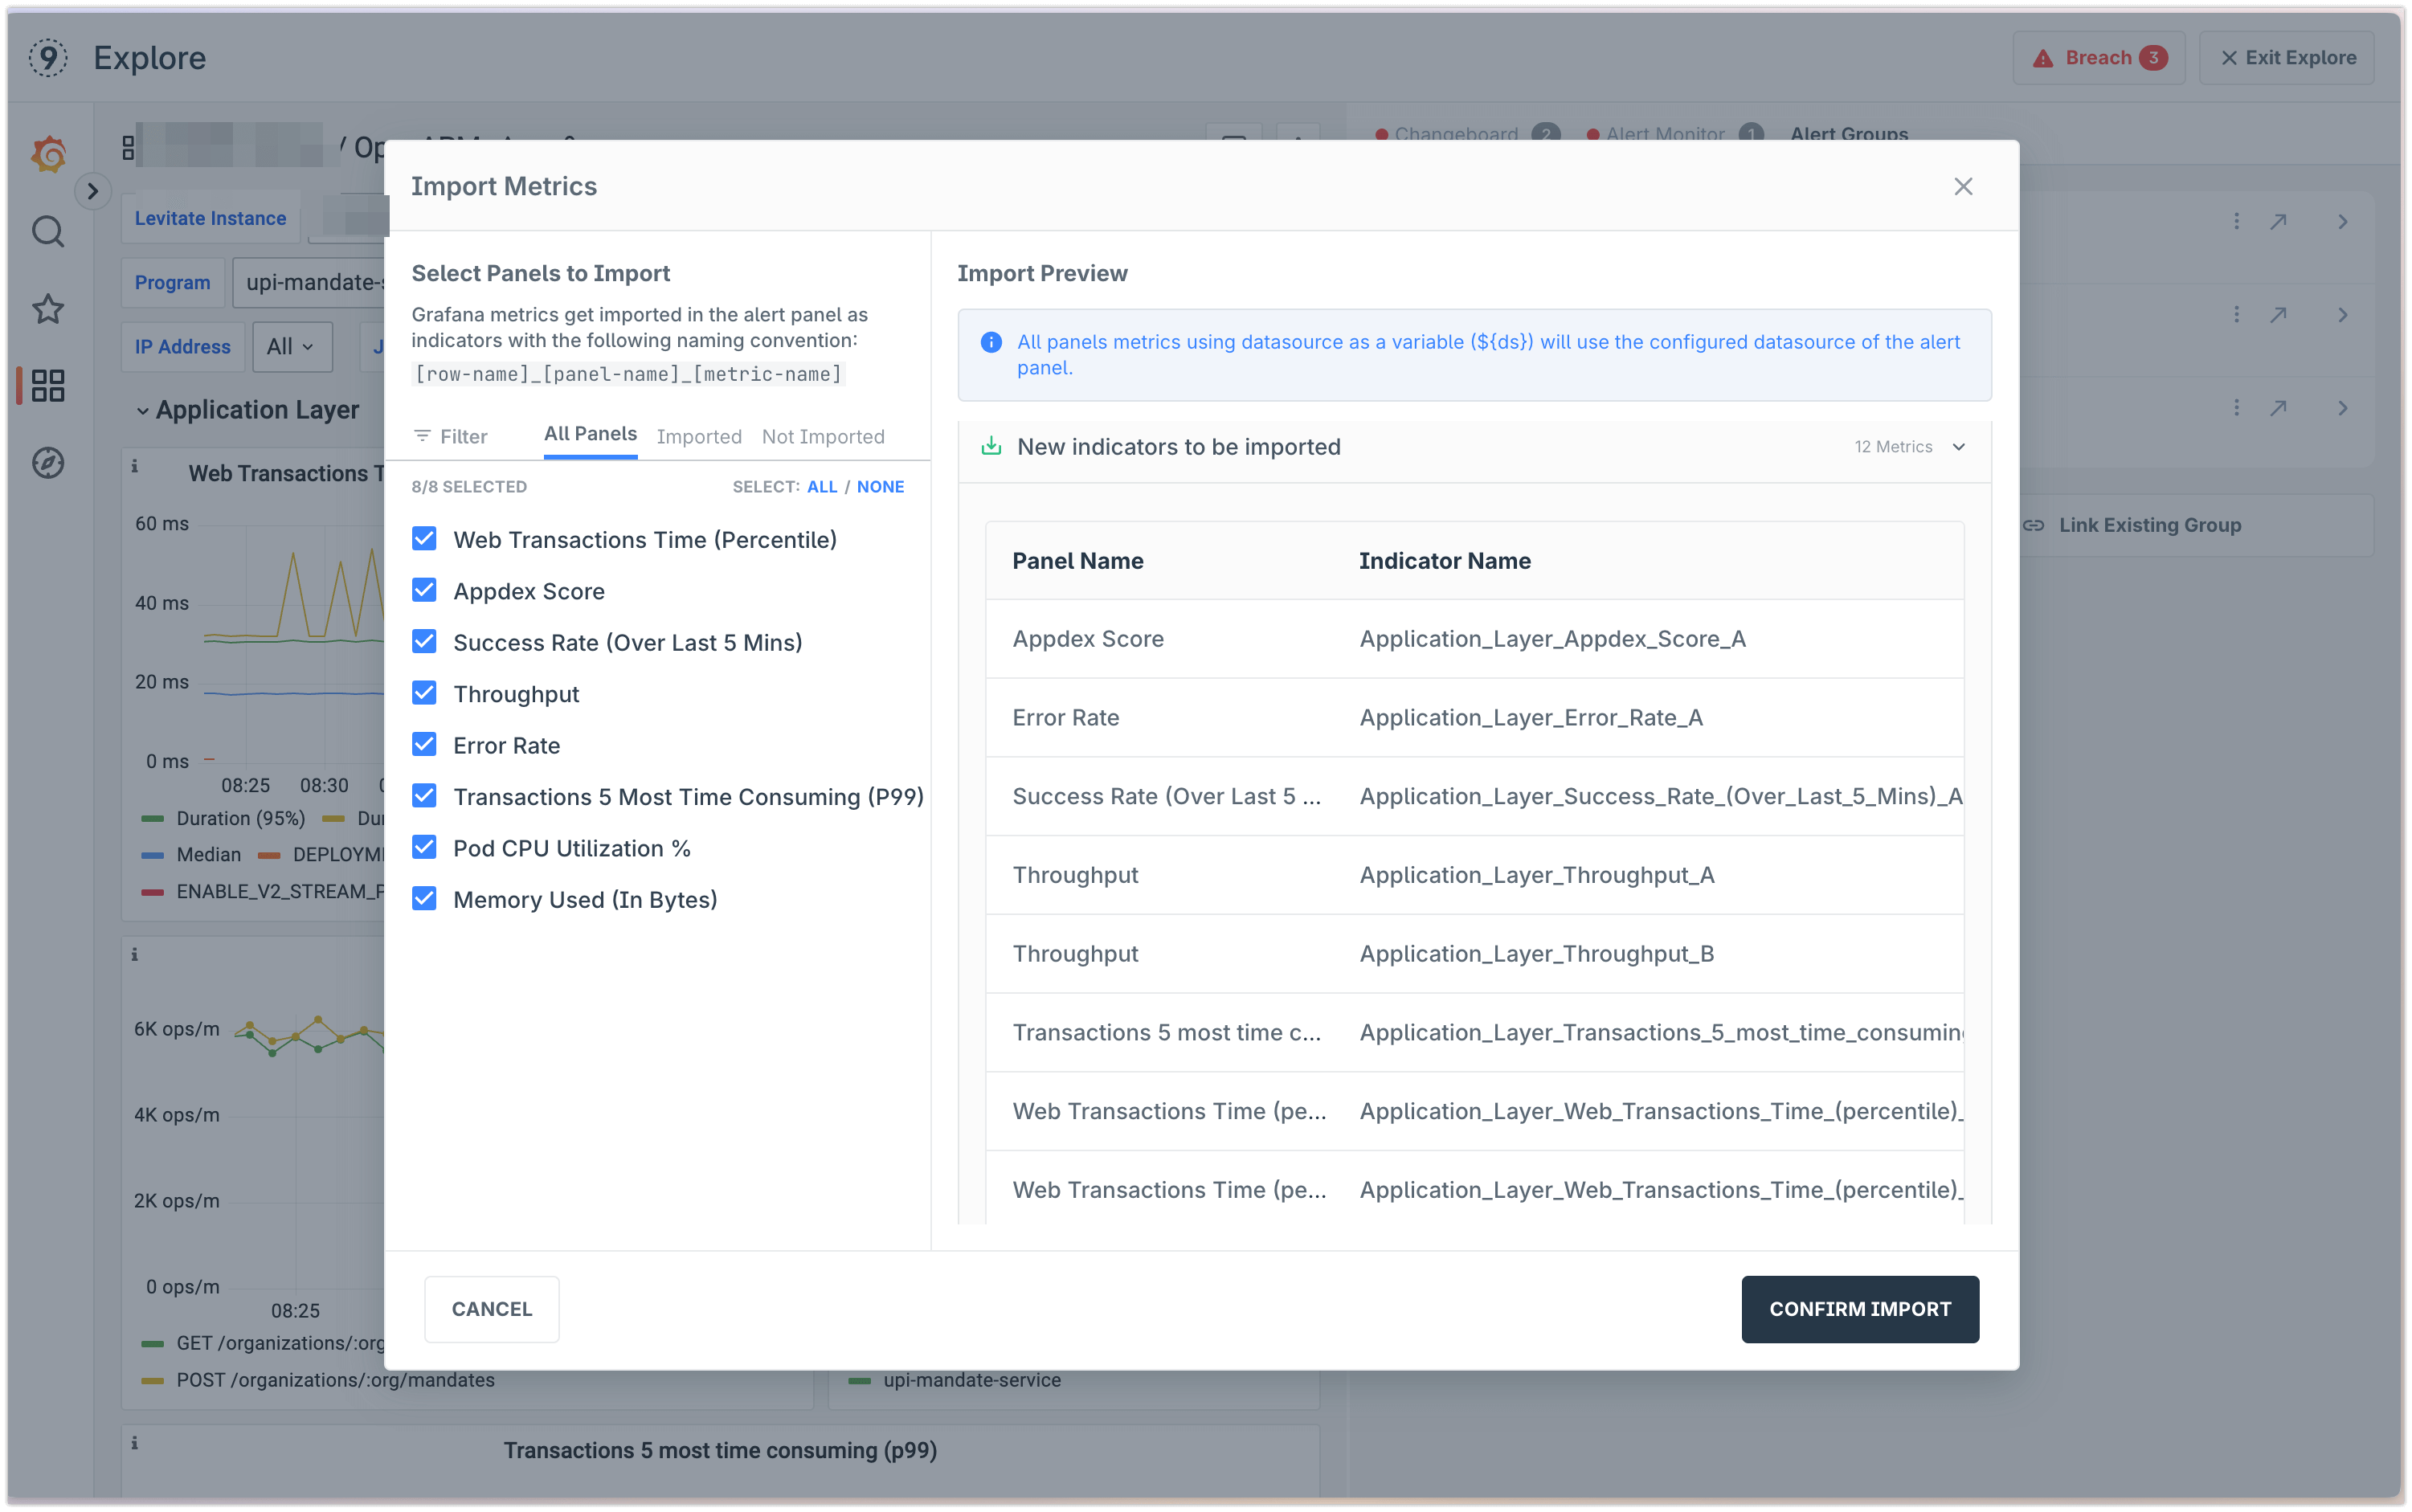
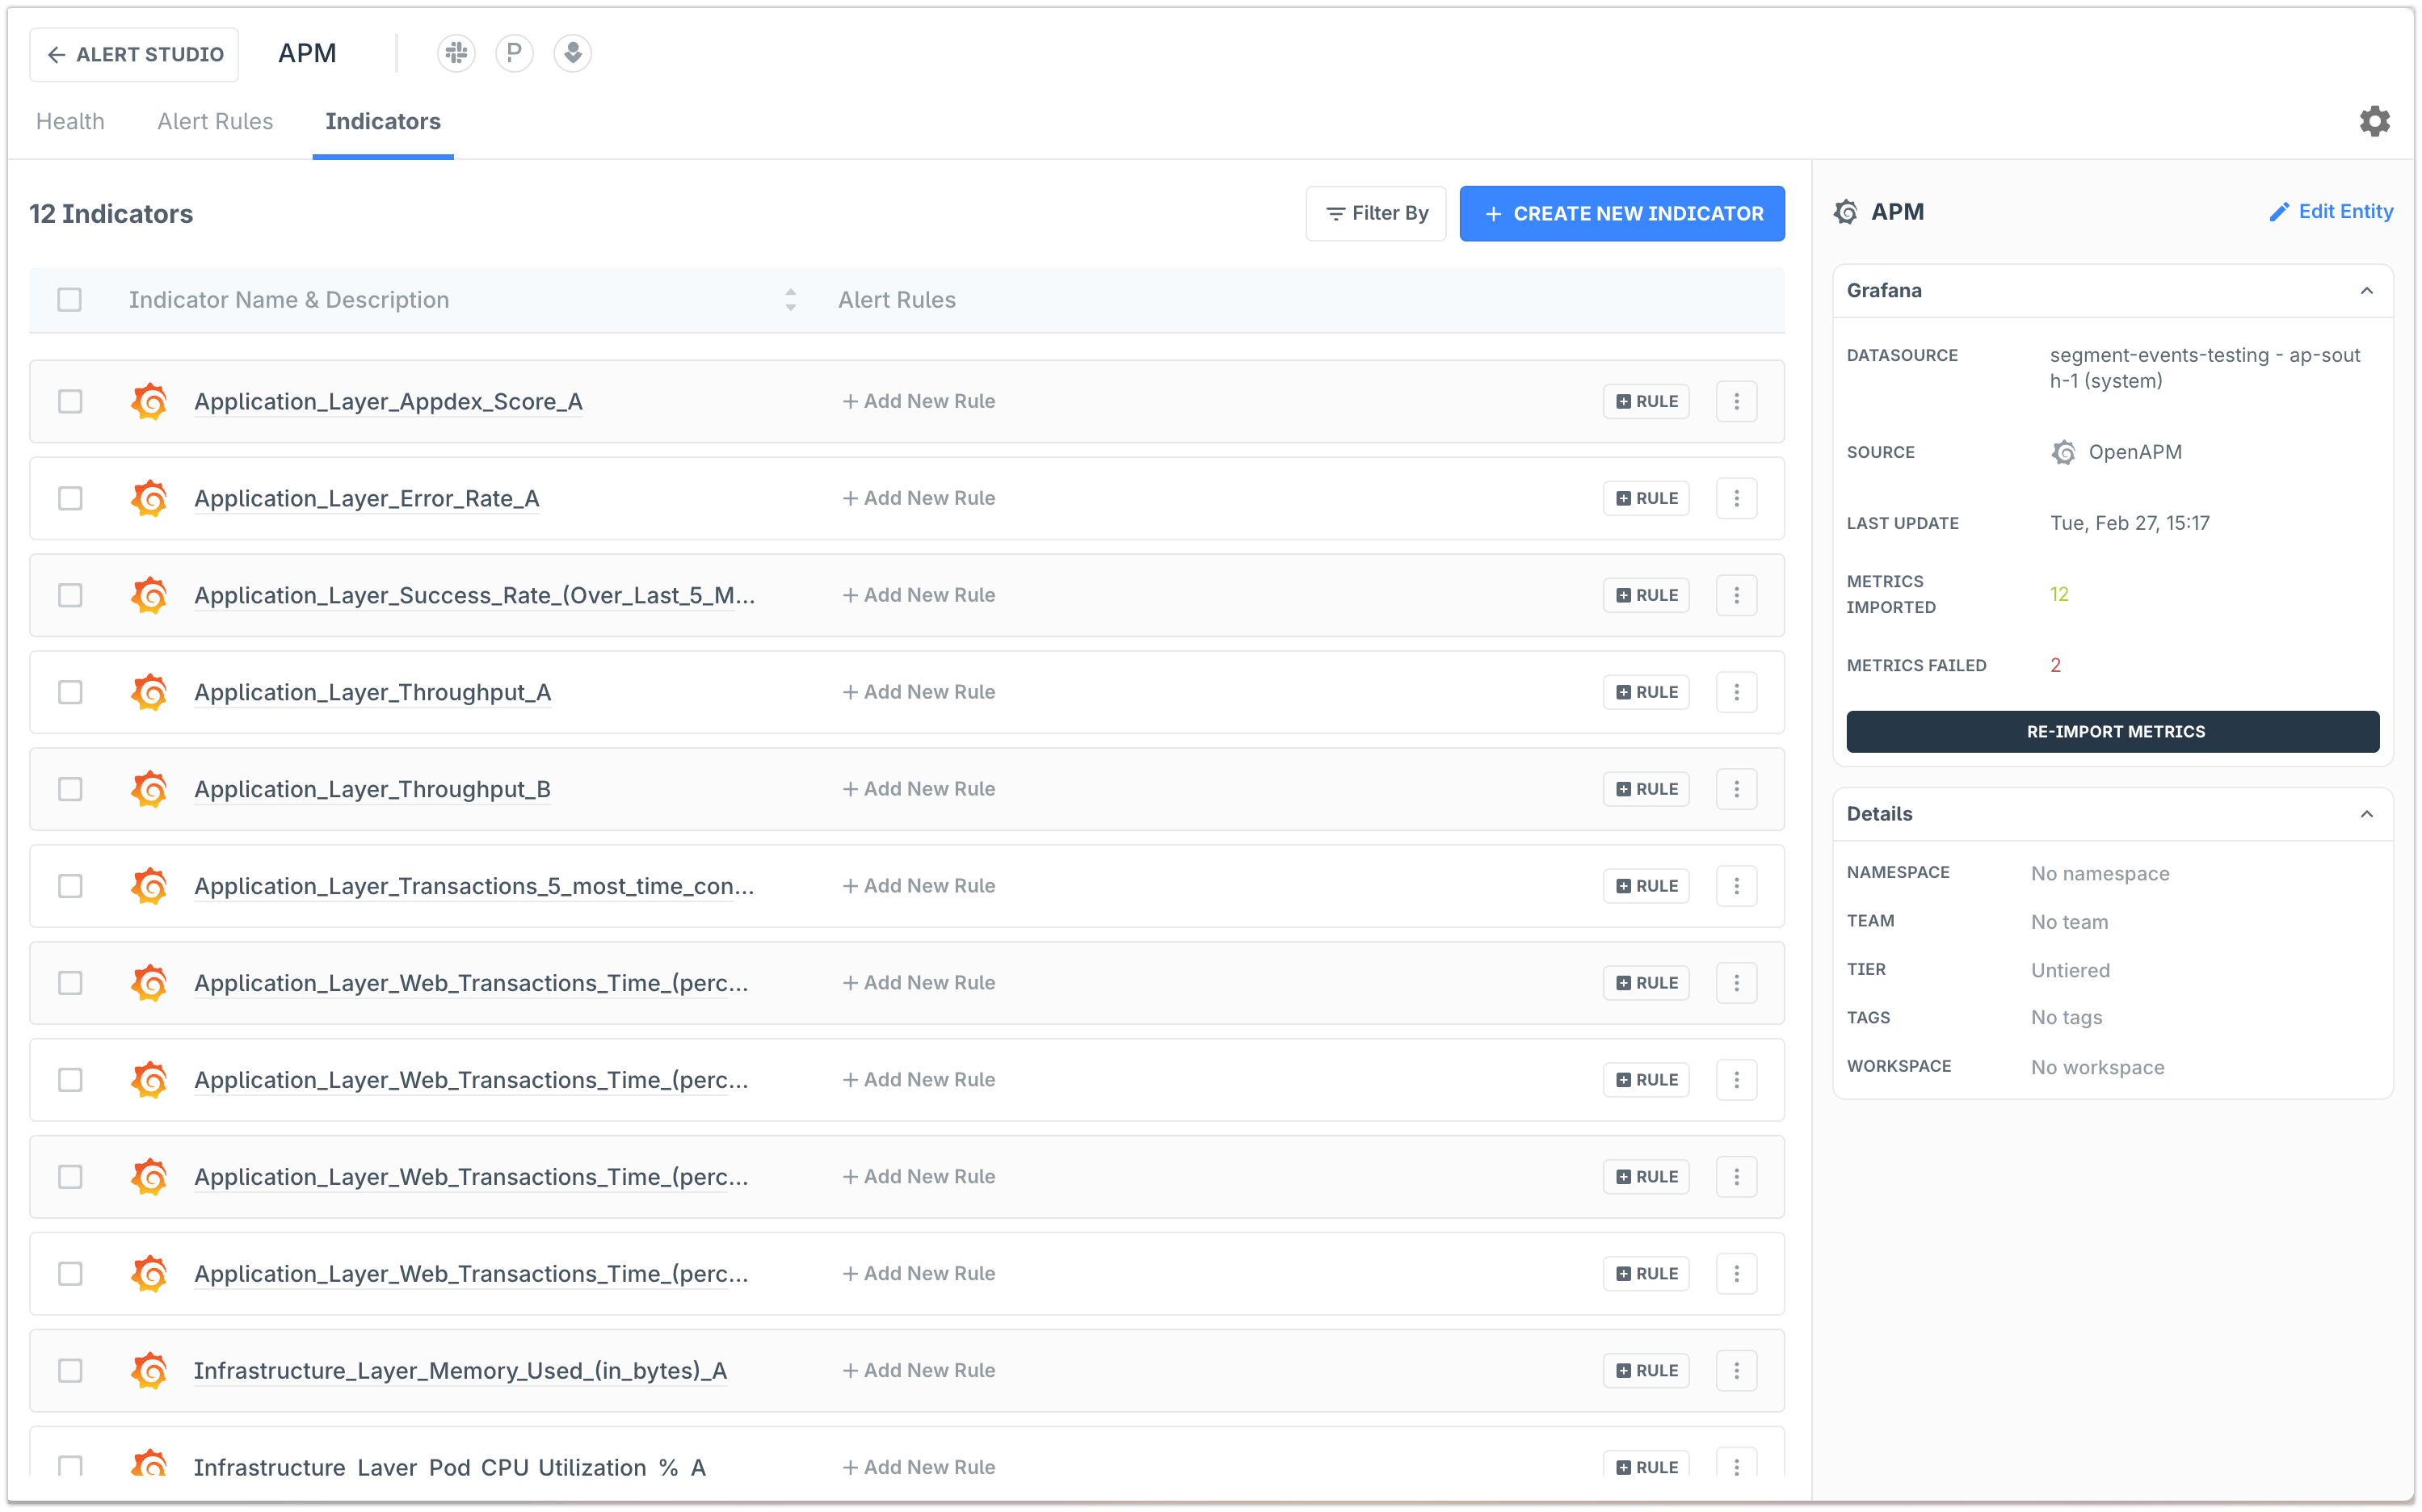
This will import all selected metrics as indicators in the synced Alert Group. This massively reduces the need to create alert rules manually via complicated PromQL queries. You define the dashboard and then, in a single click, import all metrics to define alert rules.
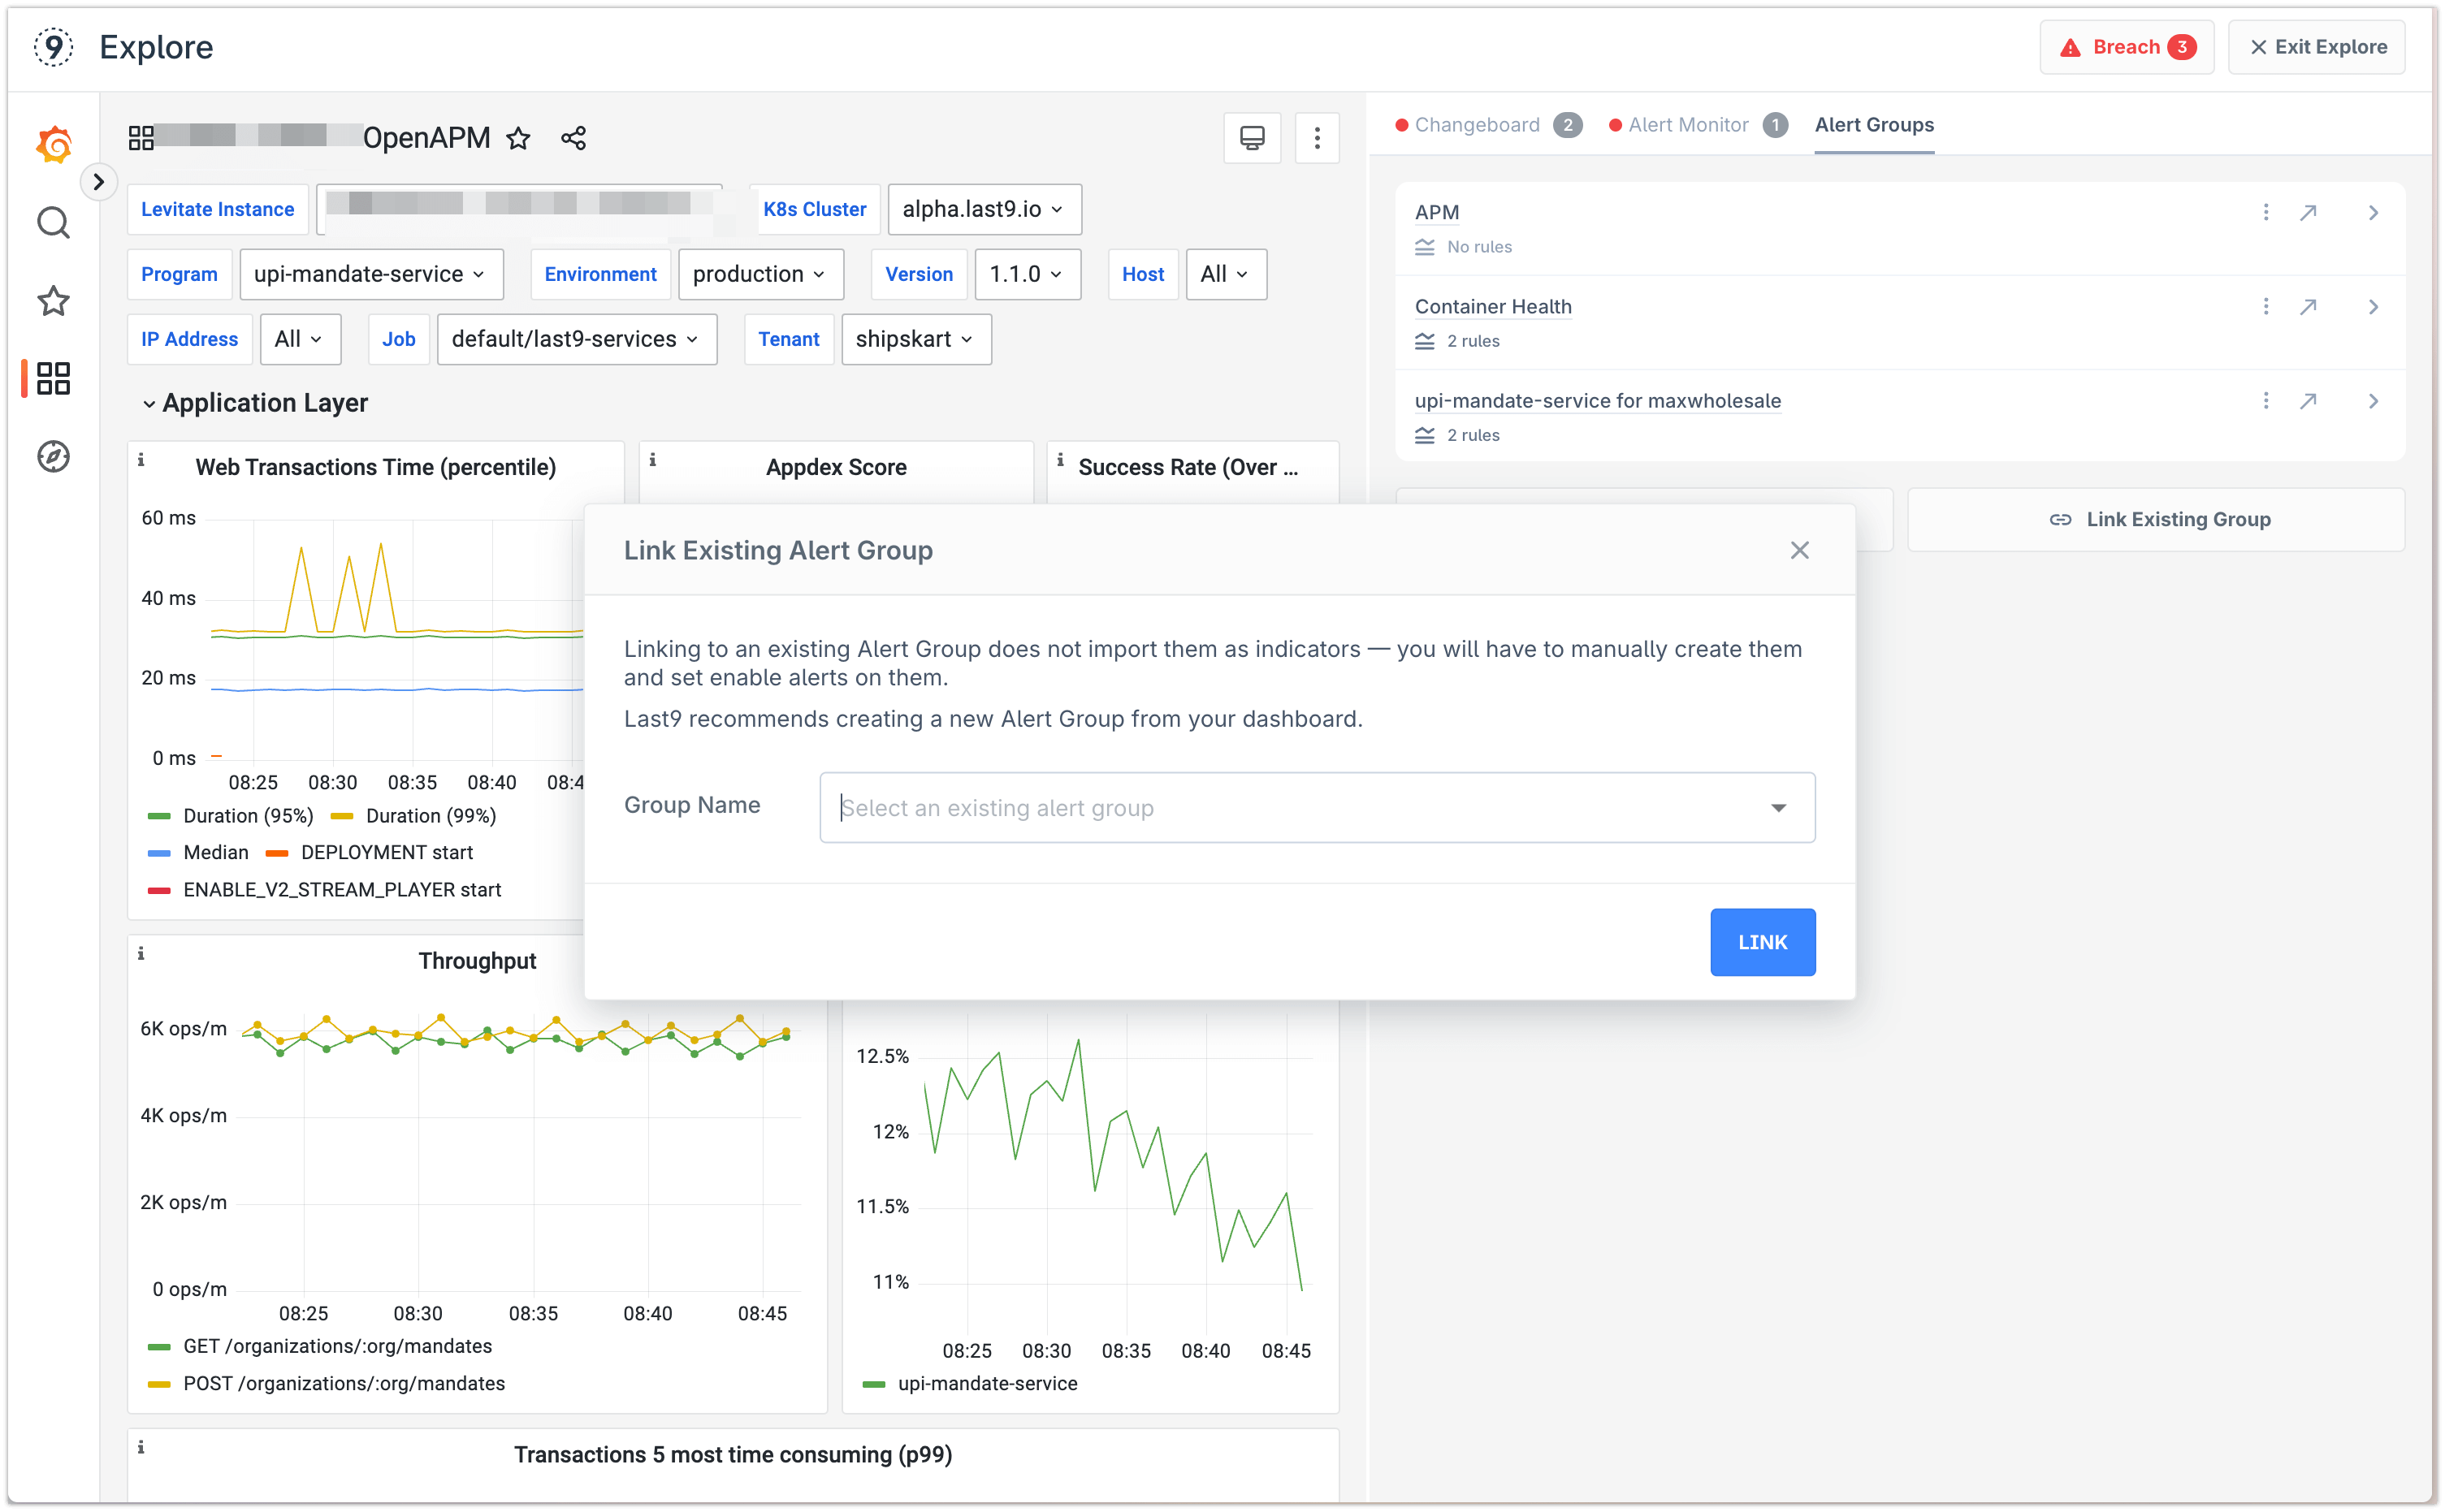
There is no limit on how many alert groups you can link to a dashboard. Additionally, you can also link an existing alert group as well.
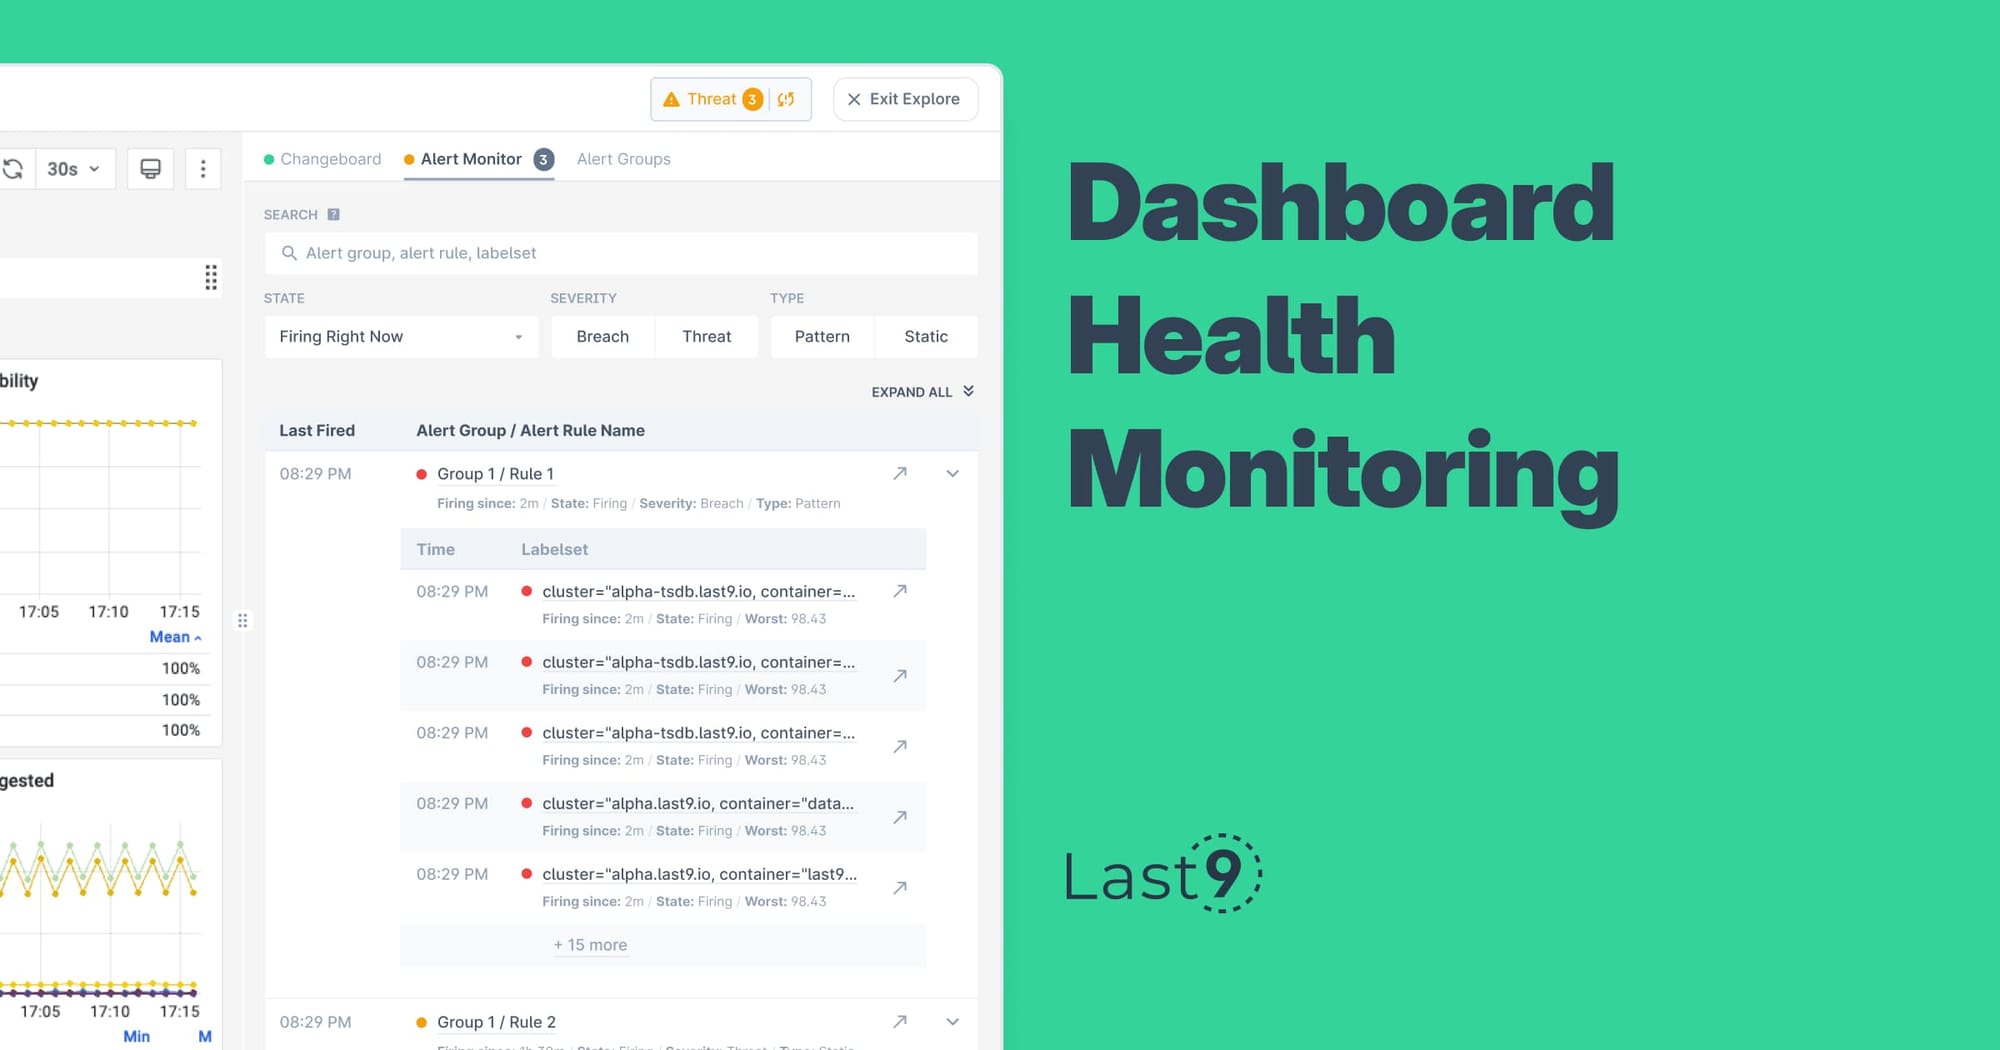
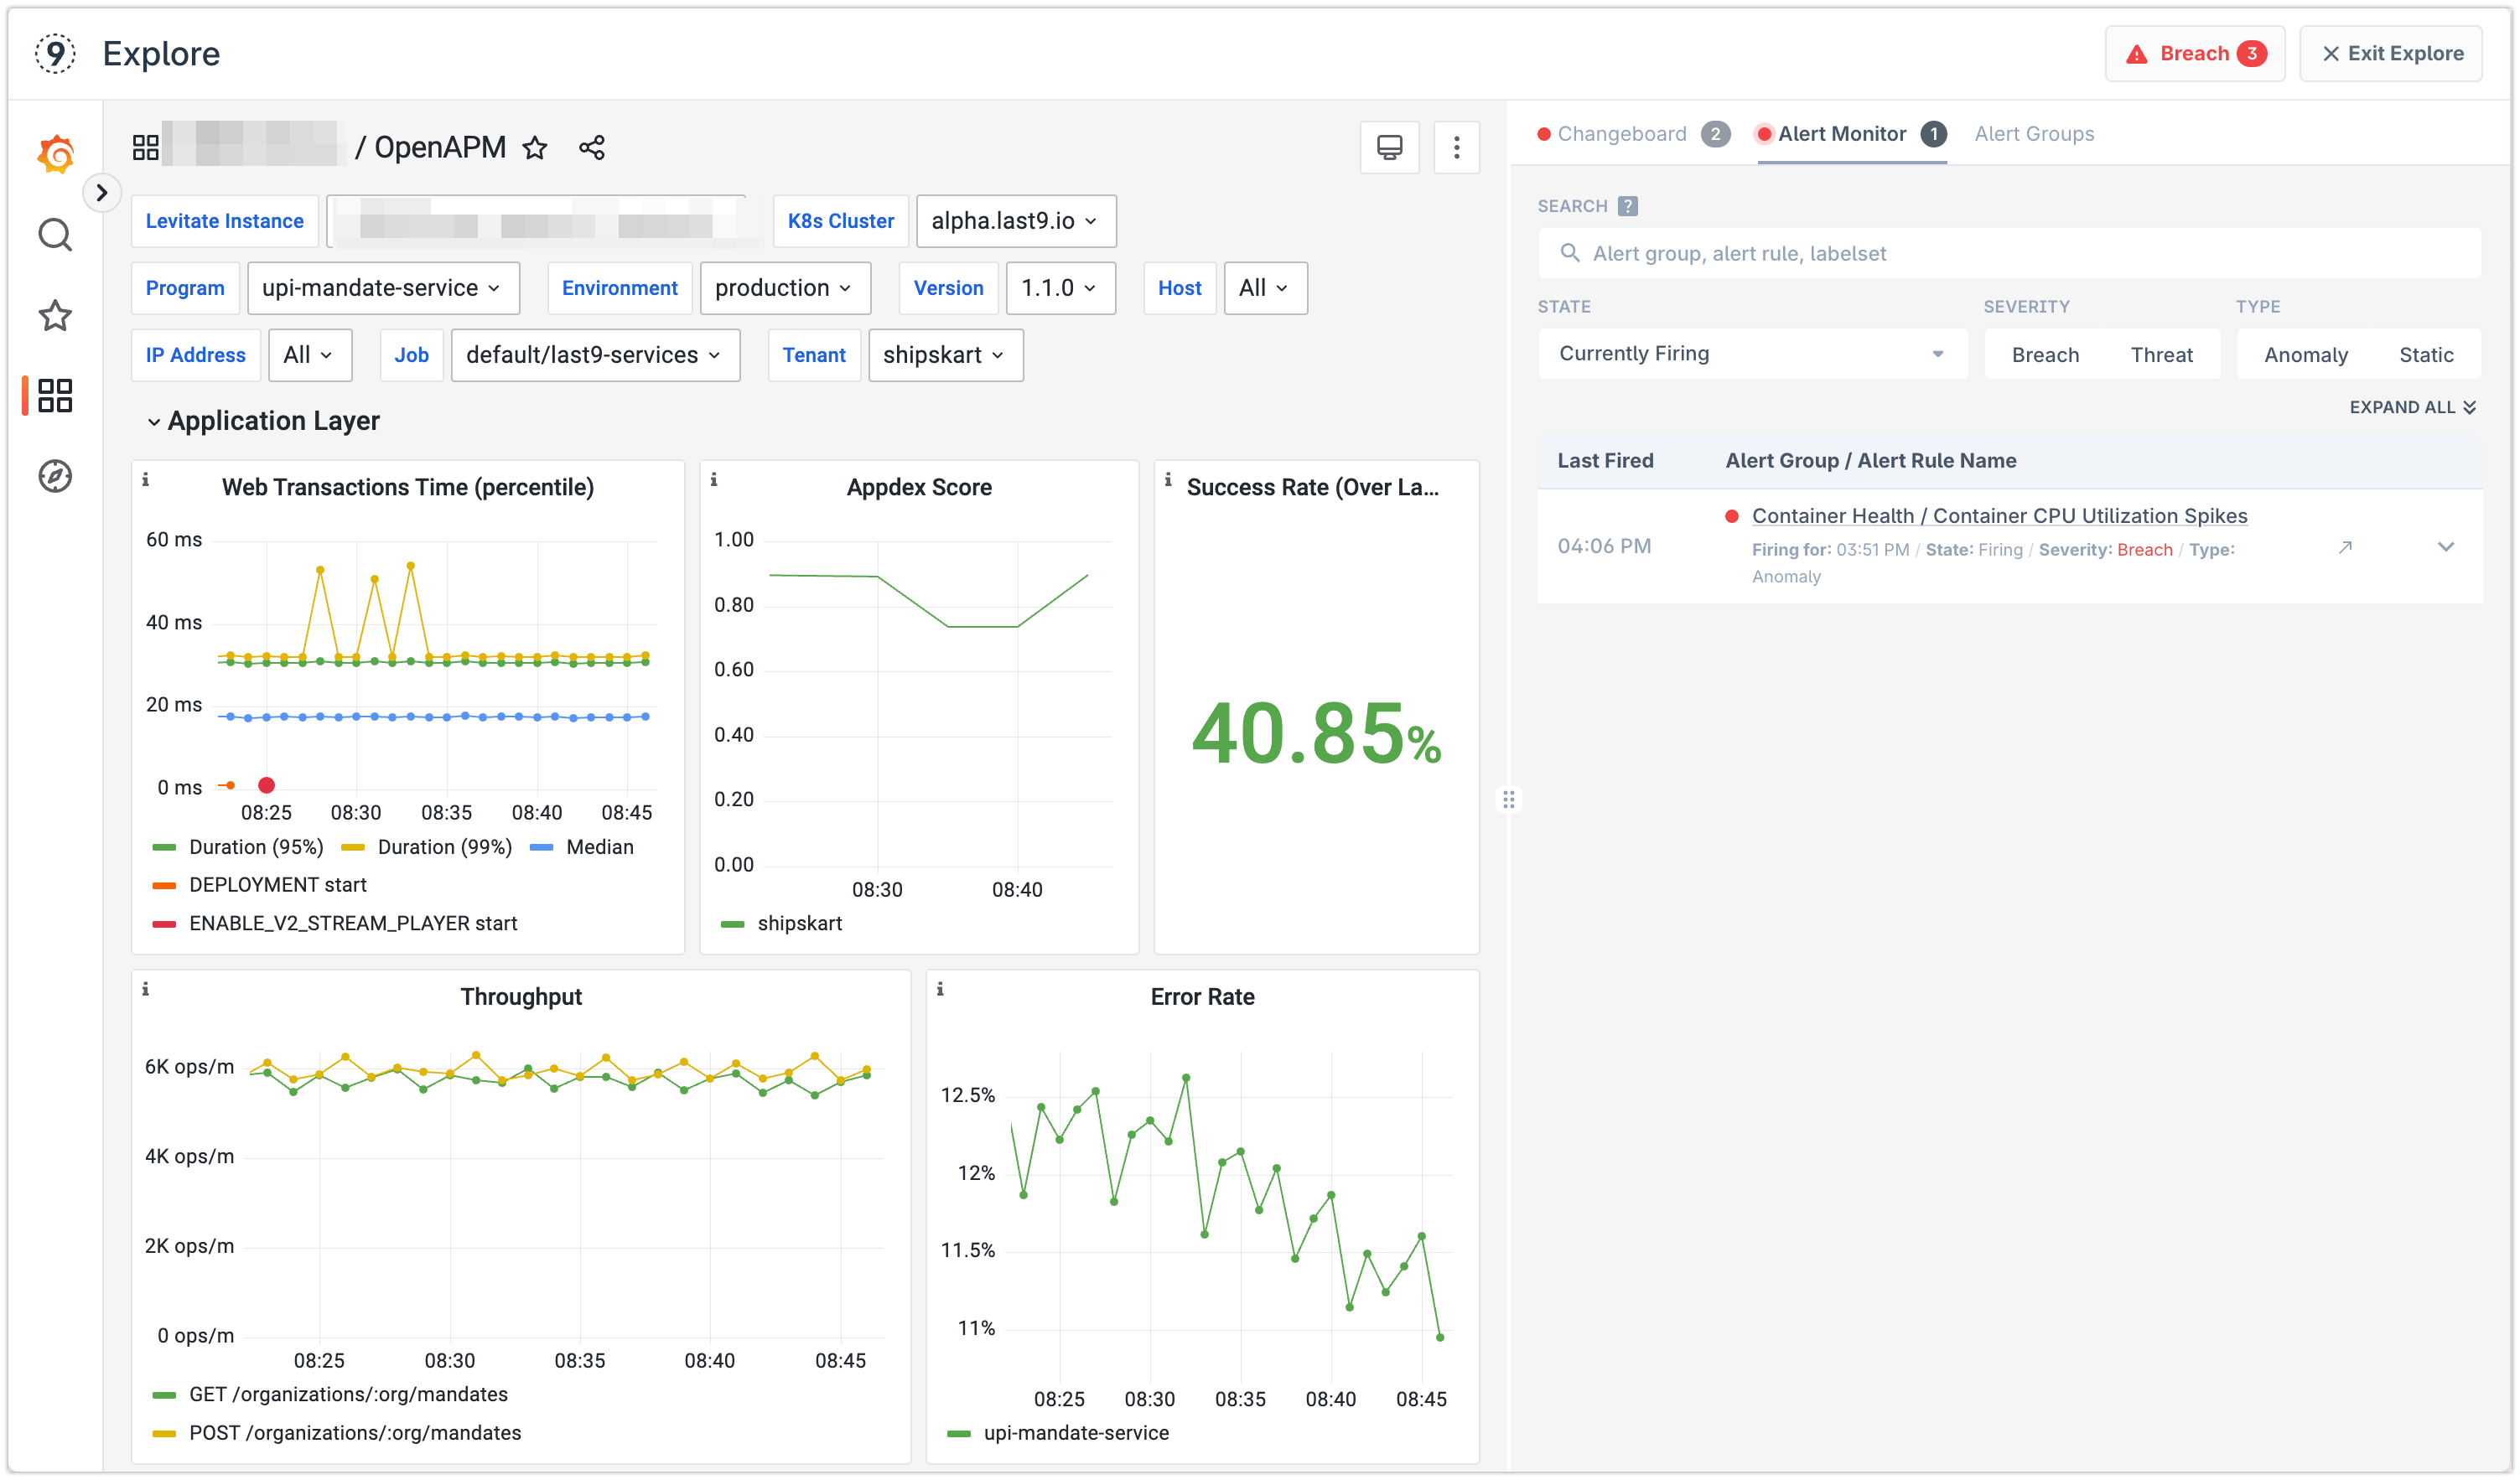
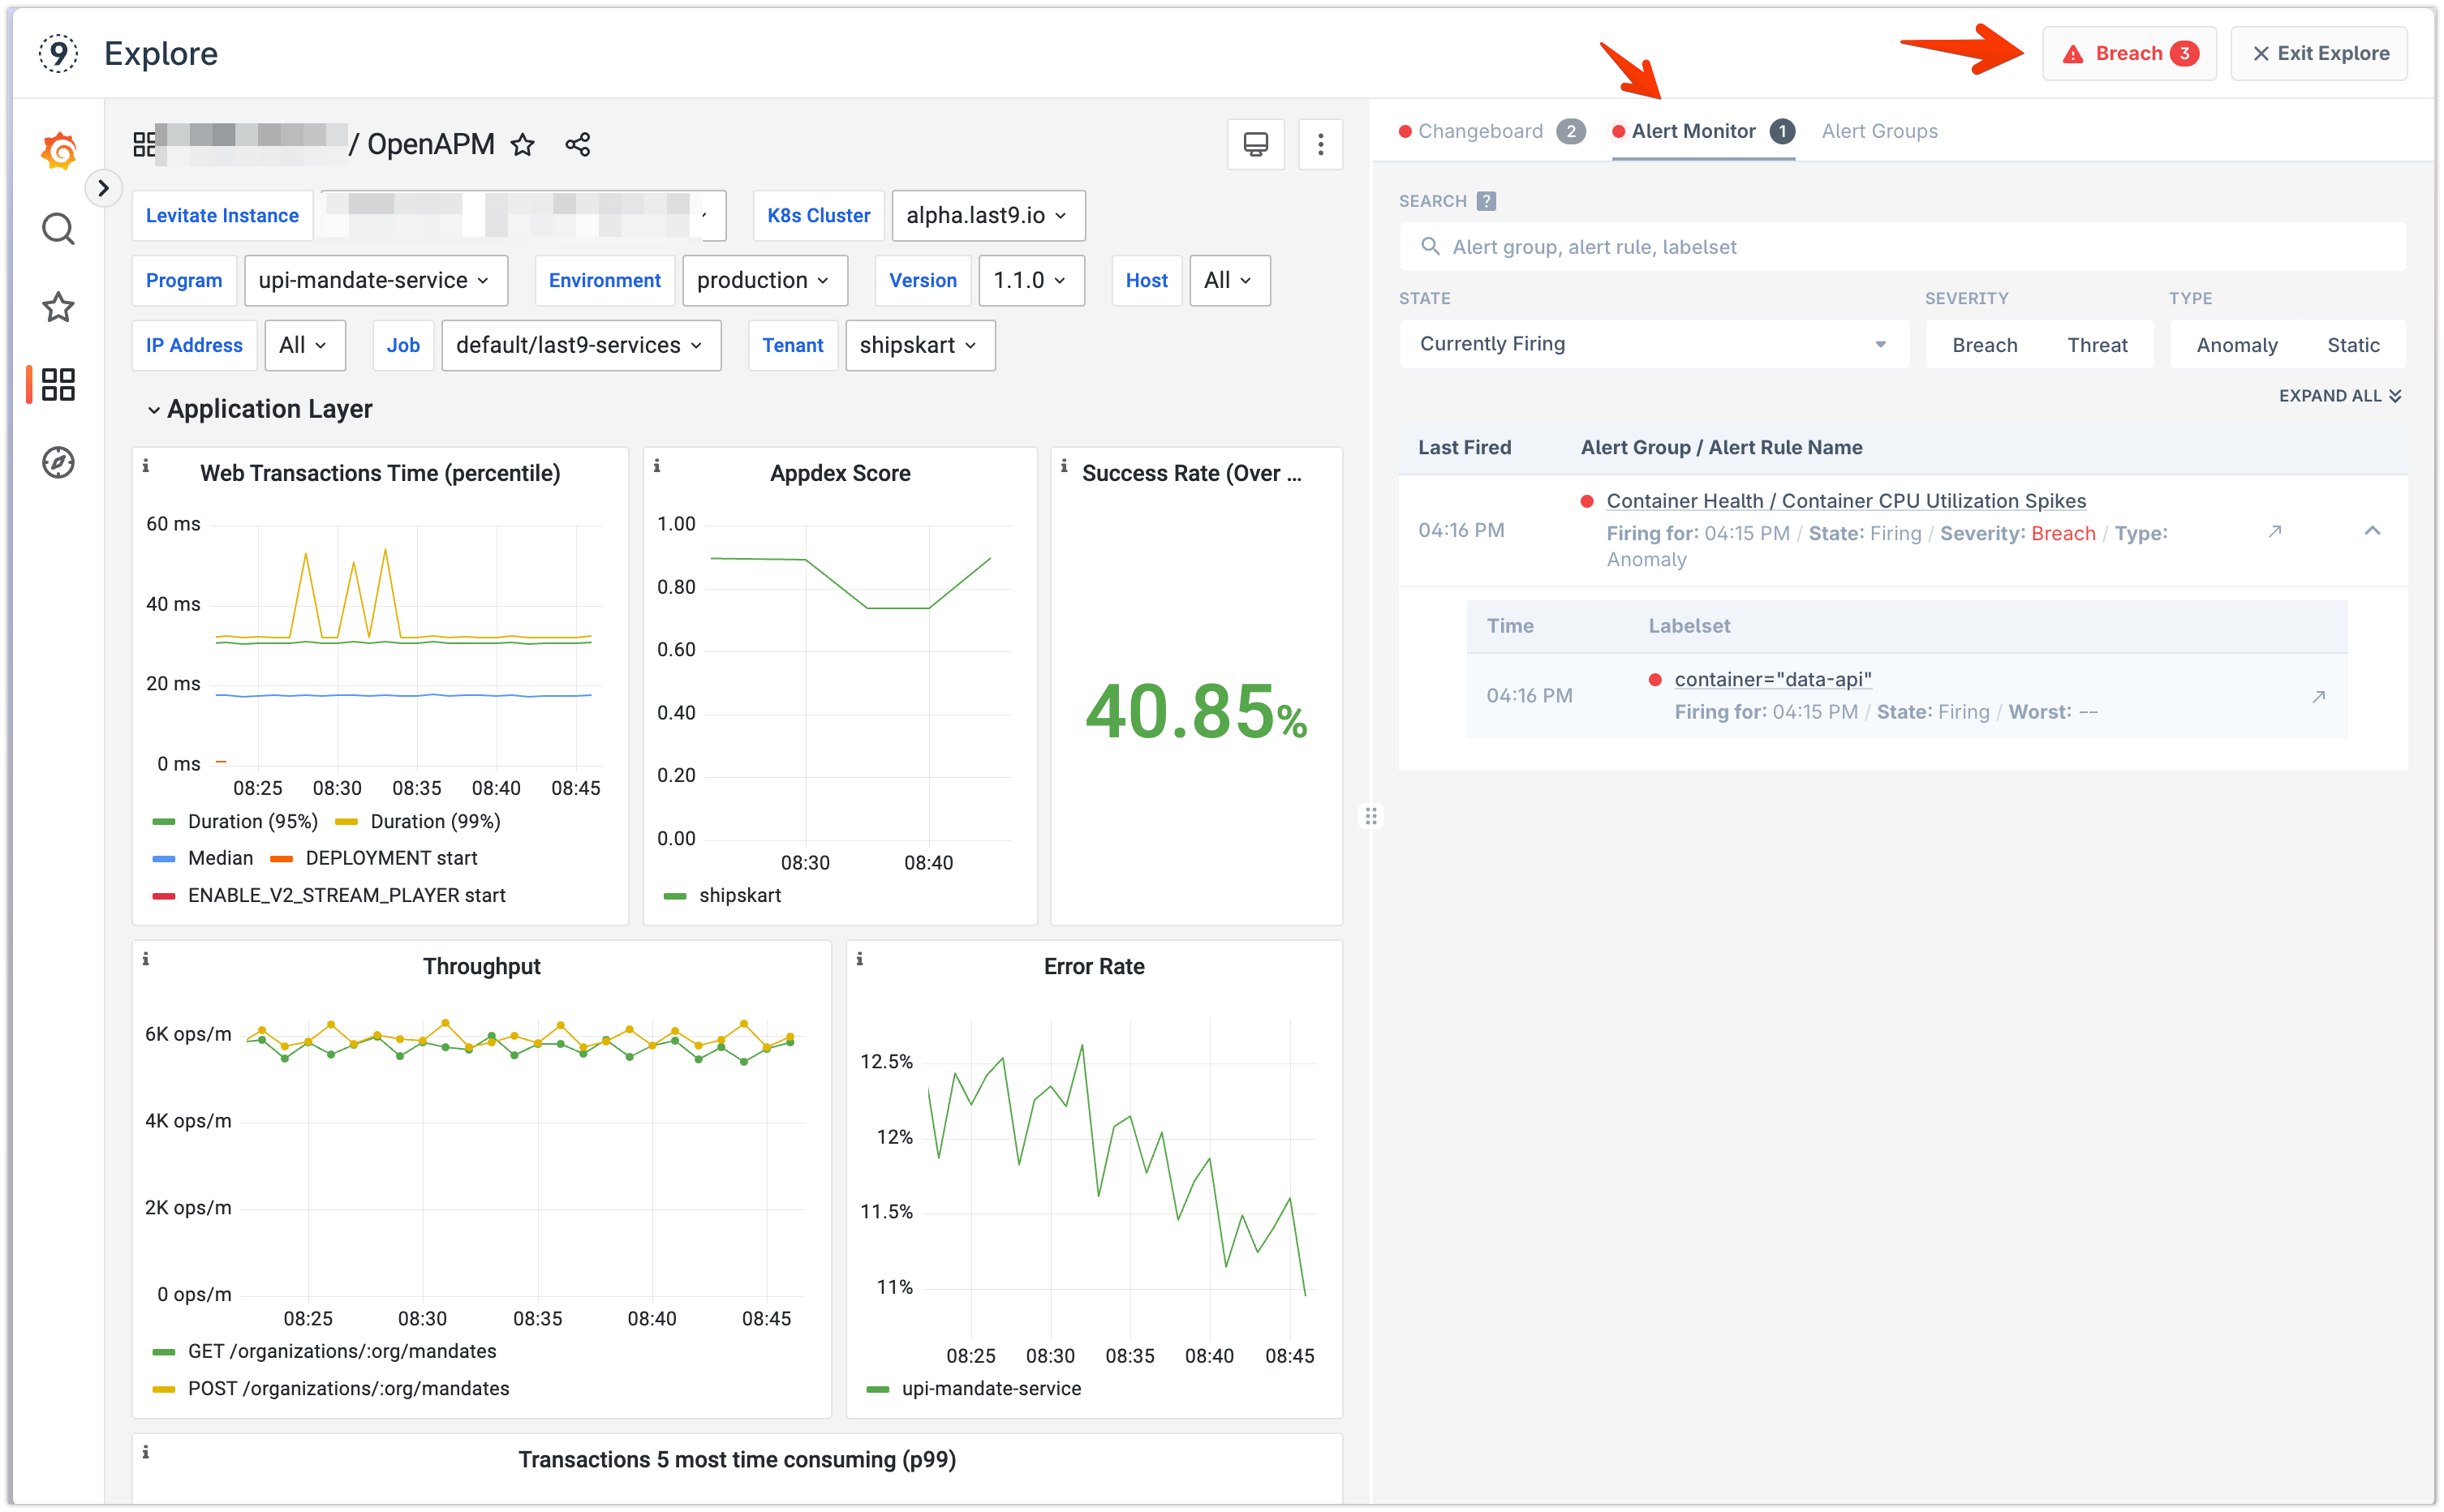
Monitoring Health
Using the Alert Monitor view, it becomes straightforward to keep monitoring the health of alert rules linked to the Grafana Dashboard.
The Alert Monitor view auto-refreshes every minute, so the status is real-time.
You can also link Changeboards to a Dashboard.