
Predicting the future is hard, especially with metrics-based monitoring systems, because metrics cardinality can snowball. This is important because it affects query performance adversely. Having visibility into what’s happening now and workflows to manage cardinality is crucial. Because the answers depend on the quality of questions, a system allows you to ask.
The questions one may have is:
- Which metrics have high cardinality? Is it all metrics or only a few?
- Is it happening suddenly, or has it been happening for a while?
- Can I see the individual metric’s cardinality?
- What percentage of this metric contributes to the overall cardinality of a cluster?
- Can I see the top labels that are the culprits?
- Can I see the trend of cardinality over a week or two?
Introducing Cardinality Explorer to answer this and many more questions so you can get complete visibility into what’s happening with your metrics and make informed decisions instead of just dropping labels randomly or shutting off the instrumentation.
You will use the following workflow with Levitate to understand and manage high cardinality metrics.
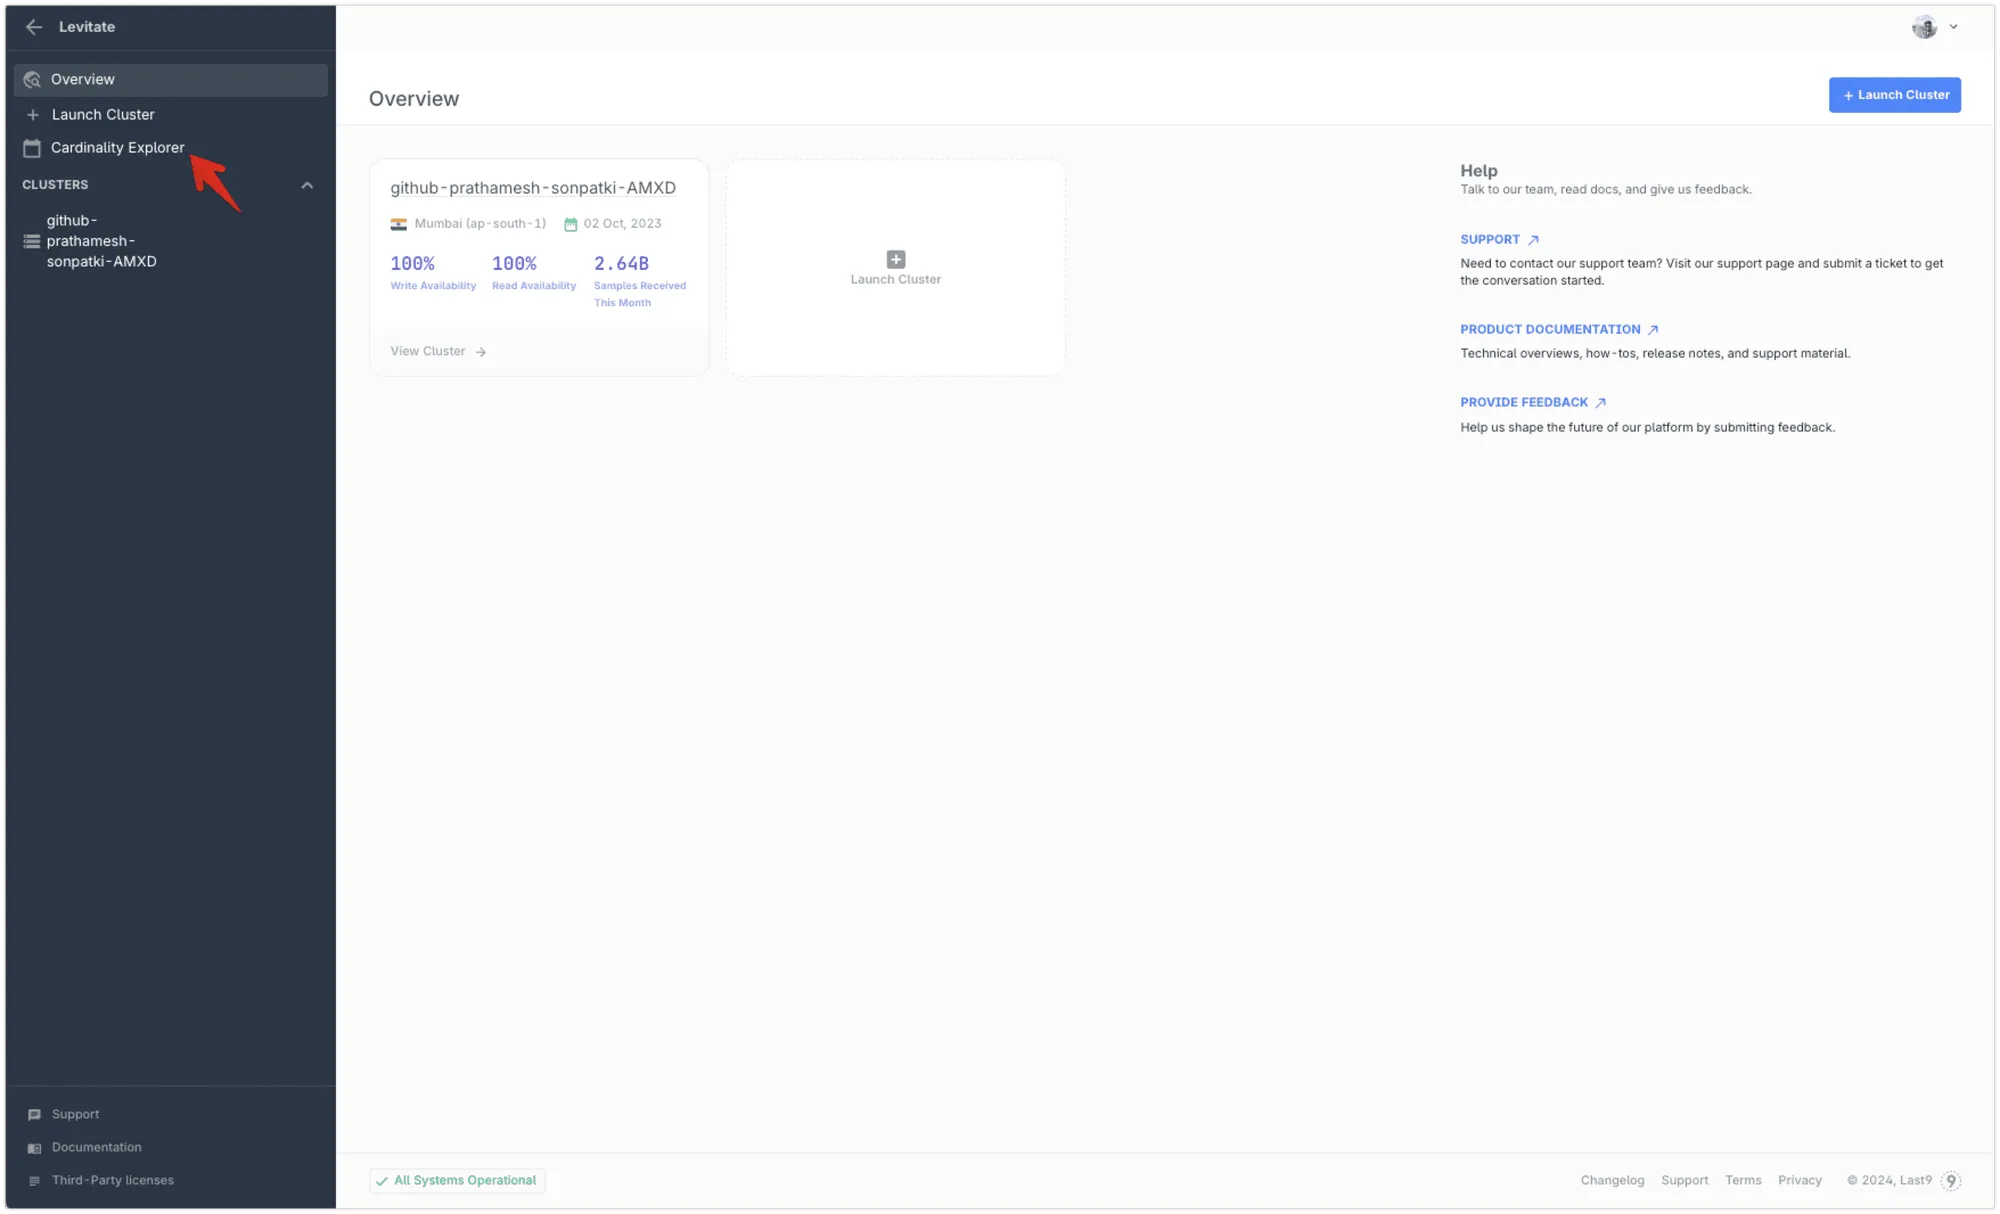
- Launch Cardinality Explorer
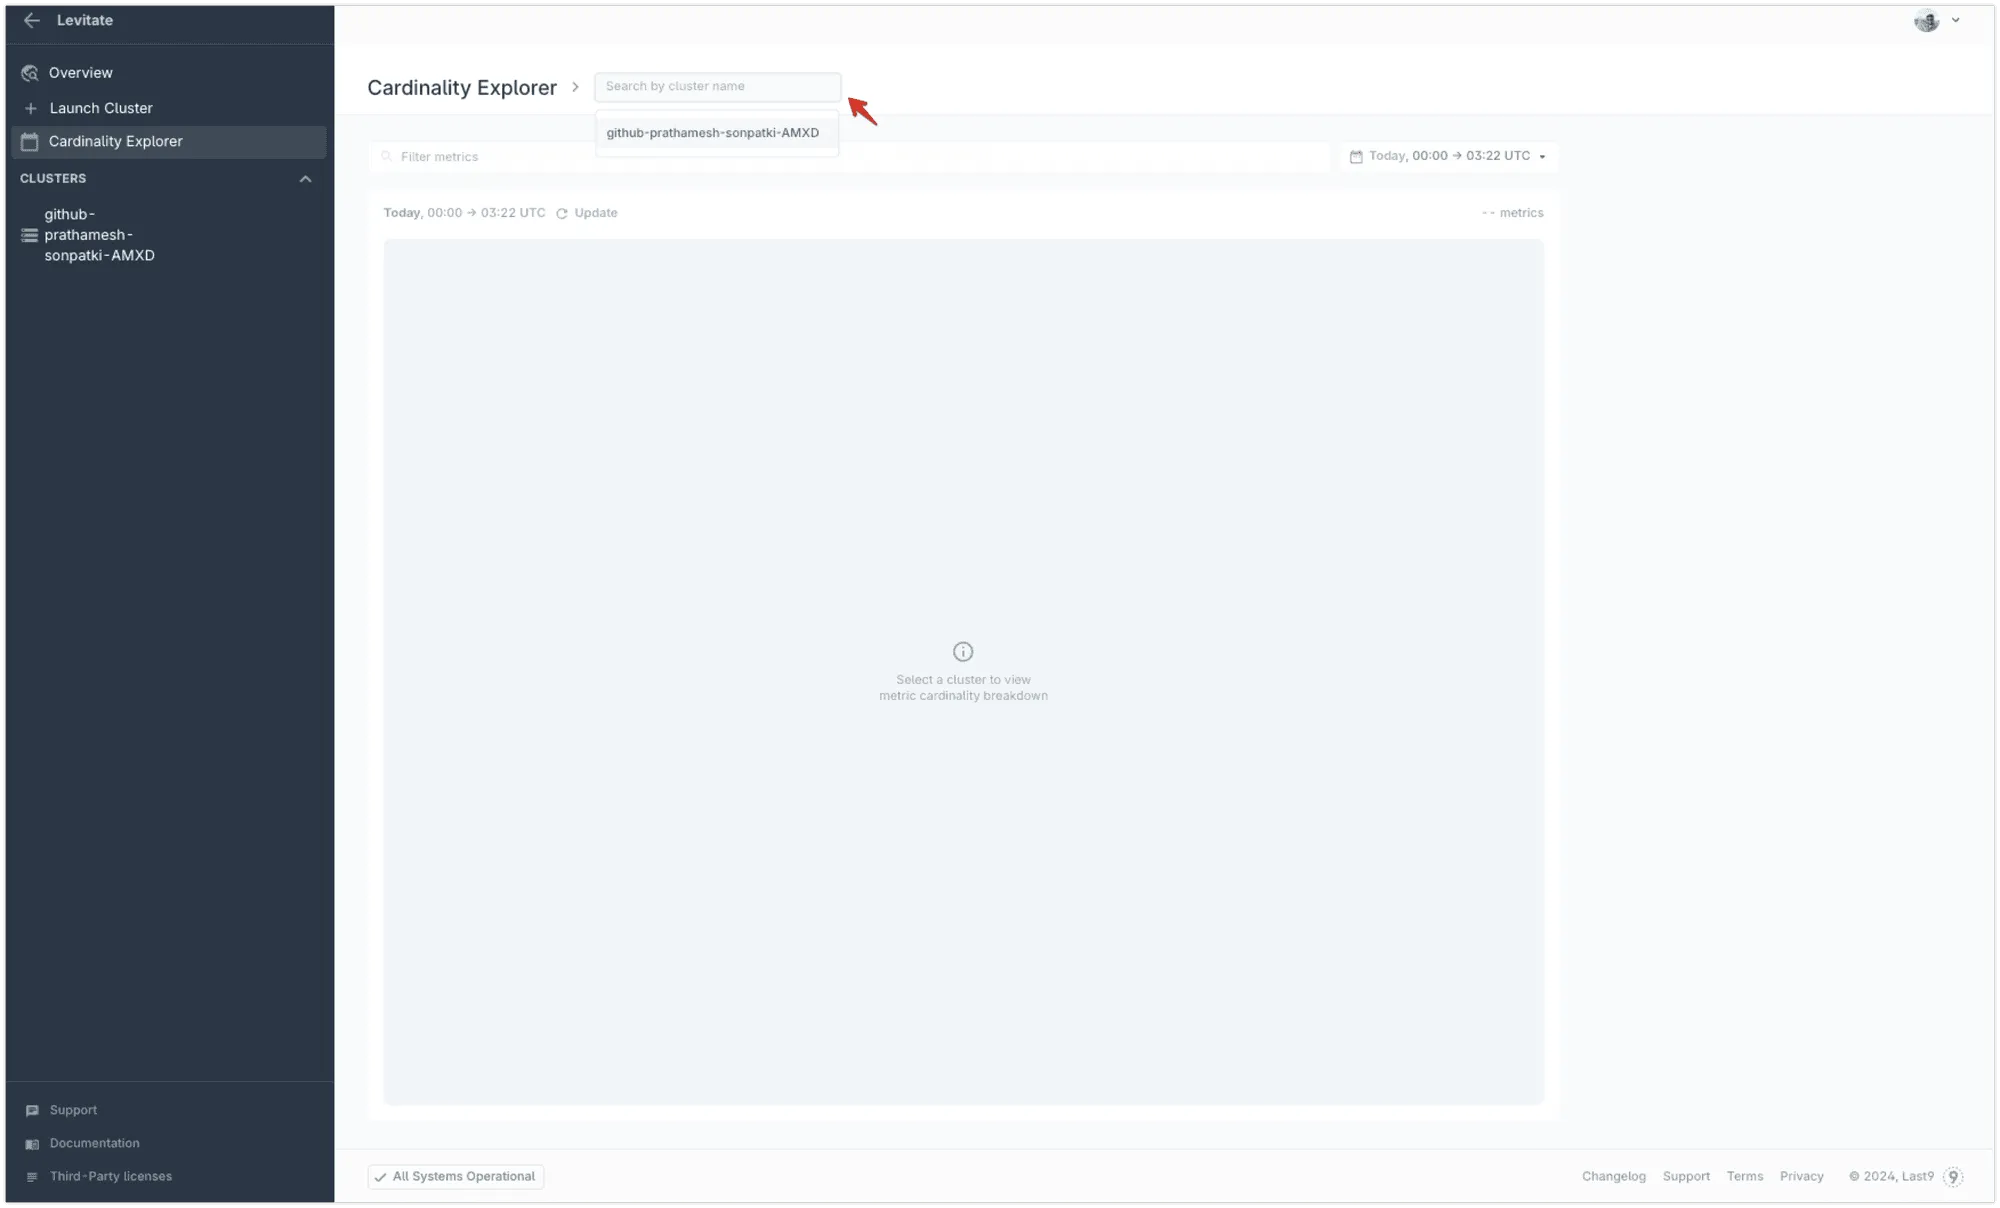
- Select the Levitate cluster for which you want to explore the cardinality.
- See the list of all metrics and their contribution to the cardinality.
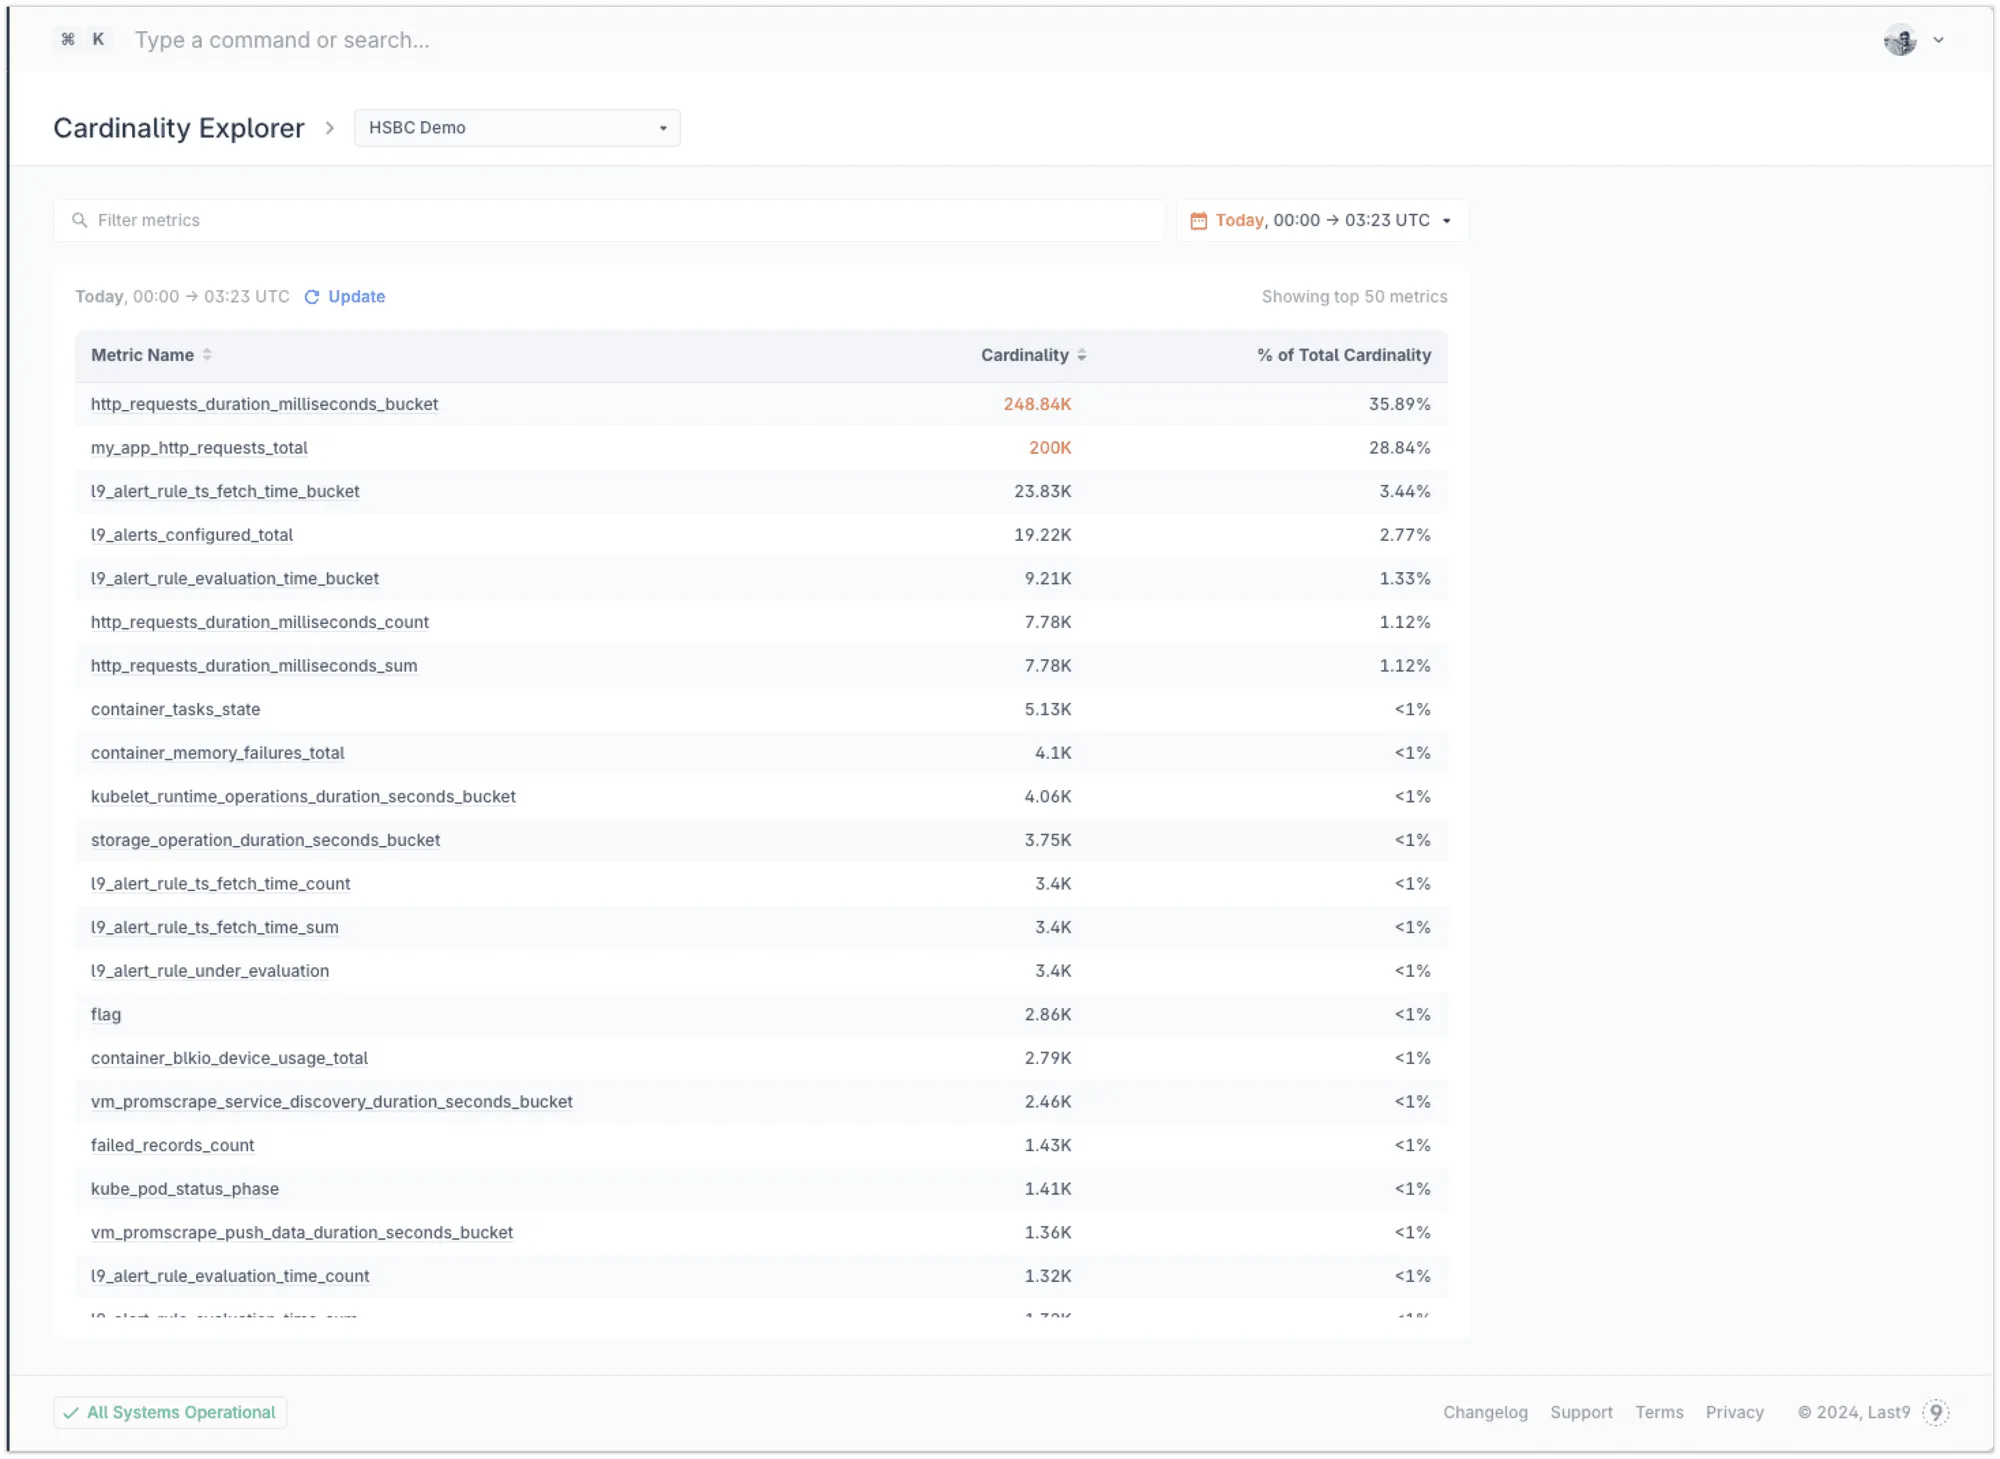
The metrics highlighted in “red” have already breached the cardinality quota for the day.
- Click on an individual metric to explore its cardinality.
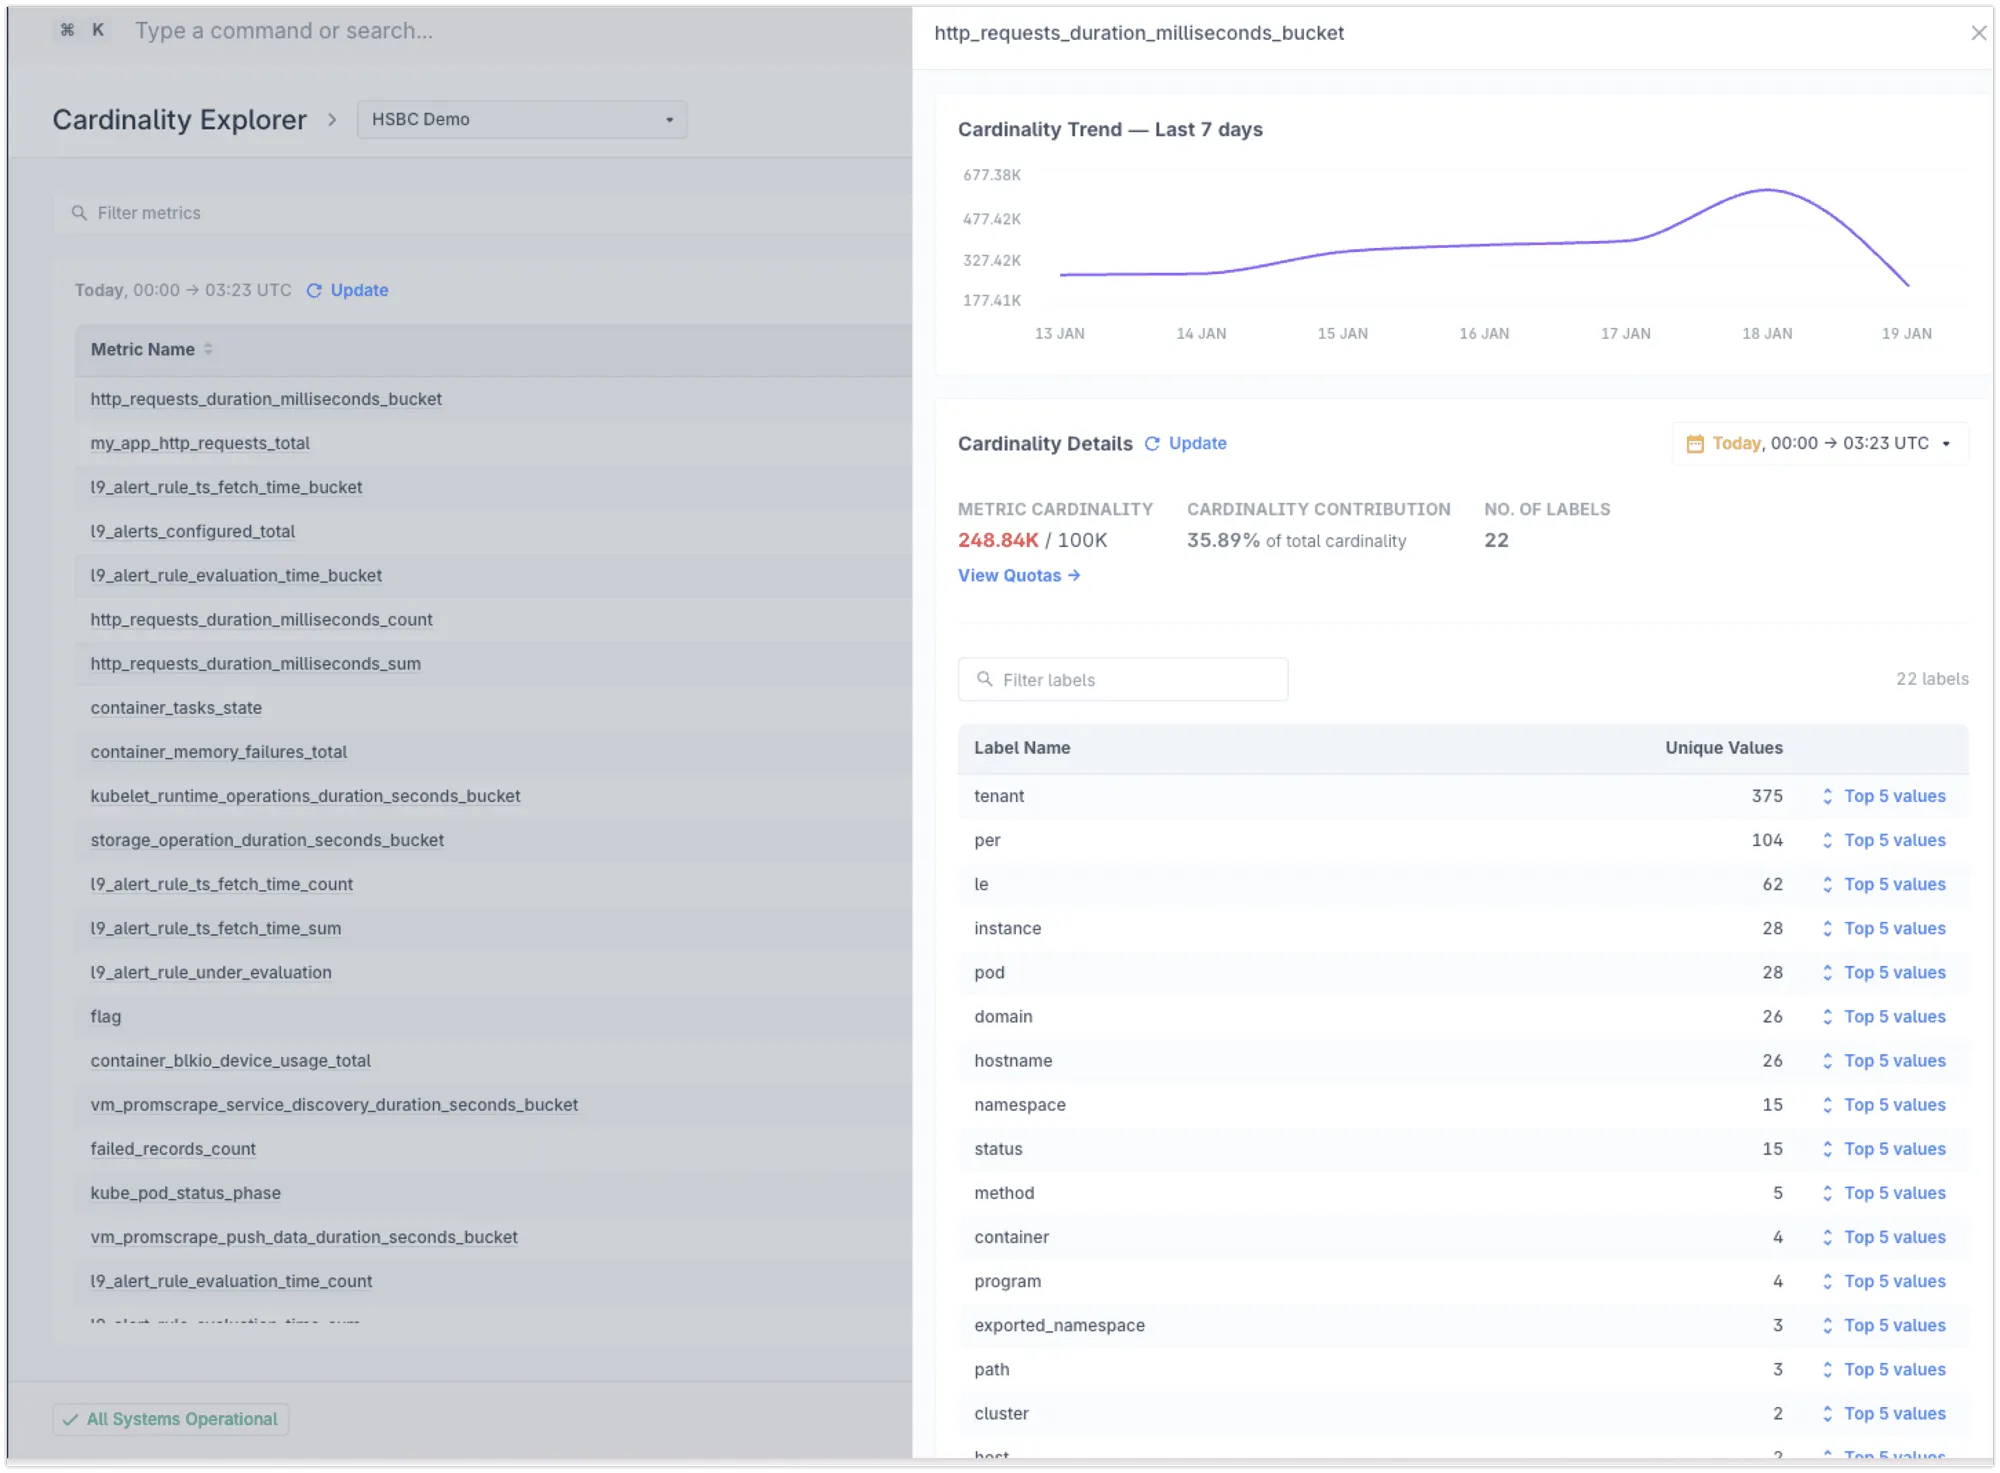
You can also explore the top 5 values for any label to understand its pattern.
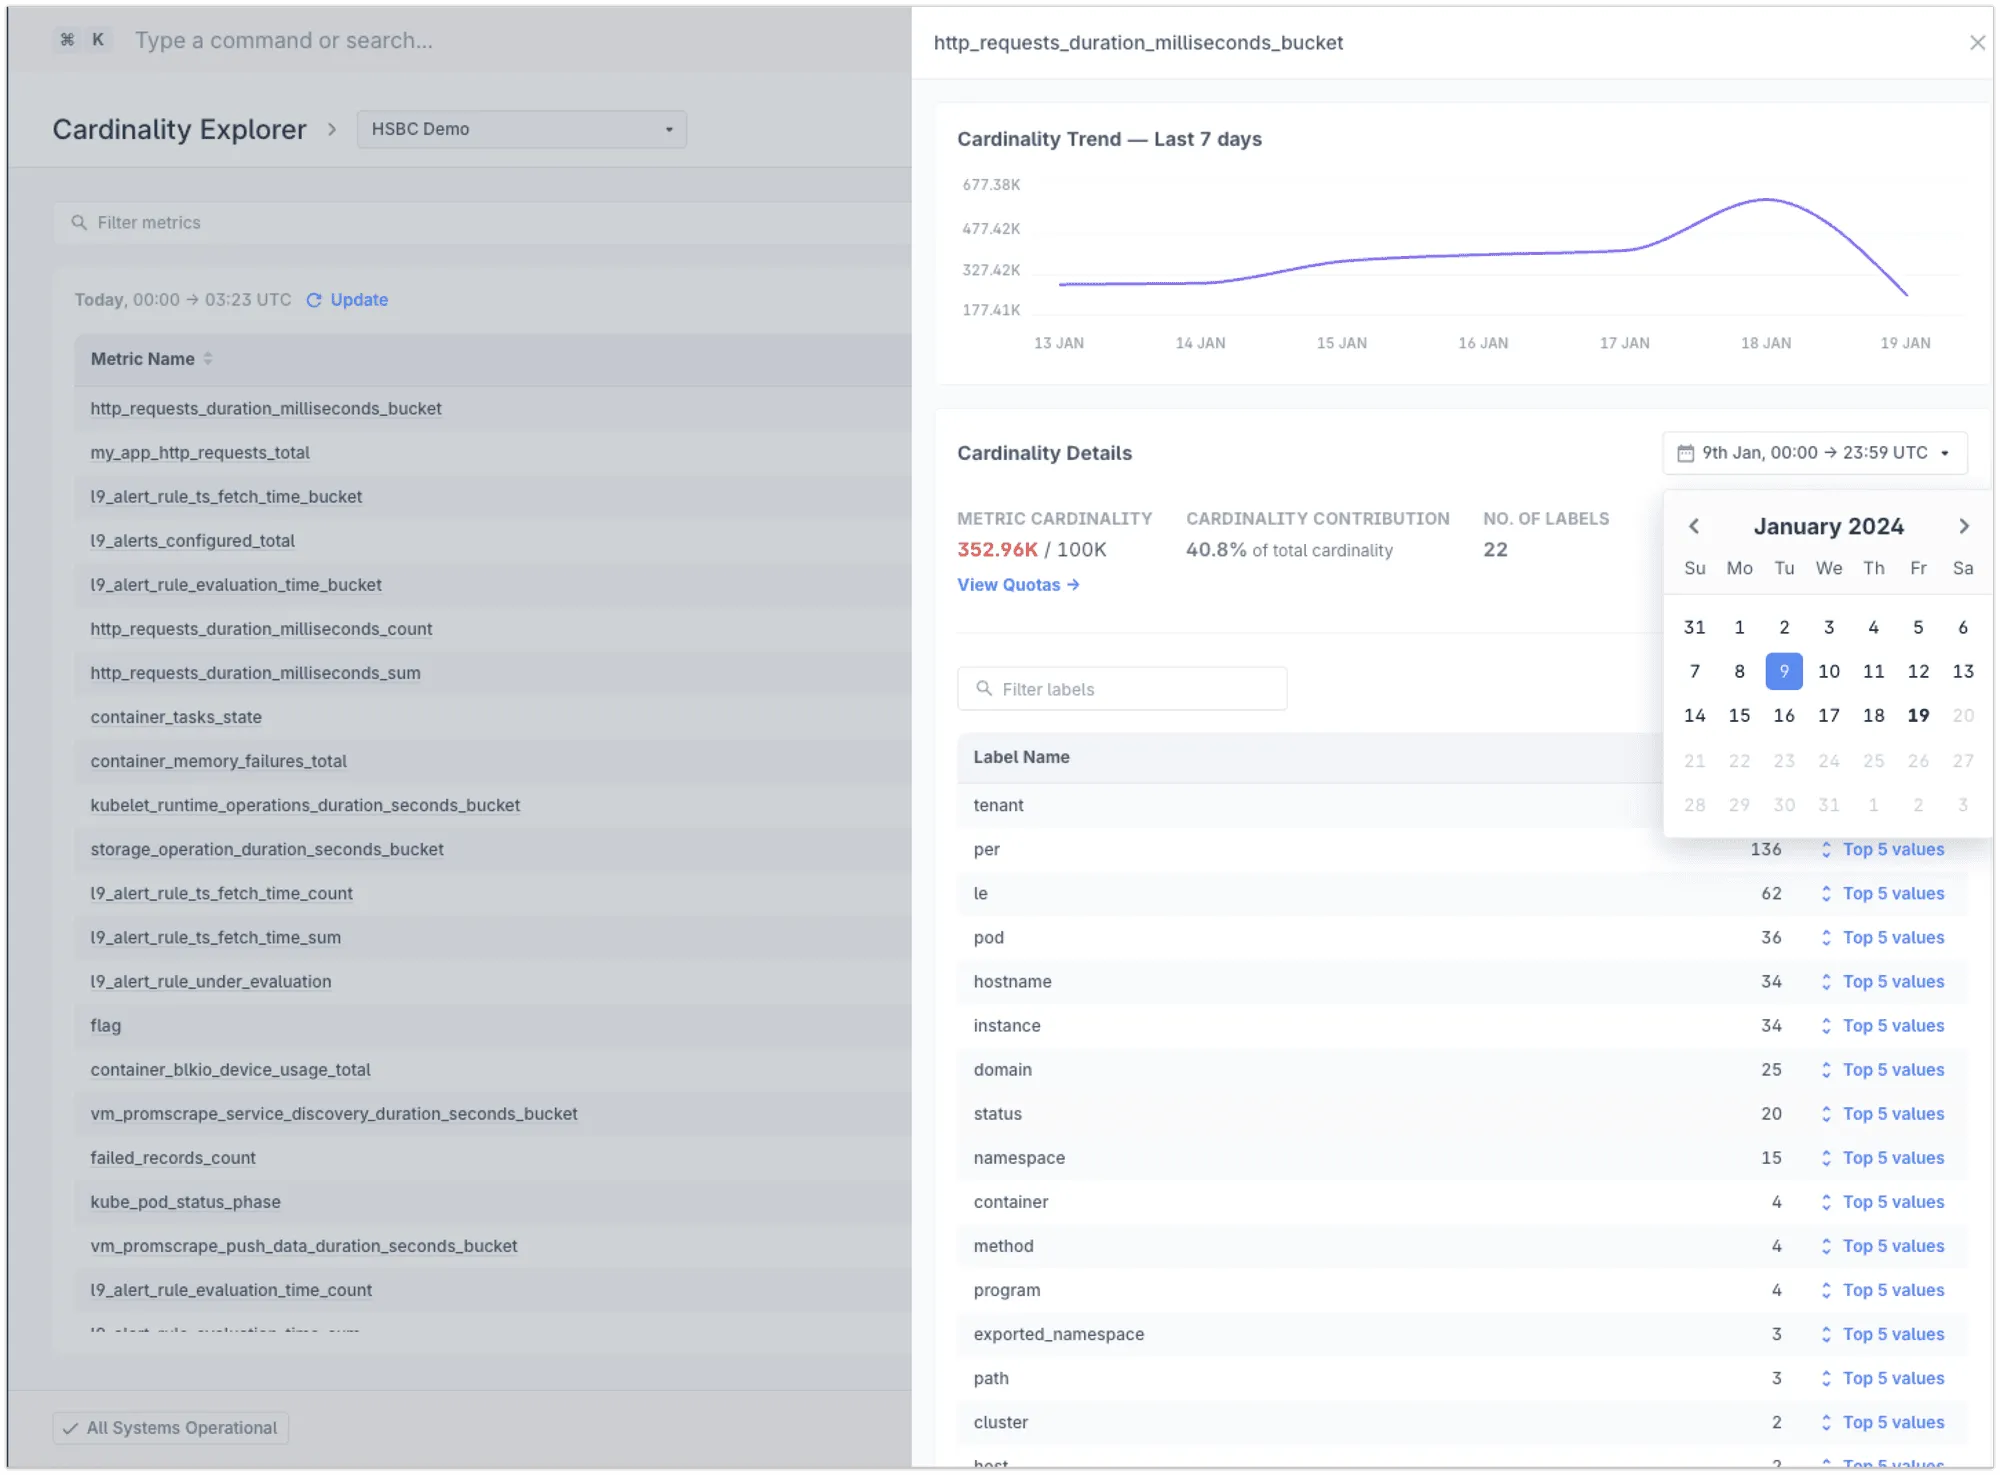
- Change the dates and observe cardinality in the past to understand the historical performance.
- Define streaming aggregations to reduce the high cardinality metrics in real time without losing accuracy.
Here is a demo video about Cardinality Explorer:
Get up and running with Levitate and forget the pain and toil of managing high cardinality metrics yourself.