

Table of Contents
- What’s the same across Nginx, Apache, and syslog error lines?
- How do you read an Nginx error log line?
- How do you read an Apache error log line?
- How do you read a Linux syslog line?
- Conclusion: the bottom line
- FAQ
Every error log line, whether it comes from Nginx, Apache, or the Linux system log, is built from the same four pieces: a timestamp, a severity or level, a source (which process or worker wrote it), and a message. What changes is the punctuation and field order each tool uses to write that down. Once you know the skeleton, you can read a log line from a tool you’ve never used before just by pattern-matching against one you already know.
What’s the same across Nginx, Apache, and syslog error lines?
All three formats descend from the same idea: a fixed severity scale borrowed from syslog itself. Nginx’s own documentation lists eight levels for its error_log directive, in order of increasing severity: debug, info, notice, warn, error, crit, alert, emerg. Apache’s LogLevel directive uses the same eight names (plus extra trace1-trace8 levels for very verbose debugging). Syslog is where this scale originated in the first place. Learn it once and it applies everywhere.
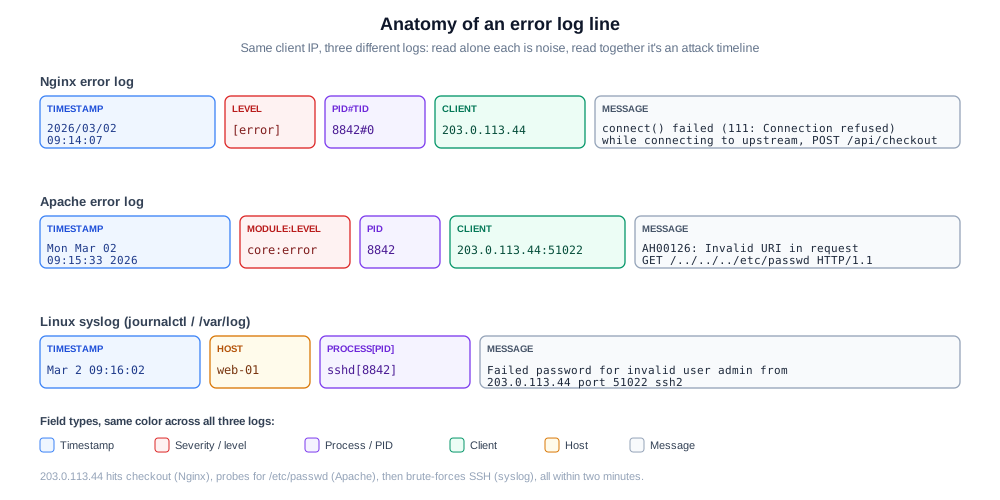
Below is what that shared skeleton looks like across three real log lines, all from the same two-minute window, all from the same client IP. Read on their own, each looks like routine noise. Read together, they’re a single incident: a probe against a checkout endpoint, a path-traversal attempt, and an SSH brute-force try.
How do you read an Nginx error log line?
A typical Nginx error log line looks like this:
2026/03/02 09:14:07 [error] 8842#0: *193 connect() failed (111: Connection refused) while connecting to upstream, client: 203.0.113.44, server: shop.example.com, request: "POST /api/checkout HTTP/1.1", upstream: "http://127.0.0.1:9000/api/checkout", host: "shop.example.com"| Field | Example | What it means |
|---|---|---|
| Timestamp | 2026/03/02 09:14:07 | When Nginx logged the event, in local server time |
| Level | [error] | Severity, one of the eight levels above |
| PID#TID | 8842#0 | The worker process ID and thread ID that handled the request |
| Connection ID | *193 | An internal counter; every log line from the same connection shares this number, useful for grepping one request’s full trail |
| client | 203.0.113.44 | The IP address that made the request |
| server | shop.example.com | Which virtual host (server_name) received it |
| request | "POST /api/checkout HTTP/1.1" | The actual HTTP request line |
| upstream | "http://127.0.0.1:9000/api/checkout" | The backend Nginx was proxying to, if the error happened during proxying |
This particular line means the backend at 127.0.0.1:9000 refused the connection (111: Connection refused) when Nginx tried to proxy a checkout request to it. That’s a backend-down problem, not a client problem. For the full set of common Nginx error messages and what causes each one, see our Nginx error log troubleshooting guide.
How do you read an Apache error log line?
Apache’s default error log format looks different but carries the same information:
[Mon Mar 02 09:15:33.821904 2026] [core:error] [pid 8842] [client 203.0.113.44:51022] AH00126: Invalid URI in request GET /../../../etc/passwd HTTP/1.1| Field | Example | What it means |
|---|---|---|
| Timestamp | [Mon Mar 02 09:15:33.821904 2026] | Logged with microsecond precision |
| Module:Level | [core:error] | Which Apache module raised it, and its severity |
| PID | [pid 8842] | The process ID that handled the request |
| client | [client 203.0.113.44:51022] | Client IP and source port |
| AH code | AH00126 | Apache’s own numbered error catalog ID, searchable directly in Apache’s documentation |
| message | Invalid URI in request GET /../../../etc/passwd HTTP/1.1 | What actually happened |
AH00126 specifically means Apache rejected a malformed or suspicious URI before it ever reached a handler, in this case a directory-traversal attempt (../../../etc/passwd) from the same IP that had just been probing the checkout endpoint on Nginx a minute earlier. The AH##### codes are unique to Apache; nothing else uses them, which makes them a fast way to search Apache’s own docs for an exact explanation instead of guessing from the message text alone. For a deeper walkthrough of Apache logging, including access logs and performance troubleshooting, see our complete Apache logs guide.
How do you read a Linux syslog line?
System-level logs, whether from /var/log/syslog, /var/log/messages, or journalctl on a systemd host, follow the older and simpler syslog format:
Mar 2 09:16:02 web-01 sshd[8842]: Failed password for invalid user admin from 203.0.113.44 port 51022 ssh2| Field | Example | What it means |
|---|---|---|
| Timestamp | Mar 2 09:16:02 | No year and no timezone by default, a well-known syslog quirk that gets fixed by journalctl’s output or by switching to RFC 5424-style logging |
| Host | web-01 | Which machine generated the line, which matters once logs from many hosts are centralized in one place |
| Process[PID] | sshd[8842] | The program and process ID that wrote the line |
| Message | Failed password for invalid user admin from 203.0.113.44 port 51022 ssh2 | Free text, entirely defined by whatever program wrote it, with no fixed schema |
This line means the same IP that probed the checkout endpoint and attempted a path traversal also tried an SSH login with an invalid username, all within about two minutes. Individually, none of these three log lines look urgent. Correlated by IP and time, they’re a single reconnaissance-to-attack sequence. For where system logs live by default and how to navigate them, see our guide to /var/log; for the specific syntax differences between syslog formats, see syslog formats explained.
Conclusion: the bottom line
Every error log format looks intimidating the first time you see it, but all of them boil down to the same four fields written in a different order: when, how severe, from what, and what happened. Once that skeleton clicks, a new log format from a tool you’ve never used is a five-minute read, not a new skill.
The harder problem is the one this example showed: no single log file tells you the whole story. The Nginx line, the Apache line, and the syslog line each look like isolated noise on their own, and manually correlating them by IP and timestamp across three separate files doesn’t scale past a handful of incidents. Last9’s Logs module supports live tail and real-time search across logs, with correlation to the metrics and traces from the same request, so a sequence like this one shows up as one connected trail instead of three files you have to grep separately. Once you’re reading logs like these regularly, log rotation becomes the next thing worth getting right. Our guide to log rotation in Linux covers logrotate setup so these files don’t fill the disk before you get to read them.
FAQ
What does [error] mean in an Nginx log line?
[error] is one of eight severity levels Nginx’s error_log directive supports, in increasing order of severity: debug, info, notice, warn, error, crit, alert, emerg. Setting a log level captures messages at that level and every level above it, so the default error level also logs crit, alert, and emerg events.
What is an AH##### code in Apache error logs?
AH##### is Apache’s own internal error catalog ID, introduced to make specific error messages searchable and unambiguous. AH00126, for example, always means “Invalid URI in request,” regardless of which specific malformed URL triggered it. Apache maintains these as a fixed, documented list.
Where are Nginx, Apache, and system logs stored by default?
Nginx typically writes to /var/log/nginx/error.log. Apache writes to /var/log/apache2/error.log on Debian and Ubuntu, or /var/log/httpd/error_log on RHEL and CentOS-based systems. System logs live at /var/log/syslog on Debian and Ubuntu, /var/log/messages on RHEL-based systems, and are also queryable through journalctl on any modern systemd-based Linux distribution.
What’s the difference between an error log and an access log?
An access log records every request a web server receives, successful or not, typically including the client IP, request line, response status code, and response size. An error log records only the requests or events that went wrong. Nginx and Apache both maintain the two as separate files; syslog has no equivalent split, since it’s a general-purpose logging channel for system services rather than a request-response log.
How do I watch these logs in real time?
tail -f /var/log/nginx/error.log (or the equivalent path for Apache) streams new lines as they’re written, which is the standard way to watch a log file live during debugging. For systemd services, journalctl -u <service-name> -f does the same thing against the journal instead of a flat file.
Do syslog messages have severity levels like Nginx and Apache do?
Yes, and it’s the same underlying scale: syslog is where the eight-level severity system (emerg through debug) originated, standardized in RFC 5424, the IETF’s Syslog Protocol specification. Nginx and Apache both adopted syslog’s severity naming for their own log levels, which is why the same eight words show up across all three formats even though the log line syntax itself looks different.
What is journalctl and how is it different from /var/log/syslog?
journalctl is the command-line tool for reading the systemd journal, a structured, indexed, binary log store used by modern Linux distributions instead of (or alongside) flat text files like /var/log/syslog. It supports filtering by service, time range, and priority directly, and it also adds the year and timezone that classic BSD-style syslog lines omit by default.


