


Most Rails performance problems trace back to one of three places: the Puma worker pool running out of capacity, Ruby’s garbage collector spending too much time cleaning up object churn, or a single slow database query or N+1 pattern tying up a worker while other requests wait. None of these show up clearly in a generic “response time went up” alert. This guide covers what to actually watch for each of the three, using Rails and Puma’s own built-in instrumentation, before reaching for a third-party tool.
If you’re choosing between APM vendors, Last9’s roundup of Ruby APM tools compares them directly. If you’re setting up OpenTelemetry instrumentation specifically, the step-by-step OpenTelemetry Ruby guide covers that. This piece is about what to look at once something is already instrumented, or before you instrument anything at all.
What causes most Rails performance problems in production?
Three failure modes account for the large majority of Rails slowdowns that show up as “the site got slow” reports.
Puma runs out of worker or thread capacity. A Puma cluster has a fixed number of worker processes, each running a fixed-size thread pool. When every thread across every worker is busy handling a request, new requests queue up in the backlog instead of running immediately. From the outside this looks like the whole application getting slow at once, even though most requests were never doing anything wrong themselves. They were waiting in line behind requests that were.
Ruby’s garbage collector spends too much time cleaning up. Rails applications allocate a large number of short-lived objects per request: ActiveRecord instances, hashes, strings from view rendering. When the app allocates faster than the garbage collector can reasonably keep up with, or the heap is undersized for the app’s real object churn, GC runs more often and each run takes longer, competing directly with request-handling time for the same CPU. This is invisible in application code. Nothing in a controller or model looks wrong. The cost is sitting in Ruby’s memory management layer.
A single blocking query or N+1 pattern holds a worker hostage. A slow database query, an external API call without a timeout, or an association loaded once per row instead of once per request ties up one Puma thread for the full duration of that work. One slow dependency doesn’t just slow down the request that triggered it. It reduces available worker capacity for every other request arriving at the same time, which is how one bad query can look like a site-wide outage under load.
What should you watch on Puma’s stats endpoint?
Puma exposes a built-in stats endpoint when the control app is enabled (activate_control_app in puma.rb, or a --control-url and --control-token on the command line, or by reading Puma.stats_hash in-process), and it answers the worker-starvation question directly without needing any third-party agent. A handful of its fields matter more than the rest:
- backlog: requests currently waiting for a free thread within a worker. This should sit at zero most of the time. Any sustained value above zero means requests are queuing, not just running slowly.
- pool_capacity: how much request-handling headroom a worker actually has right now, waiting threads plus the room left before hitting
max_threads. A pool_capacity of zero means that worker is completely saturated. - running: how many threads are currently spawned against the worker’s configured
max_threadsceiling. Running consistently at the ceiling, not just spiking there, is the signal that thread count itself is undersized for real traffic. - requests_count: a running total of requests a worker has served since it started, useful for spotting one worker handling a disproportionate share of traffic versus its siblings.
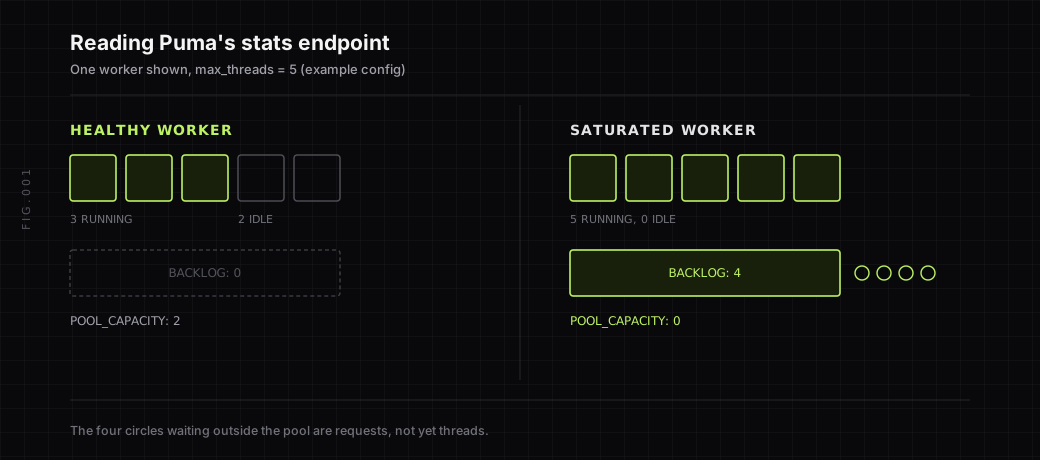 A backlog above zero means requests are waiting, not just running slowly.
Checking this costs nothing extra, since it’s built into Puma itself, and it’s the fastest way to confirm or rule out worker starvation before looking anywhere else.
How do you know if garbage collection is slowing requests down?
GC.stat returns Ruby’s own real numbers directly, most usefully object counts and collection counts, though Ruby’s own documentation notes the exact contents are “implementation specific and may change in the future without notice.” A healthy setup looks different from a churning one in a few specific ways, not just a single “GC is running” observation.
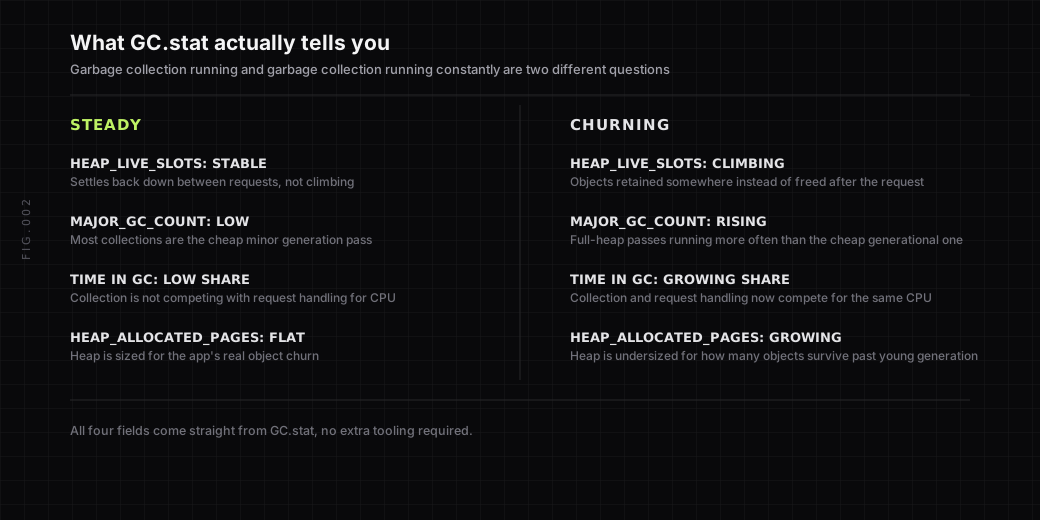 A garbage collector that runs is normal. One that runs constantly is the problem.
Three fields from GC.stat carry most of the signal:
- heap_live_slots that keeps climbing between requests, instead of settling back down, usually means objects are being retained somewhere they shouldn’t be rather than freed once the request finishes.
- major_gc_count rising against minor_gc_count means Ruby is running the expensive full-heap pass more often than the cheap generational one. That usually means the heap is undersized for how many long-lived objects the app creates.
- time, read as a share of total request time, is the most direct signal that garbage collection and request handling now compete for the same CPU budget.
None of these require a third-party tool to check. They’re a Ruby method call away, which makes them a reasonable first stop before assuming a slowdown needs more application servers or a bigger box.
How do you find the specific query that’s actually slow?
Puma’s stats and Ruby’s GC stats tell you whether the platform layer is healthy. They don’t tell you which specific controller action, query, or external call is eating the time inside an individual request. Rails already instruments this at the framework level through Active Support Notifications: the process_action.action_controller event’s payload includes a db_runtime field (milliseconds spent on database queries) and a view_runtime field (milliseconds spent rendering), attached to every single controller action Rails processes, no extra setup required.
A large db_runtime relative to total request time points at the database. The next question is usually whether that’s one slow query or many small ones.
The Bullet gem is built for the second case. It watches queries while the app runs and flags N+1 patterns, where a record loads and then each row queries its association separately instead of eager-loading once. It also flags unused eager loading, and places where a counter_cache would replace a repeated COUNT query.
For distributed tracing, following one request through every downstream call it makes, Last9’s OpenTelemetry Ruby guide walks through auto-instrumentation setup. That is what turns “checkout is slow” into “80% of that request’s time is one uncached query,” without guessing.
If logging itself, not performance, is the immediate question, Last9’s Rails Logger guide covers configuring and optimizing what Rails writes to its logs, a related but separate concern from the three failure modes above.
What should you alert on?
Not every one of these numbers needs its own page. A small, specific set catches the real failure modes above before they turn into an outage:
- Puma backlog sustained above zero for more than a minute or two
- pool_capacity sitting at or near zero for a sustained period, not just a brief spike
- major_gc_count or total GC time trending upward over days, not just a single noisy run
db_runtimeclimbing as a share of totalprocess_action.action_controllertime- p95 and p99 response time, not just the average, since a worker-starvation or GC-pressure problem often hides inside the tail rather than moving the mean
Conclusion: check the platform before you chase the code
A surprising share of “Rails is slow” investigations turn out to be a Puma worker pool running out of threads or a garbage collector quietly spending more and more time cleaning up object churn, both of which are visible from Rails and Ruby’s own built-in tools without installing anything. Check those two first. If they’re both healthy and a specific request is still slow, that’s when db_runtime, the Bullet gem, and distributed tracing earn their keep, by showing exactly which call inside that request is actually taking the time.
FAQ
How do I enable Puma’s stats endpoint?
Puma’s stats are available by enabling the control app in your Puma configuration (a --control-url and --control-token, or activate_control_app in puma.rb), or by calling Puma.stats_hash directly from within the running process. Once enabled, it reports worker-level metrics including backlog, pool_capacity, running threads, and requests served, in a structured hash you can poll on an interval.
Why is my Rails app slow even though CPU usage looks normal per request?
Low per-request CPU alongside a slow application overall is a strong signal that requests are waiting rather than computing, most often because Puma has run out of available threads and new requests are sitting in the backlog. A thread blocked on a slow database query or an external API call without a timeout doesn’t use much CPU while it waits, but it does hold a thread another request needs.
Does adding more Puma workers automatically fix performance problems?
More workers helps with request-queuing problems specifically, but only if the underlying bottleneck is genuinely thread starvation and not something else competing for the same CPU, like garbage collection pressure or a slow shared database. Adding workers without checking GC.stat first can mean paying for more memory and process overhead while the actual bottleneck, GC time or a slow query, stays exactly as slow per request.
What’s the difference between minor and major garbage collection in Ruby?
A minor GC collects only the young generation of recently allocated objects and is relatively cheap. A major GC scans the entire heap, including long-lived objects, and is significantly more expensive. A climbing ratio of major to minor collections usually means the heap is undersized for how many objects are surviving past the young generation, forcing Ruby into the expensive full pass more often than it should need to.
Do I need APM software to monitor a Rails application, or are Rails’ and Ruby’s built-in tools enough?
Rails and Ruby’s built-in tools, Puma’s stats endpoint, GC.stat, and Active Support Notifications, are enough to catch the two most common platform-level problems: worker starvation and GC pressure. They can’t show you which specific line of code or query inside a single request is slow across multiple services, which is what distributed tracing and APM tooling are built for. Most teams end up using both: the built-in status data as a fast first check, and tracing for the harder per-request or cross-service investigations.


