
When it comes to monitoring cloud-native applications, Prometheus is one of the go-to tools. It’s powerful, open-source, and widely used for collecting and querying time-series data.
However, as your system grows and your metrics scale, Prometheus starts to show some limitations. That’s where Thanos comes in. So, how do Prometheus and Thanos compare, and why should you consider using them together? Let’s break it down.
What is Prometheus?
Prometheus is an open-source time-series database (TSDB) designed for monitoring and alerting in cloud-native environments. It collects metrics from various endpoints via its powerful query language, PromQL, and stores them in a time-series format.
Prometheus offers excellent integration with Kubernetes and is often deployed using the Prometheus Operator to manage Prometheus instances and configurations.
However, Prometheus’ default setup has its challenges, especially when you’re dealing with large-scale deployments or need highly available Prometheus setups. That’s where Thanos steps in.
For a deeper understanding of optimizing Prometheus queries, check out our guide on Prometheus Recording Rules.
What is Thanos?
Thanos is an open-source project that extends Prometheus’ functionality to help overcome its limitations, particularly around long-term storage, scalability, and high availability.
Integrating with Prometheus, Thanos adds a set of components that allow you to store and query historical metrics efficiently, even across multiple clusters or Prometheus deployments.
Thanos provides long-term storage capabilities by using object storage buckets (like AWS S3 or GCP) to keep metric data. Components like the Thanos Sidecar assist in replicating, deduplicating, and storing data in object stores.
The Thanos Compactor optimizes storage and retention policies by compacting older data, while the Thanos Querier enables global querying across multiple Prometheus instances.
Prometheus vs Thanos: A Comparison
Here’s a quick comparison between Prometheus and Thanos, highlighting their core features and use cases:
| Feature | Prometheus | Thanos |
|---|---|---|
| Purpose | Collecting and querying metrics | Long-term storage, scalability, and global query |
| Time-Series Data Storage | Local storage only | Supports object storage (AWS S3, GCP, etc.) |
| High Availability | Requires manual setup for HA | Built-in high availability with replication |
| Long-Term Storage | Limited, short-term data retention | Supports long-term retention with cloud storage |
| Global Querying | Local querying only | Global querying across multiple Prometheus setups |
| Scaling | Horizontal scaling with Prometheus instances | Horizontal scaling with global queries and deduplication |
| Downsampling | No built-in downsampling | Supports downsampling of old data |
| Data Deduplication | No built-in deduplication | Deduplicates data from multiple Prometheus instances |
| Setup Complexity | Relatively simple setup | More complex setup with multiple components |
| Deployment | Kubernetes-friendly (Prometheus Operator) | Kubernetes-friendly (Helm charts available) |
Prometheus Components
Prometheus has several key components that make it a powerful monitoring solution:
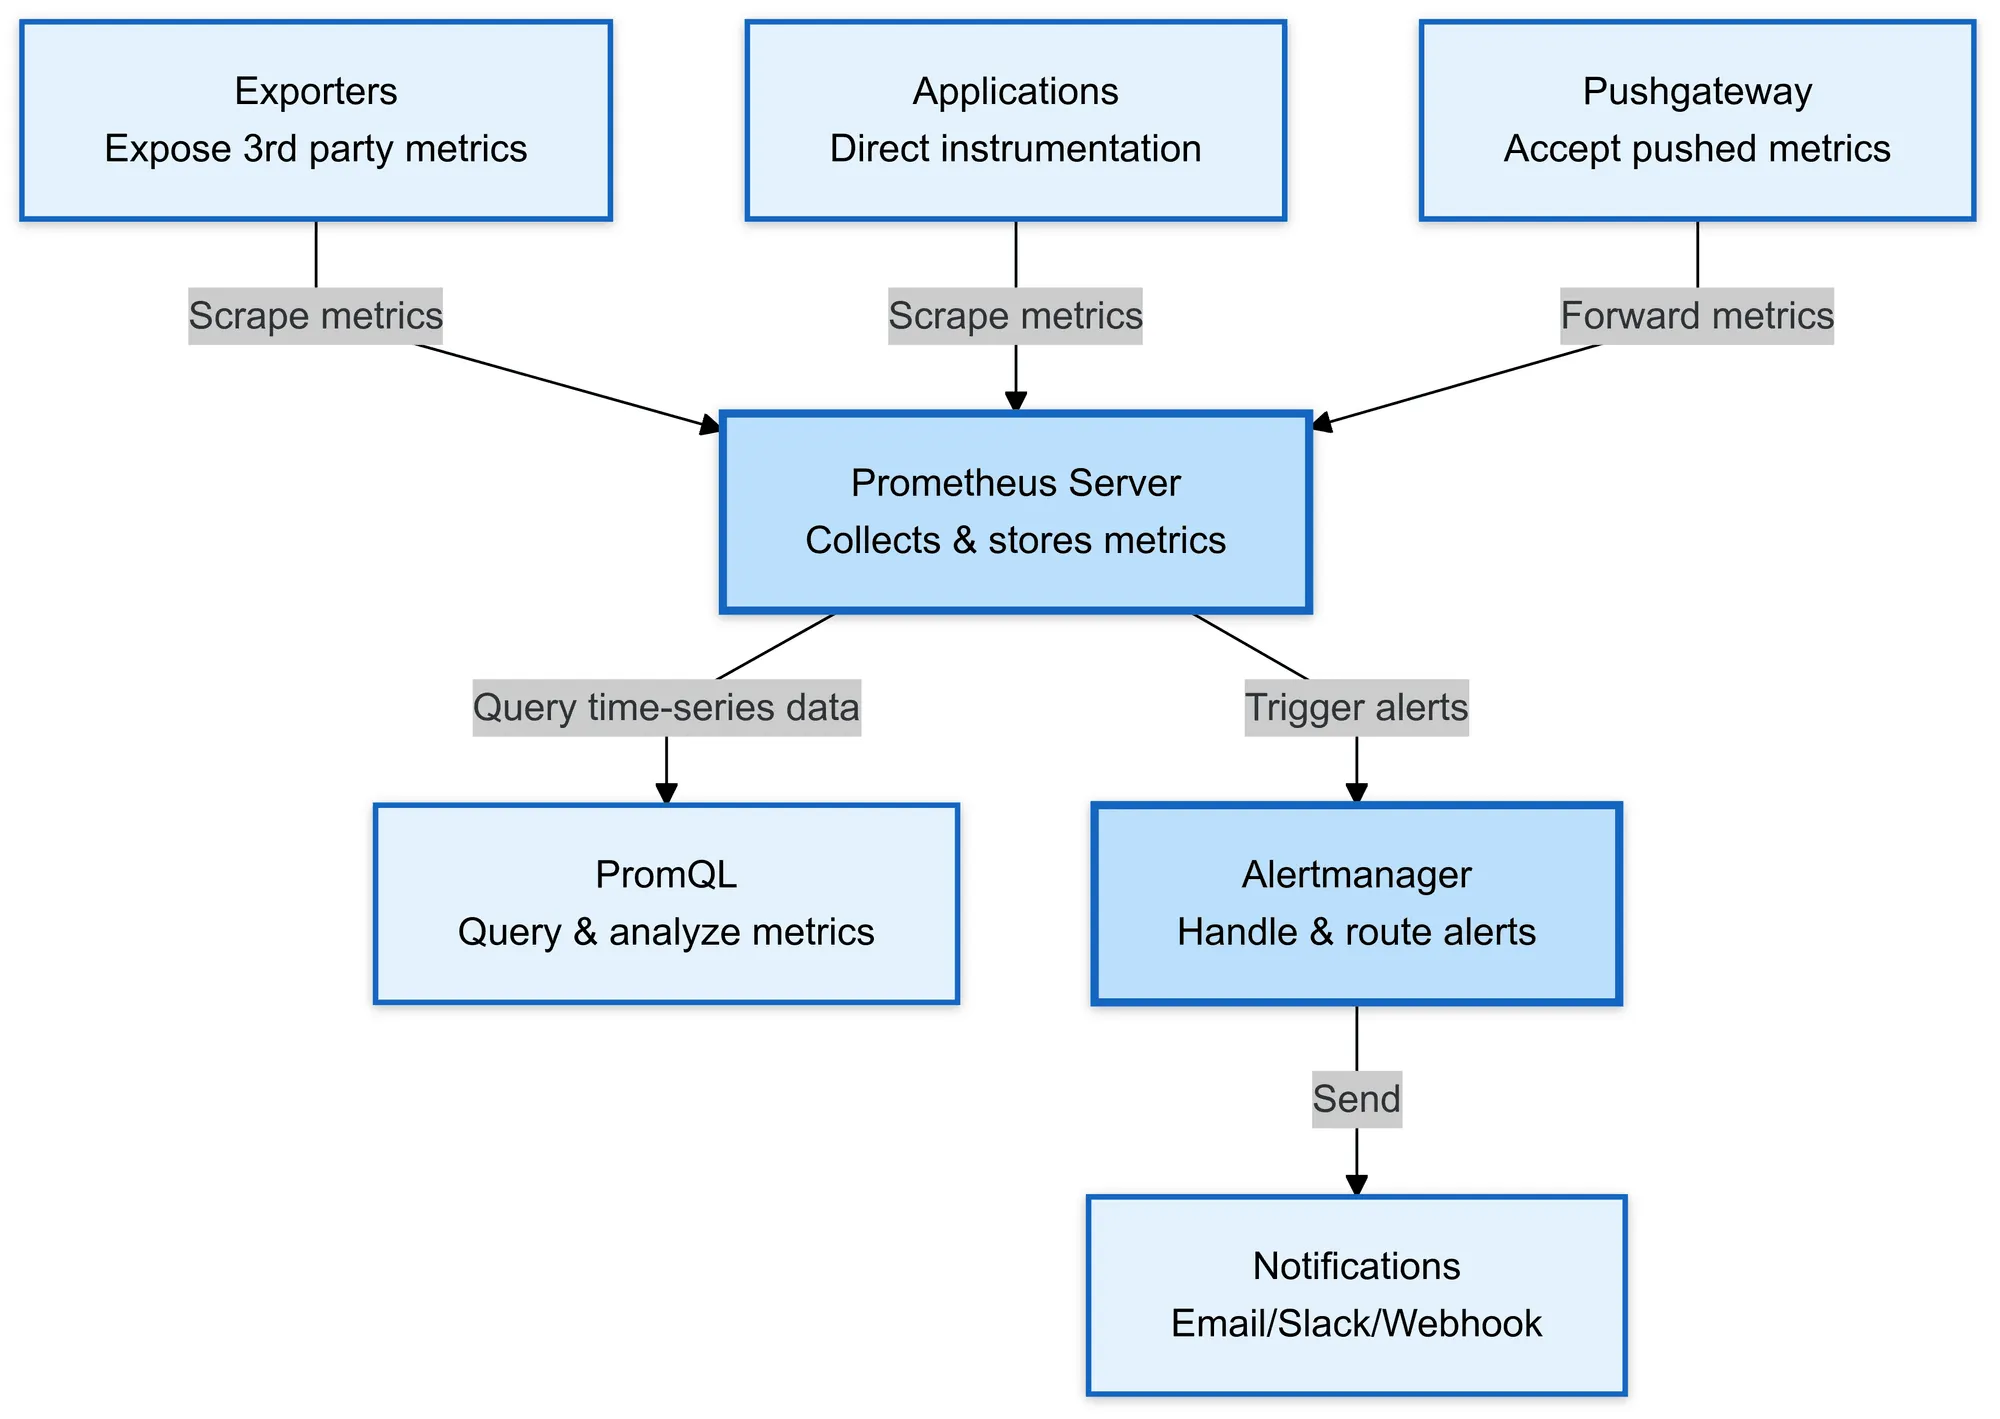
1. Prometheus Server
The heart of Prometheus is responsible for scraping metrics from configured endpoints and storing them in its time-series database.
2. PromQL
The query language is used to extract and analyze time-series data, enabling powerful and flexible queries.
To get a comprehensive understanding of Prometheus Query Language, check out our Guide to Prometheus Query Language.
3. Prometheus Scraping
Prometheus collects metrics by scraping endpoints at defined intervals, configured via a YAML file.
4. Alertmanager
Handles alerts triggered by Prometheus, managing routing, grouping, and de-duplication, sending notifications to external systems like Slack or email.
5. Exporters
Software components that expose metrics from third-party services (e.g., databases, hardware), so Prometheus can scrape them.
6. Pushgateway
Used when services can’t be scraped directly by Prometheus, allowing them to push metrics to Prometheus via a central gateway.
7. Prometheus Operator
A Kubernetes-native tool for automating the deployment and management of Prometheus and Alertmanager instances within Kubernetes environments.
8. Prometheus Storage
The internal time-series database (TSDB) used to store scraped metrics, is designed for efficient reads and writes but not long-term storage.
For insights into using Prometheus Pushgateway, check out our guide on Prometheus Pushgateway.
Why Use Thanos with Prometheus?
While Prometheus excels at collecting and querying real-time metrics, there are several reasons why Thanos is an excellent complement:
1. Scalability
Prometheus can be scaled horizontally by running multiple instances, but when you need to aggregate data from different Prometheus instances, it becomes challenging.
Thanos solves this by allowing you to query multiple Prometheus servers globally. The Thanos Query component provides a global query view for all your Prometheus instances, making it easier to scale across larger infrastructures.
2. High Availability
Prometheus by itself doesn’t have built-in support for high availability. If your Prometheus instance fails, you may lose critical metrics.
Thanos solves this by ensuring that data is stored redundantly, using the Thanos Sidecar to sync data to object storage, which provides highly available Prometheus setups.
To learn more about ensuring high availability in Prometheus, check out our guide on High Availability in Prometheus.
3. Long-Term Storage
Prometheus is great for short-term data retention, but when you need to store metrics for longer periods, Thanos shines.
Thanos allows you to store historical data in cloud storage, preventing local storage from becoming overwhelmed. This approach enables long-term data retention without sacrificing performance or scalability.
This is especially helpful for DevOps teams that need to retain data over long periods for analysis and compliance.
4. Downsampling & Deduplication
Thanos supports downsampling, which reduces the granularity of older data to save on storage space while still retaining useful insights.
Additionally, Thanos handles deduplication by ensuring that you don’t end up with redundant metrics when multiple Prometheus instances are running.
5. Prometheus API & Store Gateway
Thanos extends Prometheus’ API and provides a store gateway that connects Prometheus with remote object storage, allowing for efficient queries and retrieval of metric data.
This feature makes it easier to integrate Prometheus and Thanos into your existing monitoring system.
Thanos Components Overview
Thanos consists of several components that help extend Prometheus’ functionality.
Here’s a quick look at each one:
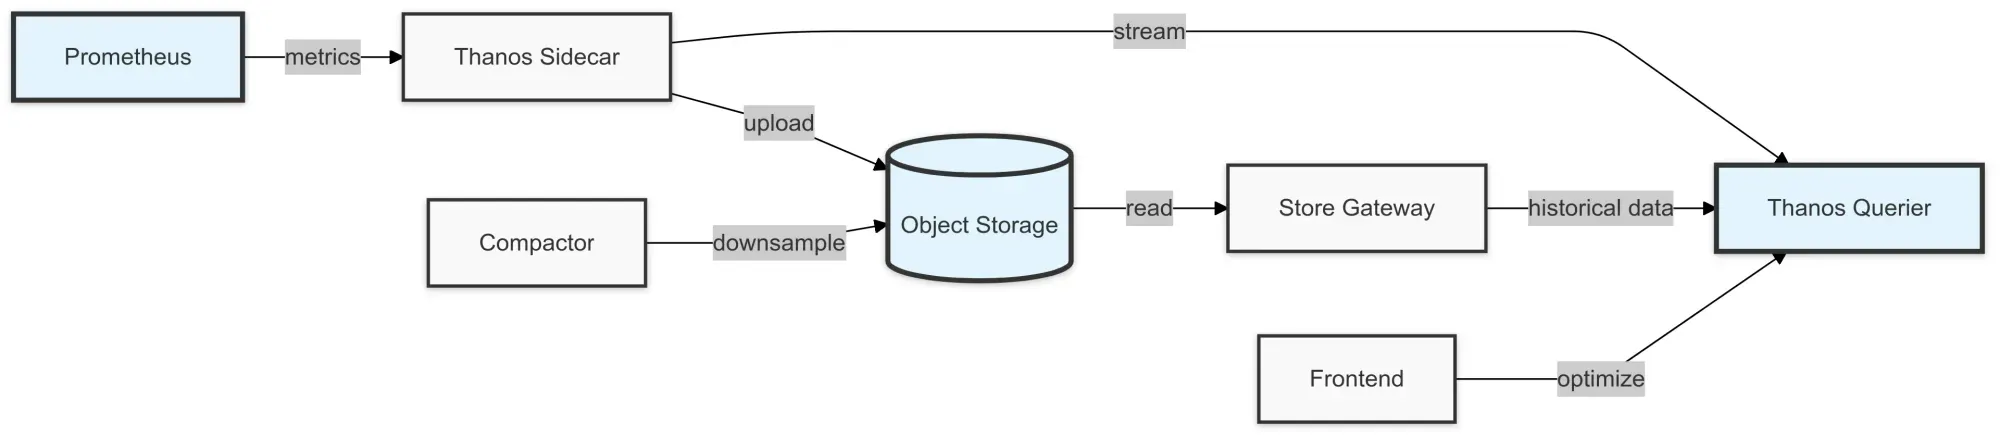
Thanos Sidecar
A companion component to Prometheus that handles uploading metrics to object storage and allows Prometheus to integrate smoothly with Thanos.
Thanos Querier
The component that allows you to query data from multiple Prometheus instances globally.
Thanos Store
This component is responsible for reading and storing data from object storage.
Thanos Compactor
Optimizes data storage by downsampling and compacting old data.
Thanos Store Gateway
Connects with object storage to serve historical metric data.
Thanos Frontend
A component that allows for efficient query processing, improving the performance of large-scale queries.
Scaling Prometheus in Distributed Environments
While Prometheus is excellent for monitoring small- to medium-sized setups, as your infrastructure grows, you’ll need to consider strategies to ensure it continues to perform well across a distributed environment.
Here’s how you can scale Prometheus efficiently:
1. Horizontal Scaling with Multiple Prometheus Instances
Prometheus supports horizontal scaling by allowing you to run multiple Prometheus instances. Each instance can be responsible for scraping metrics from a specific set of targets or regions.
However, when running multiple Prometheus instances, you’ll need to aggregate the data from all these instances to maintain a unified view of your system.
Tip: Prometheus instances can be set up to scrape different targets based on labels, ensuring that each instance is optimized for specific workloads or services.
2. Thanos for Global Querying
To aggregate the metrics from multiple Prometheus instances, Thanos provides a robust solution.
The Thanos Query component enables querying data across all Prometheus instances globally, offering a single, unified query layer that aggregates results from any Prometheus instance. This is particularly useful for managing large, geographically distributed environments.
Best Practice: Deploy Thanos Query alongside your Prometheus setup to avoid bottlenecks and allow for high-performance global queries.
To explore different types of Prometheus metrics in detail, check out our guide on Prometheus Metrics Types.
3. Federation for Metric Aggregation
Prometheus also offers federation, a built-in feature that allows you to aggregate data from multiple Prometheus instances.
In this setup, a central Prometheus server scrapes data from other Prometheus instances (called “federated” instances). This is useful if you need a more structured approach to pulling in data from other regions or clusters.
Tip: Use federation for aggregating a subset of metrics (e.g., service-level metrics) rather than the entire dataset to avoid overloading the central Prometheus server.
4. High Availability with Replication
One of the challenges of scaling Prometheus in distributed environments is ensuring high availability. This setup ensures that if one Prometheus instance goes down, others can continue collecting and storing metrics without any interruption.
Thanos helps with this by replicating data across multiple Prometheus instances and pushing it to object storage, ensuring redundancy and fault tolerance.
Best Practice: Always deploy Prometheus in a highly available setup using Thanos or other replication strategies to ensure that you don’t lose critical metrics in case of instance failure.
5. Storage Scaling with Object Storage
As your data grows, local storage in Prometheus can quickly become a limitation. For long-term storage, integrating object storage with Prometheus (via Thanos) is key.
With Thanos, Prometheus metrics are pushed to cloud storage (like AWS S3, Google Cloud Storage, or other object stores), offloading the burden from the local disk and ensuring scalability without losing historical data.
Tip: Configure object storage in a way that aligns with your data retention policies. Thanos’ Compactor component can help by downsampling older data, reducing storage needs without losing insights.
6. Load Balancing Prometheus Scraping
In large distributed environments, you may encounter performance issues with scraping many targets simultaneously.
Load balancing your Prometheus scrapers helps distribute the load evenly across multiple Prometheus instances or scraping jobs, improving performance and ensuring data consistency.
Best Practice: Use Prometheus Operator or a Kubernetes-based solution to handle scaling automatically, ensuring that your scraping infrastructure can scale as your application grows.
Getting Started with Thanos
Setting up Thanos with Prometheus is relatively straightforward, but there are a few key steps to follow to ensure a smooth integration. Here’s a simple guide to get you started:
Prerequisites:
- Prometheus: You need an existing Prometheus setup since Thanos extends its capabilities, particularly for long-term storage and scalability.
- Kubernetes or Docker (Optional): For easier deployment, you can run Thanos in Kubernetes or Docker environments, but it can also run directly on physical servers or virtual machines.
- Basic understanding of Prometheus: Since Thanos works with Prometheus, familiarity with Prometheus concepts like time-series data, metrics, and querying is helpful.
Installation Steps:
Install Thanos:
- Download the latest release of Thanos from the official GitHub repository or use a package manager like
brewfor macOS. - For Linux, you can use the following command to download Thanos:
wget https://github.com/thanos-io/thanos/releases/download/v<version>/thanos-<version>-linux-amd64.tar.gztar -xvzf thanos-<version>-linux-amd64.tar.gzConfigure Thanos with Prometheus:
- Thanos requires Prometheus to be running to collect and store time-series data. Modify your Prometheus configuration file to include Thanos components, like the sidecar or store gateway.
- For example:
prometheus: # Add Thanos sidecar configuration thanos: sidecar: true object_storage: <your_object_storage>Start Thanos Components:
- Run Thanos components (e.g., sidecar, query, store, compactor) either via Docker, Kubernetes, or directly on your host system.
- For example, to start the Thanos sidecar:
thanos sidecar --http-address=0.0.0.0:19192 --prometheus.url=http://localhost:9090Verify Setup:
- Once everything is up and running, access the Thanos Query UI to confirm data is being collected and queried correctly.
- You can navigate to the Thanos UI:
http://<your-thanos-query-address>:9090to check if everything is working smoothly.
How to Migrate from Prometheus to Thanos
Migrating from Prometheus to Thanos is relatively straightforward. You can deploy Thanos alongside Prometheus by adding the Thanos Sidecar to your existing Prometheus deployment.
The Sidecar will push your data to object storage and enable remote write functionality.
You’ll also want to use Prometheus HA for high availability and ensure that your configuration files (YAML) are updated to reflect Thanos components.
The Role of Cortex in Scaling Prometheus
While Thanos is a powerful tool for extending Prometheus’ capabilities, another option for scaling Prometheus in large environments is Cortex.
Like Thanos, Cortex is designed to address the challenges of scaling Prometheus, particularly in terms of long-term storage, high availability, and horizontal scalability.
Here’s how Cortex contributes to scaling Prometheus:
1. Multi-Tenant Prometheus as a Service
Cortex allows you to scale Prometheus horizontally by enabling multi-tenancy. It enables multiple Prometheus instances to share the same infrastructure while maintaining separation between tenants, making it easier to manage large numbers of users or applications across your system.
This feature is particularly useful when managing metrics at scale for different teams or clients.
Best Practice: Use Cortex when you need to operate Prometheus at a large scale with the flexibility of managing multiple tenants without compromising performance.
For tips on troubleshooting common Prometheus pitfalls like cardinality, resource utilization, and storage challenges, check out our guide on Troubleshooting Common Prometheus Pitfalls.
2. Long-Term Storage with Distributed Architecture
Cortex uses a distributed architecture to scale Prometheus’ storage layer. Instead of relying on a single Prometheus instance to handle all the data, Cortex stores data in a horizontally scalable and highly available manner using object storage (like AWS S3 or GCP).
This approach not only allows for efficient long-term storage but also ensures redundancy, ensuring that data is never lost even if an individual component fails.
Tip: Configure Cortex with object storage to ensure scalable and reliable long-term storage while keeping costs manageable.
3. High Availability & Fault Tolerance
Cortex provides built-in high availability and fault tolerance. It achieves this through replication and redundancy, ensuring that metric data is available even during outages or failures.
This is crucial for large environments where uptime is critical, and losing data even briefly can have a significant impact.
Best Practice: Use the replication and redundancy features in Cortex to ensure that your Prometheus setup remains operational, even in the face of component failures.
4. Efficient Querying Across Multiple Instances
With Cortex, you can query data across multiple Prometheus instances or clusters effortlessly. It aggregates metrics from Prometheus instances, allowing you to run high-performance queries over large datasets.
The result is a system that scales horizontally while still offering powerful querying capabilities.
Best Practice: Integrate Cortex for querying large-scale datasets from distributed Prometheus instances, ensuring that you can maintain performance even as your infrastructure grows.
5. Downsampling & Data Compaction
Similar to Thanos, Cortex supports downsampling and data compaction, which helps reduce the storage footprint of older data without losing valuable insights.
This is an essential feature when managing huge amounts of time-series data, as it allows you to store data efficiently while maintaining its usefulness for future analysis.
Tip: Use Cortex’s downsampling and compaction to optimize your data storage strategy, reducing costs while still retaining critical insights.
6. Integration with Prometheus
Cortex is designed to be a drop-in replacement for Prometheus’ long-term storage. It works by replicating and storing Prometheus’ data in its distributed system, allowing Prometheus to continue functioning as it normally would, but with the added benefits of scalability, high availability, and long-term storage capabilities.
Best Practice: Use Cortex for long-term storage when you want to scale Prometheus without compromising the ease of using Prometheus for real-time monitoring.
For tips and strategies on scaling Prometheus, check out our guide on Scaling Prometheus: Tips, Tricks, and Proven Strategies.
High Cardinality and Data Retention Challenges
Managing high cardinality and data retention is crucial for scaling Prometheus effectively.
High Cardinality: This occurs when there are too many unique combinations of labels, leading to an explosion in time-series data. It can impact storage, performance, and query speed.
Solution:
- Optimize Labels: Limit the number of labels and avoid those with high cardinality, like user IDs or request IDs.
- Downsampling: Use downsampling techniques (e.g., Thanos or Cortex) to reduce data granularity for older metrics, saving storage and maintaining performance.
With Last9, we eliminated the toil. It just works. – Matt Iselin, Head of SRE, Replit
Data Retention: Prometheus is designed for short-term storage, and long-term retention can overwhelm its local storage.
Solution:
- Object Storage: Integrate Thanos or Cortex for scalable, cloud-based long-term storage to efficiently manage large datasets and ensure data availability over time.
Best Practices for Using Thanos with Prometheus
Use Object Storage
Choose a reliable object storage bucket (like AWS S3 or GCP buckets) for your Thanos setup to ensure scalability and reliability.
Optimize Compaction
Make use of the Thanos Compactor to manage data retention policies and reduce storage costs.
Monitor Latency
Keep an eye on the latency of global queries. Thanos helps minimize this, but it’s still important to fine-tune your setup.
Deploy with Helm
Using Helm for Kubernetes deployments simplifies the installation and configuration of both Prometheus and Thanos components.
If you’re exploring other monitoring solutions, take a look at our article on Prometheus Alternatives.
How Can You Get Involved in the Thanos Community?
The Thanos project is driven by a dedicated open-source community, and there’s always room for more involvement.
Getting involved is a great opportunity to collaborate with others, contribute to the project, and learn from experienced developers in the process.
How to Get Involved:
- Review Contribution Guidelines: Make sure to check Thanos’ contribution guidelines before submitting a pull request so you’re on the right track.
- Report Issues: If you find any bugs or have feature requests, you can open an issue on GitHub to bring them to the community’s attention.
- Join the Discussion: The Thanos community is active on GitHub, Slack, and forums. Join the conversation, ask questions, and share feedback to help shape the future of the project.
Conclusion
Prometheus and Thanos each play a crucial role in modern observability. Prometheus is perfect for real-time monitoring, providing quick insights into system performance.
Thanos, on the other hand, complements Prometheus by offering long-term storage, scalability, and high availability — ensuring you can manage large volumes of data flawlessly.
At Last9, we’re committed to helping you optimize your systems. We can reduce your total cost of ownership (TCO) by about 50%. If this sounds interesting, reach out to us — we’d love to chat!
FAQs
What is Thanos for Prometheus?
Thanos is an open-source tool that extends Prometheus by adding features like long-term storage, high availability, and global querying. It allows Prometheus to scale and provide better performance across large infrastructures.
What is the difference between Prometheus, Thanos, and Cortex?
Prometheus focuses on short-term data collection, while Thanos and Cortex provide scalability and long-term storage for Prometheus data. Thanos uses object storage for data retention, while Cortex uses a different approach for scaling.
How do I migrate from Prometheus to Thanos?
To migrate, deploy Thanos alongside Prometheus by adding the Thanos Sidecar and configuring remote write to upload your metrics to object storage. Use Prometheus HA to ensure high availability across your setup.
How many metrics can Prometheus handle?
Prometheus can handle millions of time-series metrics depending on the resources available. Scaling can be achieved by running multiple Prometheus servers or using Thanos for aggregation.
What is Prometheus?
Prometheus is an open-source monitoring and alerting system that collects time-series metrics, which can be queried using PromQL. It is commonly used in Kubernetes environments and integrates with tools like Grafana for creating real-time dashboards.
What if I have more than one instance of Prometheus running?
If you have multiple instances, Thanos allows you to aggregate metrics and query them globally using the Thanos Querier.
How is Prometheus different than other monitoring tools?
Prometheus focuses specifically on time-series data and integrates well with Kubernetes. Its Prometheus operator simplifies deployment, and its powerful query language, PromQL, allows for detailed metric analysis.

