

Prometheus vs ClickHouse, and Why Neither “Solves” It
TL;DR: Prometheus pays cardinality costs at write time (memory, index). ClickHouse pays at query time (aggregation memory). Neither is “better”:they fail differently. Design your pipeline knowing which failure mode you’re accepting.
—
Every month, someone posts “just use ClickHouse for metrics” or “Prometheus can’t handle scale.” Both statements contain a kernel of truth wrapped in dangerous oversimplification.
Here’s what actually happens: the same high-cardinality workload that melts Prometheus barely registers in ClickHouse during ingest. Engineers celebrate. Then, three weeks later, ClickHouse queries start timing out. Or OOMing. Or both.
The problem didn’t disappear. It moved. This post explains why.
Not to declare a winner:there isn’t one:but to give you the mental model to predict which system will fail, when, and how.
Why This Matters
Cardinality problems aren’t caused by bad users. They’re caused by mismatches between data shape and storage design.
Every metrics system makes architectural choices. Those choices determine:
- What’s cheap
- What’s expensive
- What’s impossible
Once you understand how the engine thinks, cardinality stops being mysterious:and starts being predictable.
The War Story
A prospect recently shared this story with me during a discovery call… they added a pod_id label to debug a networking issue. Seemed harmless; only had 200 pods in their Kubernetes monitoring setup. But with 50 metrics per pod and a 2-minute pod churn rate during deployments, they created 150,000 new series per hour. Prometheus memory climbed from 8GB to 32GB in a week.
They didn’t notice until prometheus got OOMKilled and took down alerting during a production incident. .
The fix took 10 minutes: metric_relabel_configs to drop the label. The outage took 3 hours to debug. The postmortem took a week.
That’s what this post is about: understanding why that happened, so you can see it coming.
A Note on Fairness
This comparison is inherently unfair. Prometheus is a monitoring system that happens to include a TSDB. ClickHouse is a general-purpose analytical database that happens to handle time-series workloads. They weren’t designed to compete.
But they end up competing because teams need both monitoring (Prometheus’s strength) and investigation (ClickHouse’s strength). Understanding how each handles cardinality helps you stop forcing square pegs into round holes.
The Core Question: Where Does Identity Live?
Before diving into internals, we need to understand the fundamental architectural difference.
Prometheus: Write-Time Identity
Unit of work: the sample (64-bit timestamp + 64-bit float).
Unit of cost: the series.
This distinction matters enormously. Appending a sample to a known series is O(1). Creating a new series requires memory allocation, symbol table updates, and posting list entries:overhead that compounds with scale.
http_request_duration_seconds{service="api", endpoint="/users", method="GET"}PromQL Query
This label set defines a series. That identity is established at write time and persists until retention deletes it: but the operational pain happens long before that.
ClickHouse: Read-Time Identity
Unit of work: the granule (8192 rows per granule, controlled by the index_granularity setting).
There’s no inherent “series” concept in the data model. Data arrives as rows, gets stored in columns, and identity emerges at query time through GROUP BY. How you type those columns matters as much as the query: see ClickHouse LowCardinality: when it helps and when it hurts for which columns to dictionary-encode and which to leave as plain strings.
SELECT service, endpoint, method, avg(duration)FROM http_requestsGROUP BY service, endpoint, methodClickhouse Query
The “series” only exists when you ask for it.
Important nuance: While the data model has no series, your ORDER BY clause determines what ClickHouse can skip. Databases get fast by not reading data. ClickHouse calls this pruning. Rows with the same leading key values are stored together, and the sparse index tracks min/max per granule. A query for service=‘api’ can skip every granule where service is never ‘api’. Your ORDER BY is really a pruning strategy in disguise.
Why This Matters
Why This Matters
| Prometheus | ClickHouse | |
|---|---|---|
| Cardinality cost | Ingest + Storage | Query time |
| Failure mode | OOM during scrape | OOM during aggregation |
| When it hurts | Immediately | When you query it |
| Recovery | Reduce series | Kill the query |
| Same data. Different failure points. |
Prometheus Internals: Why Cardinality Hurts Early
Let’s trace exactly what happens when high-cardinality data enters Prometheus.
The Cost of Series Creation
When a new label combination appears, Prometheus must:
- Hash the label set to create a unique identifier
- Allocate memory for the series struct (~200 bytes)
- Create posting list entries for every label
- Write to the WAL (write-ahead log)
- Allocate a chunk head for incoming samples (~128 bytes minimum)
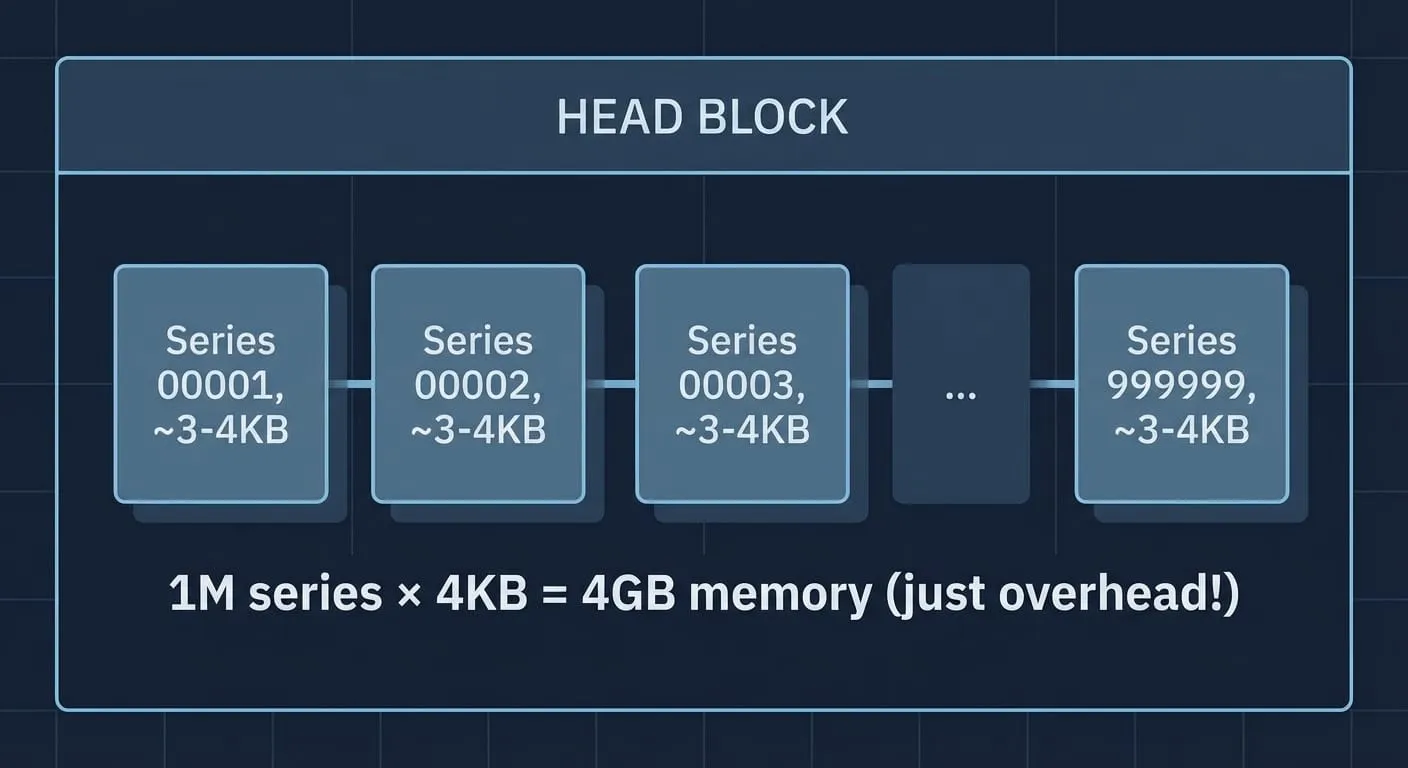
Concrete cost: ~3-4KB per active series in the head block.
At 1 million series, that’s 3-4GB of memory:just for series overhead, before storing sample values. At 10 million series, you need 30-40GB. Most Prometheus instances don’t have that.
For reference: tsdb/head.go, tsdb/index/postings.go
Head Block: Your Memory Budget
Prometheus keeps recent data (~2 hours by default) in memory in the “head block.”
Every. Active. Series. Lives. Here.
You can have plenty of disk space and still OOM. The head block doesn’t care about your disk.
Even after compaction moves data to disk, series identity and index entries remain within that block. However, here’s a nuance that matters for ephemeral series: the head block’s in-memory index is recycled during compaction (roughly every 2 hours). So while high-cardinality ephemeral series hurt you in the head block, the index pressure from those specific series is time-bounded:they’ll be compacted out.
The persistent problem is on-disk blocks: symbol tables (interned label strings) grow monotonically within each block, and won’t shrink until the block is deleted at retention time.
The GC Problem (Go Runtime)
Prometheus runs on Go. Go’s garbage collector is optimized for low-latency, not throughput. High series count means many small allocations scattered across the heap:
- GC pressure: More objects to scan
- Fragmentation: Memory that can’t be reclaimed efficiently
- GC storms: Under memory pressure, GC runs more frequently, stealing CPU
The GOGC tuning knob helps (default 100, try 50 for tighter memory), but you’re fighting the architecture.
When engineers report “Prometheus got slow during an incident,” they’re often seeing GC pauses compounding query latency. High cardinality doesn’t just use memory: it fragments it.
Compression: Gorilla Encoding and Its Limits
Prometheus uses Gorilla-style compression (from the Facebook paper):
- Timestamps: XOR of consecutive deltas (usually 0 for regular scrapes)
- Values: XOR of consecutive values (small for slowly-changing metrics)
This works beautifully for long-lived series with regular scrapes. It falls apart for ephemeral series:
Long-lived series (2 hours, 15s interval):  480 samples → compresses to ~1-2KB  Compression ratio: ~10x
Ephemeral series (5 minutes):  20 samples → still ~500 bytes overhead  Compression ratio: ~2x
A series with 20 samples has nearly the same overhead as one with 480. Ephemeral series (pods, containers, request IDs) destroy your storage efficiency.
Index Selectivity: When Filters Don’t Filter
Prometheus maintains an inverted index with posting lists:
label_name → [label_values]label_name=label_value → [series_ids]Multi-label queries work by posting list intersection:
Query: {service="api", endpoint="/users"}Posting lists:  service="api"     → [1, 2, 3, 47, 102, 103, ...]  (500 series)  endpoint="/users" → [2, 47, 891, ...]              (50 series)
Intersection: [2, 47]  ← Only 2 series to scan. Fast!
Until high cardinality enters:
Query: {service="api", user_id=~".*"}Posting lists:  service="api" → [1, 2, 3, ..., 500]    (500 series)  user_id="a1"  → [1001]                  (1 series each)  user_id="a2"  → [1002]

  ... (1 million entries) ...
Result: Still 500 series, but we checked 1M posting entries.
The index didn’t help. High-cardinality labels collapse selectivity.
Some implementations use Roaring Bitmaps for posting list compression:this reduces storage but doesn’t change the fundamental cost: you’re still iterating through millions of series IDs during intersection.
Query Execution: Limited Predicate Pushdown
Prometheus does have optimizations: block-level time filtering, chunk-level pruning, the index itself.
What it lacks is value-based predicate pushdown. You can’t say “only load chunks where value > 100.” Every matching series gets fully loaded, decompressed, then filtered. Under high cardinality, you’re loading vast amounts of data you’ll throw away.
Write Amplification
Every sample written causes:
- WAL write (synchronous)
- Head block append
- Compaction to disk (periodic)
- Block merges over time
High cardinality increases write amplification: more series means more index updates during compaction, larger posting lists to merge, less compressible data. Hence the surprise: “Why is disk I/O so high when ingest rate is constant?”
Metrics to Watch
Before cardinality bites you:
prometheus_tsdb_head_series # Active series countprometheus_tsdb_head_chunks_created_total # Rate of new chunksprometheus_tsdb_symbol_table_size_bytes # Memory for interned stringsprocess_resident_memory_bytes # Actual memory usageprometheus_tsdb_head_gc_duration_seconds # GC pressure indicatorIf head_series is growing faster than you expect, you have a cardinality problem brewing.
Key Takeaway
Prometheus is optimized for fast appends to known series. It’s not designed for unbounded identity growth.
”Just Add More Prometheus” Doesn’t Work
The reflex response when hitting limits is to scale Prometheus: “We’ll shard it.”
Sharding Distributes, It Doesn’t Reduce
10 million series ÷ 10 shards = 1 million series per shard
Each shard still has 1M series overhead.
Total series is still 10M.
The problem is smaller per-node but identical in aggregate.
Cross-Shard Aggregation Is the Killer
sum(rate(http_requests_total[5m])) with 10 shards:
- Query fans out to all shards
- Each computes partial results
- Coordinator aggregates
Cardinality that’s “safe” per-shard can exceed memory limits when aggregated at the coordinator.
Hot Shards Are Real
Consistent hashing by __name__ and labels means related series often land on the same shard. If one service has high cardinality, that shard gets disproportionately loaded while others idle.
You end up with hot shards hitting memory limits while the rest of your cluster has headroom. Rebalancing is painful.
What About Mimir, Thanos, VictoriaMetrics?
Mimir/Cortex: Horizontally scalable Prometheus-compatible storage. Better query planning, handles higher cardinality:but still uses the same TSDB model. Series are still the unit of cost. But I believe for my code exploration that they import the same code from prometheus for writing storage blocks.
Thanos: Long-term storage plus downsampling. Downsampling is cardinality reduction over time. Helps with storage, doesn’t solve ingest-time cardinality.
VictoriaMetrics: Claims better cardinality handling through more aggressive compression. Worth evaluating if you’re hitting limits. But it’s still write-time identity.
Last9: Better cardinality handling with isolation per series, that atleast does not bring down the entire system and impact is localized. But still has write-time identity.
These tools push the limits. None eliminate the fundamental trade-off.
Native Histograms: A Schema-Level Solution
Prometheus native histograms (stable in 3.8+) is a significant attempt at reducing cardinality in years.
Traditional histograms create 10-20 series per histogram (one per bucket). Native histograms store all buckets as a single series. 10-20x cardinality reduction with no loss of fidelity.
If histograms are a significant portion of your series count, this is the schema-level fix.
ClickHouse Internals: Why Cardinality Feels Different
ClickHouse is a columnar OLAP database. It handles time-series workloads with fundamentally different assumptions.
Columnar Storage: Compression by Design
Rows as written:  | timestamp | service | endpoint | user_id | duration |
Columns as stored:  timestamp: [t1, t2, t3, ...]        → Delta + ZSTD  service:   [api, api, api, ...]     → LZ4 (10-100x compression!)  user_id:   [abc, def, ghi, ...]     → LZ4 (poor compression)  duration:  [120, 85, 200, ...]      → Gorilla encoding
Low-cardinality columns compress 10-100x. High-cardinality columns don’t bloat other columns. Queries skip unused columns entirely.
Ingest “feels free” compared to Prometheus. You’re not paying per-identity overhead at write time.
The LowCardinality Trap
LowCardinality(String) is dictionary encoding for columns with few distinct values.
service LowCardinality(String) -- Good: few distinct valuesuser_id LowCardinality(String) -- Bad: millions of valuesIf cardinality exceeds ~10K distinct values, LowCardinality falls back to regular strings. You lose the benefit and pay overhead for the failed optimization.
LowCardinality(user_id) is a mistake. I’ve seen this in production.
ORDER BY: The Hidden Cardinality Decision
ClickHouse stores one sparse index entry per granule (8192 rows), containing min/max of primary key columns. Queries use this to skip irrelevant granules.
Query: WHERE service = 'api' AND timestamp > T1
Granules on disk (sorted by service, timestamp):┌─────────────┐ ┌─────────────┐ ┌─────────────┐ ┌─────────────┐│ service=api │ │ service=api │ │ service=web │ │ service=web ││ ts: T0-T2   │ │ ts: T2-T4   │ │ ts: T0-T2   │ │ ts: T2-T4   ││   READ ✓    │ │   READ ✓    │ │   SKIP ✗    │ │   SKIP ✗    │└─────────────┘ └─────────────┘ └─────────────┘ └─────────────┘
Sparse index: [api,T0], [api,T2], [web,T0], [web,T2]              ↑ matches query    ↑ doesn't match
Cardinality cost depends entirely on sort order:
-- Good: Low cardinality first, timestamp lastORDER BY (service, endpoint, method, timestamp)
-- Catastrophic: High cardinality firstORDER BY (trace_id, timestamp)
Put a high-cardinality column first and you’ve recreated Prometheus-style pain: no locality, poor compression, useless sparse index.
Sort order is a cardinality decision in disguise.
If you need multiple sort orders for different query patterns, ClickHouse projections let you maintain alternate orderings. But each projection stores additional data:the trade-off is storage for query flexibility.
Late Materialization and Vectorized Execution
ClickHouse evaluates queries differently:
- Apply filters using primary key (skip granules)
- Load only needed columns
- Aggregate in batches (vectorized, SIMD)
Vectorized execution processes thousands of values per CPU cycle. This is why ClickHouse can scan faster even with more data.
Contrast with Prometheus: it must load full chunks (timestamps + values) for every matching series, even for a simple count.
Where ClickHouse Hurts: GROUP BY Explosion
ClickHouse tolerates cardinality at rest. Queries are where you pay.
SELECT user_id, avg(duration)FROM http_requestsWHERE timestamp > now() - interval 1 hourGROUP BY user_idIf your query returns 1 million distinct groups, you need 1 million aggregation states in memory. That’s your RAM budget, spent.
The cardinality bill arrives at query time:
- Prometheus: Query slows, eventually times out
- ClickHouse: Query OOMs, kills connection
You haven’t solved cardinality. You’ve deferred the bill until query time.
Defensive settings:
SET max_memory_usage = 10000000000; -- 10GB limitSET max_bytes_before_external_group_by = 5000000000; -- Spill to disk at 5GBSET max_rows_to_group_by = 1000000;SET group_by_overflow_mode = 'throw'; -- Or 'any' to truncateThe Parts Problem
ClickHouse writes data in parts. Background merges combine small parts into larger ones.
When writes exceed merge throughput:
- Parts accumulate
- Queries slow (must check all parts)
- Eventually: TOO_MANY_PARTS exception, writes rejected
This typically happens during bulk imports, traffic spikes, or when disk I/O is saturated. High cardinality contributes because poorly-compressible data means larger parts and slower merges.
Watch these metrics:
- system.parts: Total part count
- system.replication_queue: Parts waiting to merge
- system.merges: Active merge operations
If part count grows over time, you’re heading for trouble.
Memory Model: C++ Gives and Takes
ClickHouse’s C++ gives deterministic memory control:
- max_memory_usage actually works (unlike JVM soft limits)
- No GC pauses
- Memory freed immediately when queries complete
But no safety net: exceed limits and you OOM, no negotiation.
The Comparison
| Concern | Prometheus | ClickHouse |
|---|---|---|
| 1M series ingest | ~4GB RAM minimum | ~100MB (schema-dependent) |
| 1M cardinality GROUP BY | Times out | Needs ~2-4GB RAM |
| Recovery from failure | Reduce series at source | Kill query, adjust limits |
| Write-time identity | Expensive | Cheap (append) |
| Real-time alerting | Native, <1s | Possible, requires work |
| Exploratory queries | Weak under cardinality | Strong |
| Vectorized execution | No | Yes |
| Memory model | Go GC (pauses) | C++ (deterministic) |
Why Hybrid Pipelines Exist
Modern observability stacks rarely use one system:
Raw metrics (high cardinality) │ ▼Streaming aggregation / rollups │ ├──► Prometheus (aggregated) ──► Alerts, SLOs, dashboards │ └──► ClickHouse (raw) ──► Investigation, explorationDifferent questions have different cost profiles. Streaming aggregation lets you have both: raw data for investigation, aggregated data for dashboards.
The Cost Angle
Cardinality isn’t just performance:it’s money. In managed Prometheus, you pay per active series. In ClickHouse Cloud, you pay for storage and compute.
A single high-cardinality label can 10x your bill overnight. That “helpful” request_id label someone added to debug a production issue? It’s now costing $50K/month.
What About TimescaleDB, QuestDB, InfluxDB, Druid?
This post focuses on Prometheus and ClickHouse because they represent two archetypal approaches:
- Write-time identity (Prometheus model)
- Read-time identity (columnar model)
The fundamental tension remains: millions of distinct identities means something has to track them.
The Design-Time Decision
Before Adding a High-Cardinality Label
Verify:
- Which system will store this data? (Prometheus? ClickHouse? Both?)
- Does the product provide a runtime cardinality explorer?
- Is this for alerting or investigation? (Alerting must be bounded. Investigation can be unbounded.)
- What’s the expected cardinality? (Count distinct values × other label combinations)
- What’s the growth rate? (Will this 10x in a year?)
- Is there a fallback? (Can you drop this label via relabel configs if needed?)
- Who owns this label? (Who gets paged when it causes problems?)
If you can answer these questions, you’re designing for cardinality:not just tolerating it.
Closing Thought
The most expensive label in your system isn’t the one with the most values.
It’s the one nobody questioned when it was added.
Further reading:
- Gorilla: A Fast, Scalable, In-Memory Time Series Database (Facebook, 2015)
- Prometheus TSDB
- ClickHouse MergeTree
Thanks to @pdvyas for early draft review.


