

Logs aren’t just logs—they’re vital assets for monitoring and understanding system health. The ELK Stack (often called the Elastic Stack), is a popular open-source suite for managing logs and analyzing data.
Originally built with three core tools—Elasticsearch, Logstash, and Kibana—this stack has evolved into a key platform for observability and in-depth log analysis.
In this blog, we’ll talk about what is elk, its core components, implementation guide, and more.
Key Elements of the ELK Stack
Each component of the ELK Stack has a unique role, working together to enable a powerful flow of data collection, transformation, storage, and visualization.

Elasticsearch
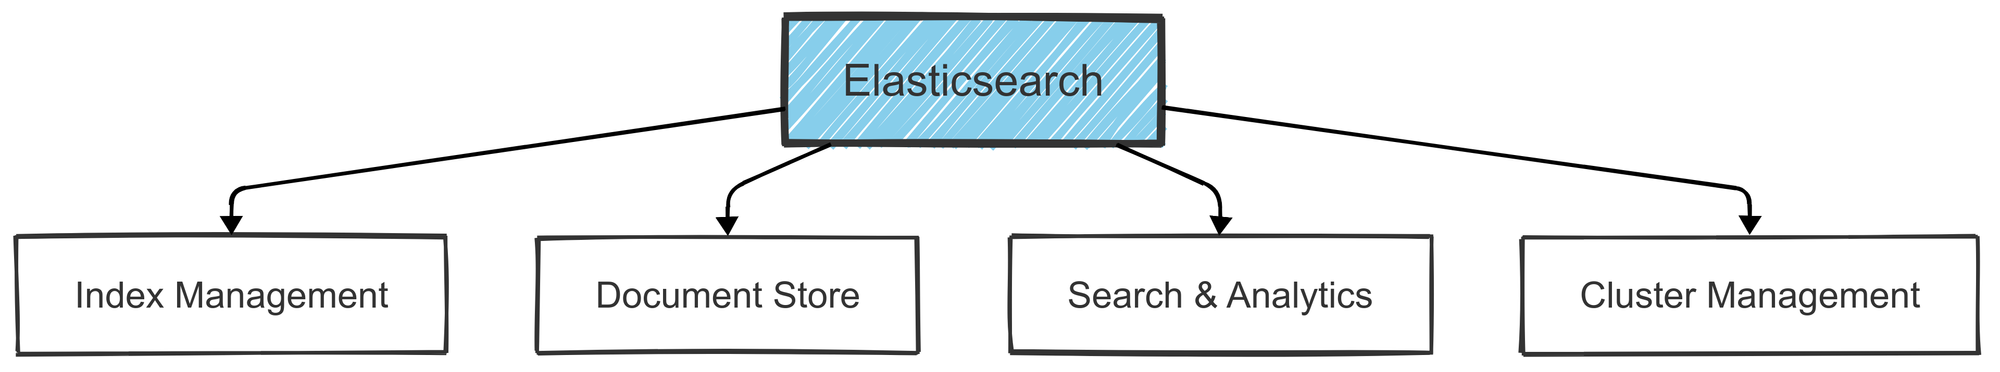
At the core of the ELK Stack is Elasticsearch, an advanced search and analytics engine built on Apache Lucene. Think of it as a supercharged database for efficiently searching and analyzing vast amounts of data.
Whether you're looking to install Elasticsearch on Linux or Ubuntu, this tool is crucial for building robust search and analytics solutions.
Key Features:
- Fast Search: Elasticsearch is optimized for full-text search and complex queries, making it ideal for tasks like data analysis and real-time log monitoring.
- Real-Time Processing: It processes incoming data on the fly, giving near real-time insights to help teams take action quickly.
- Scalability: Its distributed architecture allows Elasticsearch to scale horizontally. Add more nodes to balance the load and ensure high availability, especially in larger environments.
- RESTful API: Elasticsearch connects easily with other systems through its REST API, simplifying integration with tools like Kibana and Logstash.
Sample Elasticsearch Document: Below is an example of a typical Elasticsearch document structure used for ingesting log entries:
{
  "timestamp": "2024-03-15T10:00:00Z",
  "service": "web-app",
  "level": "ERROR",
  "message": "Database connection failed",
  "metadata": {
    "host": "prod-server-01",
    "environment": "production",
    "version": "2.3.4"
  },
  "metrics": {
    "response_time": 1500,
    "retry_count": 3
  }
}
In this example, the document holds details about an error in the web-app service, including metadata like host and environment details. These structured fields make searching and filtering straightforward in Elasticsearch.
How to Install and Configure Elasticsearch: Step-by-Step
- Install Elasticsearch:
- Download and install Elasticsearch on your machine or server. On Linux or Ubuntu, you can install it using
aptoryum. For Docker users, Elasticsearch can be easily pulled using:
- Download and install Elasticsearch on your machine or server. On Linux or Ubuntu, you can install it using
docker pull docker.elastic.co/elasticsearch/elasticsearch:7.10.0- To start Elasticsearch, run the service (on Linux, you can use
systemctl start elasticsearch), or if using Docker, run the container with:
docker run -d --name elasticsearch -p 9200:9200 docker.elastic.co/elasticsearch/elasticsearch:7.10.0- Configure Elasticsearch:
- After installation, configure Elasticsearch through the
elasticsearch.ymlconfiguration file. It typically lives in/etc/elasticsearch/or/usr/share/elasticsearch/config/on Linux. - Important configurations include:
- Set network.host to allow connections from other machines:
network.host: 0.0.0.0
http.port: 9200- You can also adjust node.name and cluster.name if you're setting up a multi-node cluster.
- Start Elasticsearch Service:
Start Elasticsearch if it's not running. On Linux, this can be done via:
sudo systemctl start elasticsearchTo check if it’s running correctly, use curl to send a request to Elasticsearch:
curl -X GET "localhost:9200/"You should see a response with details about your Elasticsearch instance.
- Check Data Ingestion:
Elasticsearch is now ready to accept data. You can start indexing data by sending it through the Elasticsearch RESTful API or via Logstash (as detailed in the previous step). Ensure the data is being ingested properly by querying it.
Logstash
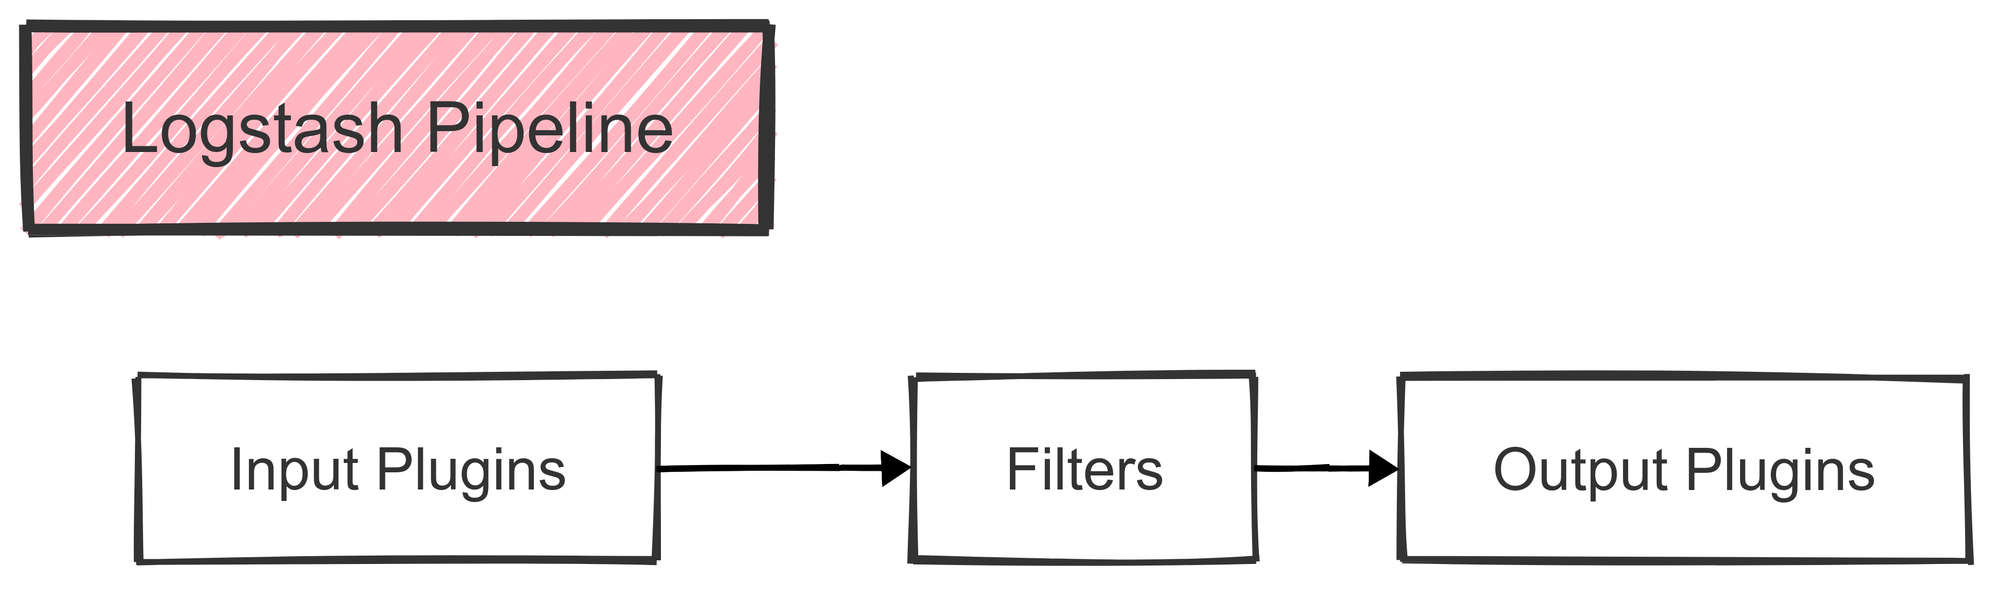
Logstash serves as the bridge between various data sources and Elasticsearch. It’s a highly flexible data processing pipeline that collects data, processes it, and then sends it to one or more destinations (like Elasticsearch or even a backup storage).
This flexibility allows it to handle different log formats, making it ideal for environments with diverse data sources.
Key Features:
- Data Collection: Logstash collects data from multiple sources, such as databases, application logs, and other structured or unstructured formats.
- Data Parsing and Transformation: Using built-in filters, Logstash can transform raw data into a structured format that’s easier to analyze.
- Data Enrichment: With its filters, Logstash can add new fields or tags, like adding an
environmentfield to each log entry. - Output Customization: Logstash supports numerous output destinations, from Elasticsearch to cloud storage and beyond, allowing flexibility in data handling.
Example Logstash Pipeline Configuration:
Below is an example of a Logstash configuration that collects data from a filebeat source and a PostgreSQL database, processes it, and sends it to Elasticsearch and Amazon S3:
input {
  filebeat {
    hosts => ["localhost:5044"]
    index => "filebeat-%{+YYYY.MM.dd}"
  }
  jdbc {
    jdbc_connection_string => "jdbc:postgresql://localhost:5432/mydb"
    jdbc_user => "postgres"
    schedule => "* * * * *"
    statement => "SELECT * FROM system_logs WHERE timestamp > :sql_last_value"
  }
}

filter {
  grok {
    match => { "message" => "%{COMBINEDAPACHELOG}" }
  }
  date {
    match => [ "timestamp", "dd/MMM/yyyy:HH:mm:ss Z" ]
    target => "@timestamp"
  }
  mutate {
    add_field => { "environment" => "production" }
  }
}

output {
  elasticsearch {
    hosts => ["localhost:9200"]
    index => "logs-%{+YYYY.MM.dd}"
  }
  s3 {
    bucket => "my-backup-bucket"
    region => "us-east-1"
  }
}
This pipeline collects logs from different sources, parses them, and then sends them to Elasticsearch for analysis and S3 for storage, showcasing the flexibility of Logstash in managing log data.

How to Install and Configure Logstash: Step-by-Step
- Install Logstash:
- First, download and install Logstash. On Linux or Ubuntu, you can use your system’s package manager, like
aptoryum, to install it. If you prefer using Docker, you can pull the Logstash Docker image and run it as a container.
- First, download and install Logstash. On Linux or Ubuntu, you can use your system’s package manager, like
- Configure the Logstash Configuration File (
logstash.conf):- After installation, create or edit the Logstash configuration file (
logstash.conf). This file defines the input (where the data comes from), filters (how the data is processed or transformed), and output (where the data is sent, like Elasticsearch). - Example input might look like:
- After installation, create or edit the Logstash configuration file (
input {
  file {
    path => "/path/to/your/logfile.log"
    start_position => "beginning"
  }
}- This tells Logstash to read logs from a specific file.
- Set Up Elasticsearch:
- Logstash sends data to Elasticsearch, so you need to ensure that Elasticsearch is installed and running. The easiest setup involves ensuring that Elasticsearch listens on the default port (9200).
- In your elasticsearch.yml file, confirm that Elasticsearch is configured to accept data from Logstash. A typical setting might look like:
network.host: 0.0.0.0
http.port: 9200- This enables Elasticsearch to communicate and accept data from external services, including Logstash.
- Enable Data Processing and Ingestion:
- Once everything is configured, start Logstash. It will begin processing and ingesting logs based on the input configuration. You can define specific filters if you want to enrich or transform the data. For example, you might add a filter to tag logs based on the environment:
filter {
  mutate {
    add_field => { "environment" => "production" }
  }
}- Output the Data to Elasticsearch:
- After processing, you’ll send the data to Elasticsearch. Here’s how to define the output section in your Logstash config:
output {
  elasticsearch {
    hosts => ["http://localhost:9200"]
    index => "logs-%{+YYYY.MM.dd}"
  }
}- This tells Logstash to send the data to the local Elasticsearch instance and create an index named
logs-YYYY.MM.DD.
- Adjust Firewall Settings (if needed):
- If you're running Logstash and Elasticsearch on different machines, make sure the firewall allows traffic on the ports used by Elasticsearch (default: 9200) and Logstash. You may need to open these ports to allow communication.
Kibana
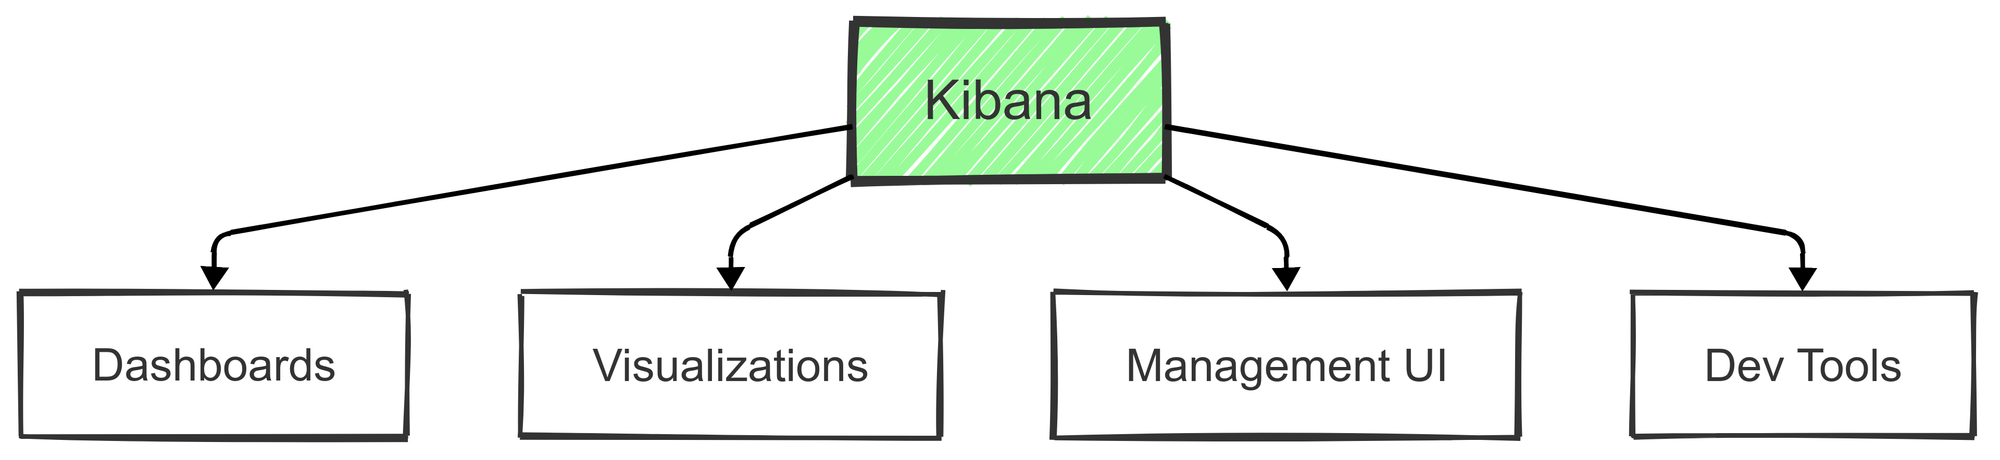
Kibana acts as the visual interface for the ELK Stack, allowing users to analyze and visualize the data stored in Elasticsearch. It’s like the command center for creating interactive dashboards, monitoring real-time events, and discovering patterns in data.
Key Features:
- Interactive Dashboards: Kibana lets users create custom dashboards to track metrics in real-time. These can range from simple metrics to complex, layered visualizations.
- Data Visualization: Offers a variety of visualizations—bar charts, line graphs, pie charts, and more—helping users understand data patterns.
- Geospatial Capabilities: Kibana supports geospatial data, so users can create maps that represent log data with location information.
- Alerting: Kibana can set up alerts to notify users when specific conditions are met in their data, such as error spikes or unusual traffic levels.
Popular Visualization Types in Kibana:
- Time-Series: Ideal for tracking data over time, such as server response times or error occurrences.
- Geospatial Maps: Useful for visualizing data that includes geographical information.
- Heat Maps: Provides density-based visualizations, helpful for spotting hotspots in data.
- Statistical Charts: Useful for presenting summaries and statistical analysis on datasets.
How to Install and Configure Kibana: Step-by-Step
1. Install Kibana
First, download and install Kibana, the front-end visualization tool for Elasticsearch. You can install it via apt or yum on Linux, or use Docker:
Using Docker:
docker pull docker.elastic.co/kibana/kibana:7.10.0To run Kibana:
- On Linux (using service command):
sudo systemctl start kibana- Or, using Docker:
docker run -d --name kibana -p 5601:5601 docker.elastic.co/kibana/kibana:7.10.02. Configure Kibana
Now that Kibana is installed, you need to configure it. Edit the kibana.yml file, which is typically found in /etc/kibana/ on Linux. The important settings are:
- Set server host: Allow external connections by setting the host to
0.0.0.0:
server.host: "0.0.0.0"
- Define Elasticsearch hosts: Point to your Elasticsearch instance:
elasticsearch.hosts: ["http://localhost:9200"]
3. Start Kibana Service
If Kibana isn’t already running, start it using:
sudo systemctl start kibana4. Verify Kibana is Running
To ensure Kibana is working, open your browser and navigate to:
http://localhost:5601
This should load the Kibana dashboard.
5. Visualize Your Data
Once Kibana is running, you can start exploring your data stored in Elasticsearch. Kibana allows you to:
- Create custom dashboards
- View logs
- Build charts to analyze data
6. Create Index Patterns
To use your data in Kibana, you need to create an index pattern that corresponds to your Elasticsearch indices. Here’s how:
- Go to the Kibana interface.
- Navigate to Management > Index Patterns.
- Create a new pattern that matches your Elasticsearch indices (e.g.,
logs-*).
7. Add Visualizations and Dashboards
Use Kibana’s built-in tools to create visualizations like pie charts, bar graphs, and more. Once you’ve created these, combine them into dashboards to analyze your data effectively.
What Else is in the ELK Stack Ecosystem?
Beyond Elasticsearch, Logstash, and Kibana, the ELK Stack also includes additional tools that enhance data collection, integration, and security.
These extended tools add flexibility and specialized functionality, making it easier to manage data from diverse sources and monitor various aspects of system health.
Beats Family
The Beats suite is a collection of lightweight data collection agents designed to send various types of operational data to Logstash or Elasticsearch. Each Beat is specialized for a specific type of data, enabling focused and efficient data collection.
Filebeat
Filebeat is ideal for monitoring and shipping log files from servers. It’s a lightweight solution, built to handle large volumes of log data efficiently and securely.
- Log Specialization: Tailored to track changes in log files, so every update to a file is quickly captured.
- Secure Log Shipping: Encrypts data during transmission, maintaining data integrity between systems.
- Built-in Modules: Supports many common log formats (e.g., Apache, NGINX) with minimal configuration.
- Field Recognition: Automatically tags and categorizes fields, making it easier to parse logs in Elasticsearch.
Metricbeat
Metricbeat is used to collect and ship system and service metrics, such as CPU usage, memory usage, and uptime.
- System Metrics: Tracks metrics related to CPU, memory, disk usage, and more, for complete visibility into system performance.
- Performance Monitoring: Offers insights into how well applications and servers are performing, with support for cloud services, databases, and containers.
- Resource Utilization: Provides data on resource consumption, helping teams manage capacity.
- Health Checks: Periodically checks the health of various services, ensuring early detection of issues.
Other Specialized Beats
In addition to Filebeat and Metricbeat, the Beats family includes tools designed for specific types of data collection:
- Packetbeat: Monitors network traffic, providing visibility into protocols like HTTP, MySQL, and DNS. Great for network diagnostics and performance tracking.
- Heartbeat: Focused on uptime monitoring, it regularly checks the availability of specified systems and notifies if any go down.
- Auditbeat: Useful for security analytics, especially for tracking changes to files and permissions, as well as monitoring user activities.
- Winlogbeat: Specifically for Windows environments, it captures Windows event logs, making it easier to monitor Windows-based systems in mixed environments.
How to Connect ELK to Your Ecosystem
The ELK Stack offers robust integration options, making it suitable for use across multiple environments, including cloud platforms and security setups.
These integrations help users pull data from various sources and monitor distributed applications and services easily.
Integrating ELK with Cloud Platforms
Many organizations run parts of their infrastructure in the cloud, and the ELK Stack integrates with popular cloud platforms to streamline monitoring and data analysis.
AWS Integration
For Amazon Web Services (AWS), Elastic Stack provides several native integrations, making it easy to monitor AWS services:
- AWS Service Monitoring: Supports monitoring for core AWS services, such as EC2, RDS, and Lambda.
- Amazon Elasticsearch Service (ES) Compatibility: Works effortlessly with Amazon’s managed Elasticsearch service, helping users utilize Elasticsearch without needing to manage the infrastructure.
- CloudWatch Integration: Aggregates CloudWatch metrics and logs, centralizing AWS monitoring data in a single interface.
- S3 Archiving: Enables users to store log data in S3 buckets, providing long-term storage options.
Azure Solutions
Microsoft Azure users also benefit from Elastic Stack’s Azure integrations, allowing for efficient monitoring and management.
- Azure Monitor Integration: Brings Azure Monitor data into Elasticsearch, centralizing cloud monitoring across platforms.
- Managed Elasticsearch Services: Elastic partners with Azure to offer managed Elasticsearch services, reducing the operational overhead of running the ELK Stack.
- Cloud-Native Monitoring: Built-in support for Azure resources helps streamline cloud monitoring for Azure-based services.
- Scalable Deployment Options: Azure offers scalability options to grow Elasticsearch deployments as needed.
Security and Monitoring
As more organizations rely on ELK Stack for security monitoring and incident detection, it has developed features to enhance security monitoring, data protection, and customizability.
- SIEM Capabilities: ELK Stack now has Security Information and Event Management (SIEM) functionality, providing capabilities for centralized security event logging and correlation.
- Application Performance Monitoring (APM): Tracks application performance, identifying bottlenecks and potential failures before they impact users.
- Plugin Architecture: The plugin system allows users to extend Elastic’s capabilities, customizing it to fit specific needs or integrating with third-party tools.
- Threat Detection and Response: Helps detect and respond to potential security threats, with support for adding machine learning to flag anomalies automatically.

Enterprise Setup for ELK Stack
Cluster Configuration
A reliable ELK setup starts with a properly configured cluster. Below is a sample configuration for a production-ready Elasticsearch cluster:
# Elasticsearch configuration
cluster.name: production-elk-cluster
node.name: node-1
network.host: 0.0.0.0
http.port: 9200
discovery.seed_hosts: ["host1", "host2"]
cluster.initial_master_nodes: ["node-1"]
xpack.security.enabled: true  # Enables security features
High Availability Setup
To ensure high availability, set up a load balancer to manage requests across multiple nodes. This configuration provides redundancy, ensuring data remains accessible even if one node goes down:
# Load balancer configuration
upstream elasticsearch {
    server es01:9200;
    server es02:9200;
    server es03:9200;
}
Enhancing ELK Stack Performance
Optimizing performance is essential for large datasets and high query rates. Key areas include index and query optimization.
Index Management
- Lifecycle Policies: Automate index transitions (hot, warm, cold) based on usage.
- Shard Allocation: Define shard numbers based on data volume and query rates.
- Compression: Use compression to save disk space for long-term storage.
Query Optimization
- Search Optimization: Tune queries to limit resource consumption.
- Aggregation Tuning: Improve response times for aggregations.
- Memory Management: Adjust heap size and manage memory allocation efficiently.
How Can the ELK Stack Work for You
The ELK Stack can support complex data processing and analytics, especially useful in monitoring, security, and BI scenarios.
Log Analysis and Monitoring
- Centralized Logging: Aggregate logs from multiple sources in real-time.
- Pattern Recognition & Anomaly Detection: Spot trends and irregularities in data streams.
Security Analytics
- Threat Detection: Detect suspicious patterns in logs.
- Compliance Monitoring: Set up regular checks for security compliance.
- Access Auditing: Track access attempts to maintain security records.
Best Practices for using ELK
Data Management
- Index Templates: Predefine settings for new indices to maintain consistency.
- Lifecycle Policies: Define retention and delete policies for outdated data.
- Backup & Recovery: Regularly backup data and test recovery processes.
Security
- Authentication: Implement user authentication for access control.
- Role-Based Access Control (RBAC): Assign roles based on user needs.
- Encryption: Encrypt data at rest and in transit for added security.
Key Considerations for Deploying ELK in the Cloud
For cloud setups, consider the following configurations:
AWS Implementation
- Managed Elasticsearch Service: Utilize AWS-managed Elasticsearch for streamlined operation.
- AWS Integration: Use CloudWatch and S3 for logging and backups.
- Cost Management: Monitor usage to prevent excessive costs.
Azure Deployment
- Azure Monitor Integration: Integrate with Azure services for centralized monitoring.
- Scaling Options: Configure auto-scaling to manage demand effectively.
- Security: Use Azure’s native security tools to protect your deployment.
Monitoring and Maintenance of ELK Stack
Routine monitoring and maintenance ensure the long-term health and efficiency of your ELK Stack deployment.
Health Monitoring
- Cluster Health: Track overall health, including node availability and shard status.
- Resource Utilization: Monitor CPU, memory, and disk usage to prevent bottlenecks.
- Capacity Planning: Project future resource needs based on usage trends.
Lifecycle Management
- Data Retention: Define policies for data storage duration.
- Upgrades: Plan for upgrades to avoid downtime and maintain compatibility.
- Backup Verification: Regularly test backups to ensure data reliability.
Conclusion
The ELK Stack is a powerful and flexible tool for managing logs and analyzing data. It’s great at handling large amounts of information, storing data efficiently, and providing real-time insights for troubleshooting.
On the other hand, if you're looking for a modern, easy-to-use solution to enhance your observability, Last9 might be just what you need.
Last9 simplifies observability while staying cost-effective for companies of any size. It brings together metrics, logs, and traces in one unified view, making it easy to connect the dots and stay on top of alerts. Plus, it works smoothly with Prometheus and OpenTelemetry, enhancing your monitoring experience.
Schedule a demo with us or try it for free to learn more about it!
FAQs
Q: What is the purpose of the ELK Stack?
A: The ELK Stack is used for managing logs, analyzing data, and tracking system performance in IT environments, making it ideal for cloud-native applications in Kubernetes. DevOps teams rely on it for troubleshooting issues, storing data, and analyzing logs across various sources, including syslog or JSON formats. It’s also widely used for security analysis, especially with TLS and SSL encryption in mind.
Q: How does the ELK Stack manage large data volumes?
A: The ELK Stack uses a distributed setup, including Elasticsearch, which indexes and searches data quickly. This allows it to handle big data loads efficiently. As data increases, it scales well, especially when used with containerized setups like Kubernetes. Elasticsearch’s indexing and search capabilities are particularly useful for managing large logs and JSON data formats.
Q: What are common use cases for the ELK Stack?
A: The ELK Stack is typically used for centralized logging, application monitoring, and security analysis. It's especially useful for real-time data tracking, often in DevOps workflows or web server environments. The stack is great for analyzing logs across different sources, such as GitHub, syslog, and other services, and can be configured to support GPG-key management for secure data handling.
Q: Can the ELK Stack integrate with cloud platforms?
A: Yes, the ELK Stack integrates easily with cloud platforms like AWS and Azure, and services like Amazon Elasticsearch and Azure Monitor. It can handle data from cloud-native applications, including Kubernetes-managed containers, making it a great choice for centralized logging and visualization in a cloud environment.
Q: What can I use instead of Kibana for visualizing data?
A: While Kibana is the primary visualization tool for the ELK Stack, alternatives like Grafana and Graylog are also compatible with Elasticsearch data. These tools offer different styles of visualizations and dashboards, and may be preferred when users seek specific integrations or enhanced customization.

