

You’ve instrumented your LangChain app, and traces are now flowing into Last9.
Now the issues are visible: API costs are crossing $200/day, average response times exceed 3 seconds, and performance degrades under 100 concurrent users. A single tool call adds over 2 seconds. Bloated context windows are pushing up token usage, wasting $50/day.
Here’s how to use trace data to identify and fix these inefficiencies, systematically and at scale.
Read Trace Data to Spot Performance Issues
Trace data gives you a step-by-step view of how your LangChain app runs in production. One common issue: chains that wait on LLM calls that could run in parallel.
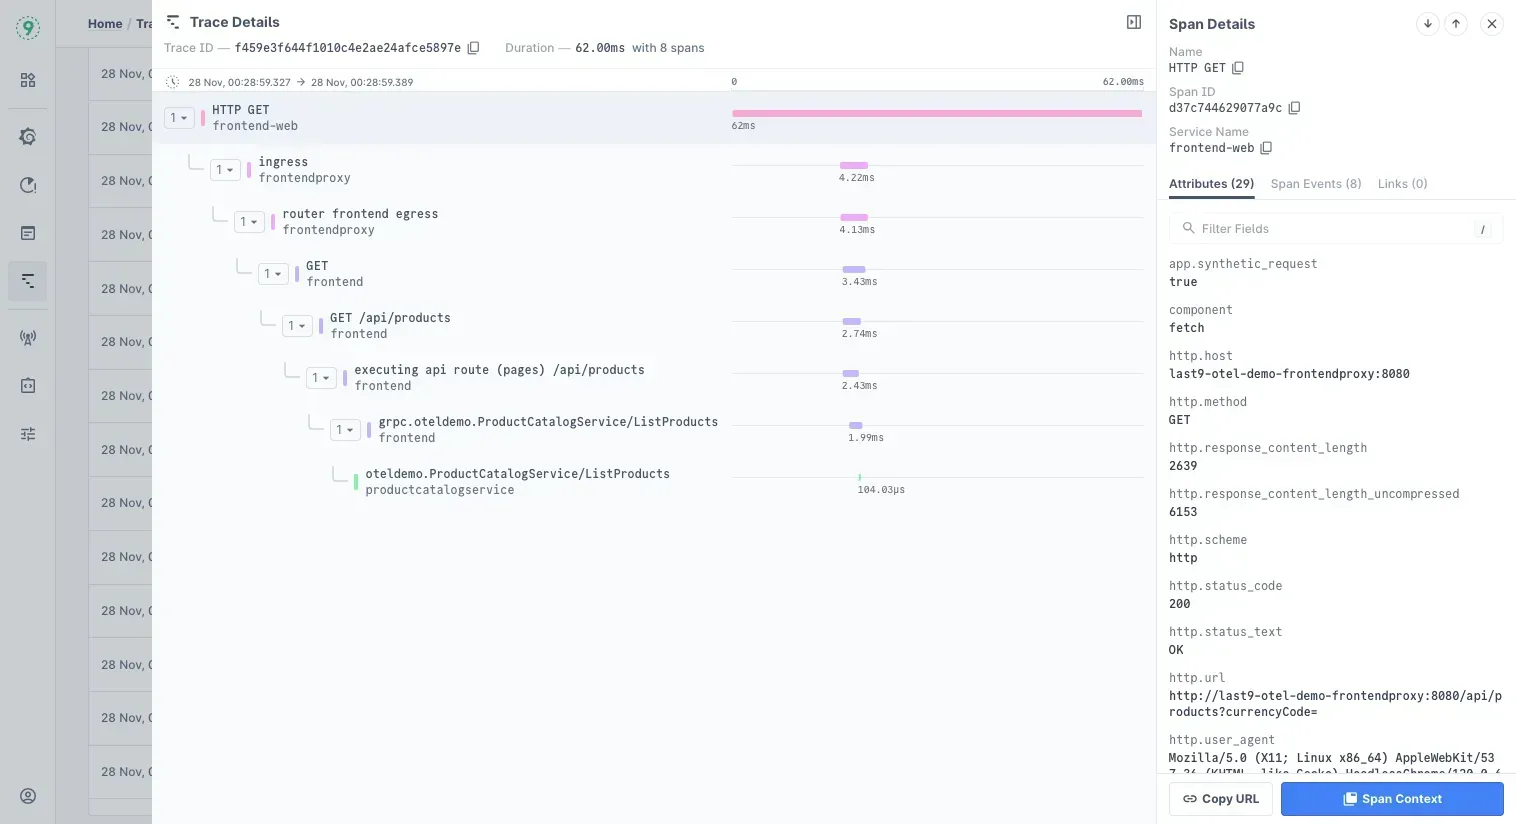
In Last9’s waterfall view, each call is plotted along a timeline.
If you see this pattern:
LLM Call 1 [████████████████████████████] 2.1sLLM Call 2 [████████████████████████████] 2.3sLLM Call 3 [████████████████████████████] 1.9s— you’re looking at 6+ seconds of total latency, even though each call takes only around 2 seconds.
If these calls are independent, they don’t need to block each other. You can run them in parallel and cut your latency significantly.
Here’s how to do that using asyncio with LangChain’s RunnableLambda:
import asynciofrom langchain_core.runnables import RunnableLambda
async def parallel_llm_calls(input_data):    tasks = [        call_llm_1(input_data),        call_llm_2(input_data),        call_llm_3(input_data),    ]    return await asyncio.gather(*tasks)
parallel_chain = RunnableLambda(parallel_llm_calls)
This approach is useful when your agent runs multiple calls that don’t share data or depend on each other’s outputs.
If any of the LLM calls rely on the results of previous steps, keep them sequential. Parallel execution only works when the calls are independent.
Last9 helps here by showing LangChain-native traces, not just raw HTTP spans or service metrics. You can see each tool, chain, retriever, and model step, along with the exact durations, so it’s easy to spot where time is being lost.
Review Trace Data to Spot Repeated Tool Calls
Another pattern worth checking: the same tool being called multiple times in quick succession.
Tool: search_web [████] 0.3sTool: search_web [████] 0.4sTool: search_web [████] 0.3sTool: search_web [████] 0.5sThis isn’t always an issue; some workflows genuinely need multiple lookups. But when the calls are nearly identical, it usually points to inefficiencies:
- The prompt may be vague, causing the agent to fetch data in fragments.
- A planner step might be looping unintentionally.
- A retriever or tool wrapper might be misconfigured.
These inefficiencies show up clearly in the trace context. You’ll often find that a single, better-structured call could replace several smaller ones.
It also adds up quickly. Four calls at $0.02 each don’t seem like much, but across 1,000 users a day, that’s $60 in unnecessary spend.
If the data fetched is stable or predictable, consider caching the result or guiding the agent to request it more efficiently. Small prompt tweaks or logic updates can make a noticeable impact on latency and cost.
If you’re setting up trace collection for the first time, this guide on LangChain observability covers what data to capture and how to export it.
Analyze Trace Data to Reduce Token Usage
High token usage slows down responses and drives up cost. In Last9, you can track tokens per chain directly from the chain.tokens_used attribute, no manual logging or custom metrics required.
Unlike other APM tools, Last9 surfaces token usage at the chain level, so it’s easy to understand where things go wrong and where cost adds up.
Start by looking at the size of the context window passed into the model:
Chain A: 1,200 tokensChain B: 8,400 tokensChain C: 1,100 tokensChain B is the outlier. That’s usually caused by:
- Full conversation history being passed in every time
- Large documents without chunking or filtering
- Repeated context across multiple steps in the chain
Check the inputs field in your trace. If you’re passing an entire document or thread, trim it down before calling the model. Context pruning can drastically cut token usage without losing accuracy.
Refine prompts to reduce waste
Bloated prompts are another common source of token overhead. Here’s a simple example:
# Inefficient prompt"""Please analyze the following text very carefully and provide a detailed summary.Make sure to include all the important points and don't miss anything significant.Here is the text to analyze:{text}Please provide your analysis in a comprehensive manner."""
# Optimized version"Summarize the key points from this text:\n{text}"
This change saves roughly 50 tokens per request. At 1,000 requests per day, that’s ~$30/month saved on GPT-4, without changing the result.
Match Model Choice to Task Complexity
Trace data often reveals where GPT-4 is being used for tasks that don’t need it, like summarization, classification, or simple extraction. These can be offloaded to GPT-3.5 to reduce latency and cut costs.
Here’s a simple routing pattern you can add to your chain logic:
def select_model(task_type): if task_type in ["summarize", "extract", "classify"]: return "gpt-3.5-turbo" elif task_type in ["reason", "analyze", "create"]: return "gpt-4" return "gpt-3.5-turbo"Even small changes in routing can make a difference at scale. If your traces show GPT-4 being used for low-complexity tasks, adjust your logic to keep spending predictable and response times low.
Use trace spans to detect slow memory leaks
Long-running agents can accumulate memory over time, especially if they build up context or cache results without cleanup. These issues rarely crash your app immediately but show up as degraded performance or latency spikes over hours or days.
In Last9, you can track memory usage across traces by attaching memory data to spans. This helps you pinpoint where memory starts creeping up, whether it’s after every request, tool call, or retriever step.
Add a simple memory tracker to your callback handler:
import psutilimport gcfrom langchain_core.callbacks import BaseCallbackHandler
class MemoryTrackingCallback(BaseCallbackHandler):    def on_chain_start(self, serialized, inputs, **kwargs):        process = psutil.Process()        memory_mb = process.memory_info().rss / 1024 / 1024        if self.span:            self.span.set_attribute("memory.start_mb", memory_mb)
    def on_chain_end(self, outputs, **kwargs):        process = psutil.Process()        memory_mb = process.memory_info().rss / 1024 / 1024        if self.span:            self.span.set_attribute("memory.end_mb", memory_mb)
        if memory_mb > 500:            gc.collect()
By logging memory.start_mb and memory.end_mb to each trace, you can visualize how memory shifts across chains. If memory usage climbs consistently across similar traces, it’s a signal that something, like documents, tool outputs, or intermediate state, isn’t being released.
This is especially useful for diagnosing issues that don’t surface during local testing but appear after hours of continuous traffic in production.
If you’re running into gaps or missing data in your LangChain traces, our guide on troubleshooting trace issues covers common fixes.
Advanced Techniques for LangChain Performance Tuning
The optimizations above can help cut 40–60% of your costs. But if you’re running LangChain at scale, multi-user apps, 24/7 agents, and high concurrency, these advanced techniques can push savings beyond 80%. They also improve stability for long-lived chains.
Cache LLM Responses Safely
If you’re using a low temperature (0–0.3), many prompts will yield repeatable outputs. Caching those responses avoids paying for identical completions across users or sessions. But naive string-matching caches often break when model parameters change or prompt wording shifts.
Here’s a better approach:
import hashlibimport jsonfrom typing import Dict, Any
class SmartCache:    def __init__(self, max_size=1000):        self.cache = {}        self.max_size = max_size
    def get_cache_key(self, prompt: str, model: str, params: Dict[str, Any]) -> str:        cache_data = {            "prompt": prompt,            "model": model,            "temperature": params.get("temperature", 0.7),            "max_tokens": params.get("max_tokens", 1000)        }        return hashlib.md5(json.dumps(cache_data, sort_keys=True).encode()).hexdigest()
    def get(self, key: str):        return self.cache.get(key)
    def set(self, key: str, value: Any):        if len(self.cache) >= self.max_size:            self.cache.pop(next(iter(self.cache)))        self.cache[key] = value
Usage:
cache = SmartCache()
def cached_llm_call(prompt, model="gpt-3.5-turbo", **params):    cache_key = cache.get_cache_key(prompt, model, params)    result = cache.get(cache_key)    if result:        return result
    result = llm.invoke(prompt, **params)    cache.set(cache_key, result)    return result
This setup creates reliable cache keys and avoids duplication, even across small parameter changes. You can also swap the in-memory store with Redis or Memcached for multi-node workloads.
Tip: For frequently updated inputs (e.g., real-time data), set a short TTL or add cache-busting logic based on freshness.
Track and Optimize Tool Usage
External tool calls, search APIs, web scrapers, and PDF readers often account for more latency than LLM completions. If you’re not tracking them, you’re assuming.
Instrument them with basic stats:
class ToolOptimizer:    def __init__(self):        self.tool_stats = {}
    def track_tool_call(self, tool_name: str, duration: float, success: bool):        stats = self.tool_stats.setdefault(tool_name, {            "calls": 0,            "total_duration": 0,            "failures": 0        })        stats["calls"] += 1        stats["total_duration"] += duration        if not success:            stats["failures"] += 1
    def get_tool_recommendations(self):        recommendations = []        for tool, stats in self.tool_stats.items():            avg_duration = stats["total_duration"] / stats["calls"]            failure_rate = stats["failures"] / stats["calls"]            if avg_duration > 5.0:                recommendations.append(f"{tool}: consider caching results or limiting input size")            if failure_rate > 0.1:                recommendations.append(f"{tool}: add retry logic or fallback")        return recommendations
Once you have these numbers, look for:
- Tools with >5s average duration
- Tools with >10% failure rate
- Tools called redundantly in a single trace
Batching also helps. For example:
import asyncio
async def batch_tool_calls(tool_calls: List[Dict]):    tasks = [        asyncio.create_task(execute_tool_call(call["tool"], call["input"]))        for call in tool_calls    ]    return await asyncio.gather(*tasks, return_exceptions=True)
Run independent tool calls in parallel instead of sequentially. This alone can reduce latency by 30–50%.
Trim Context with Token-Aware Pruning
Token bloat is often invisible until you look at trace metadata. Sending long conversation histories or entire documents to the model increases cost and slows down response time.
Use a pruning utility to control this:
import tiktokenfrom typing import List, Dict
class ContextPruner:    def __init__(self, model_name="gpt-3.5-turbo"):        self.encoding = tiktoken.encoding_for_model(model_name)
    def count_tokens(self, text: str) -> int:        return len(self.encoding.encode(text))
    def prune_conversation(self, messages: List[Dict], max_tokens: int = 3000):        if not messages or messages[0]["role"] != "system":            return messages
        system_msg = messages[0]        conversation = messages[1:]        system_tokens = self.count_tokens(system_msg["content"])        available_tokens = max_tokens - system_tokens
        pruned_conversation = []        current_tokens = 0
        for msg in reversed(conversation):            msg_tokens = self.count_tokens(msg["content"])            if current_tokens + msg_tokens <= available_tokens:                pruned_conversation.insert(0, msg)                current_tokens += msg_tokens            else:                break
        return [system_msg] + pruned_conversation
This ensures:
- System prompts are always preserved
- The most recent messages are kept
- You don’t exceed token limits for your chosen model
For more targeted compression, extract key entities to build a condensed summary:
import re
def extract_key_entities(text: str, max_entities: int = 10):    entities = re.findall(r'\b[A-Z][a-z]+\b|\b\d+\b|\b\d{4}-\d{2}-\d{2}\b', text)    return list(set(entities))[:max_entities]
Use this when the prompt format allows a compressed version of the input (e.g., summaries, instructions, short Q&A).
Control Memory in Long-Running Chains
LangChain agents that run for hours (or days) tend to leak memory if you’re holding onto full histories, large inputs, or chain outputs.
Add a memory guardrail like this:
import psutil
class MemoryManager:    def __init__(self, max_memory_mb=1000):        self.max_memory_mb = max_memory_mb        self.conversation_summaries = {}
    def check_memory_usage(self):        process = psutil.Process()        return process.memory_info().rss / 1024 / 1024
    def should_compress_memory(self, session_id: str) -> bool:        return (            self.check_memory_usage() > self.max_memory_mb * 0.8 or            len(self.conversation_summaries.get(session_id, [])) > 20        )
    def compress_conversation(self, session_id: str, messages: List[Dict]):        if len(messages) <= 5:            return messages
        system_msg = messages[0] if messages[0]["role"] == "system" else None        recent_messages = messages[-3:]        middle_messages = messages[1:-3] if system_msg else messages[:-3]
        if middle_messages:            summary = self.create_summary(middle_messages)            summary_msg = {                "role": "system",                "content": f"Previous conversation summary: {summary}"            }
            result = [summary_msg] + recent_messages            if system_msg:                result = [system_msg] + result            return result
        return messages
    def create_summary(self, messages: List[Dict]) -> str:        text = " ".join([msg["content"] for msg in messages])        sentences = text.split(".")        important = [s for s in sentences if any(            word in s.lower() for word in ["important", "key", "main", "critical"]        )]        return ". ".join(important[:3]) + "."
Use this to:
- Detect memory growth before it leads to OOM errors
- Compress conversation history when thresholds are crossed
- Preserve key context while offloading bulk data
You can run this per session, on a background thread, or tied to a batch window (e.g., every N interactions).
LangChain and LangGraph structure your agent workflows, but how that impacts trace visibility is often overlooked. Here’s a breakdown of how these frameworks behave in production and what your traces actually reveal.
Set Up Performance Alerts and SLOs for LangChain Apps
Once your LangChain app hits production, debugging logs and manual checks aren’t enough. You need a system that tracks key performance metrics, alerts you when things drift, and keeps costs predictable.
Here’s how to set that up in three simple steps:
Define SLIs That Reflect User Experience
SLIs (Service Level Indicators) are the signals that matter to your users, things like response time, success rate, and cost per request. Once you define them, you can wrap them into SLOs (objectives) and plug them into dashboards and alerts.
Start with these:
# Response time SLI: 95% of requests under 2sRESPONSE_TIME_SLI = {    "metric": "langchain_request_duration_seconds",    "threshold": 2.0,    "percentile": 95}
# Token usage SLI: average stays under 500TOKEN_EFFICIENCY_SLI = {    "metric": "langchain_tokens_per_request",    "threshold": 500,    "aggregation": "mean"}
# Cost per request SLI: keep it below $0.10COST_SLI = {    "metric": "langchain_cost_usd",    "threshold": 0.10,    "aggregation": "mean"}
# Tool success rate: should stay above 99%TOOL_SUCCESS_SLI = {    "metric": "langchain_tool_success_rate",    "threshold": 0.99,    "aggregation": "mean"}
Start with loose thresholds (e.g., 95th percentile latency under 5s), and tighten them once you understand real usage patterns and user expectations.
You can track these in your observability backend, such as Prometheus or Last9, and set SLOs based on them.
Monitor SLIs with Lightweight Alerts
Dashboards show you when things are off. But alerts tell you before users notice. Here’s a lightweight in-app monitor to flag performance regressions based on recent usage:
import timefrom typing import Dict, List
class PerformanceMonitor:    def __init__(self, alert_thresholds: Dict):        self.thresholds = alert_thresholds        self.alert_history = {}
    def check_response_time(self, request_times: List[float]):        p95 = sorted(request_times)[int(len(request_times) * 0.95)]        if p95 > self.thresholds["response_time"]:            self.send_alert("high_latency", {                "current_p95": p95,                "threshold": self.thresholds["response_time"],                "sample_size": len(request_times)            })
    def check_token_usage(self, token_counts: List[int]):        if len(token_counts) < 2:            return        recent_avg = sum(token_counts[-10:]) / min(len(token_counts), 10)        baseline_avg = sum(token_counts) / len(token_counts)        if recent_avg > baseline_avg * 1.5:            self.send_alert("token_spike", {                "recent_average": recent_avg,                "baseline_average": baseline_avg,                "increase_percentage": (recent_avg - baseline_avg) / baseline_avg * 100            })
    def check_cost_trends(self, costs: List[float]):        if len(costs) < 48:            return        recent = sum(costs[-24:])        previous = sum(costs[-48:-24])        if recent > previous * 1.3:            self.send_alert("cost_increase", {                "recent_cost": recent,                "previous_cost": previous,                "increase_percentage": (recent - previous) / previous * 100            })
    def send_alert(self, alert_type: str, data: Dict):        last_alert = self.alert_history.get(alert_type, 0)        if time.time() - last_alert < 300:            return  # avoid alert spam        self.alert_history[alert_type] = time.time()        print(f"ALERT: {alert_type} - {data}")
Plug this into your app’s monitoring loop or backend jobs. It lets you:
- Flag high response times (e.g., 95th percentile > 2s)
- Catch sudden token usage spikes
- Detect cost jumps across hours
- Avoid alert spam with basic rate-limiting
You can also forward these alerts to Slack, PagerDuty, or your existing alert pipeline using webhooks or integrations.
Track Costs and Enforce Budget Controls
LLM usage adds up fast, especially when you’re calling GPT-4 on every request or handling hundreds of users per hour. A single GPT-4 call can cost over $0.12. If a loop goes rogue, you could blow through your entire monthly budget in an afternoon.
That’s why it’s worth enforcing guardrails, both globally and per user, to keep costs under control.
Add a Simple Cost Controller
This cost controller tracks spend, triggers alerts, and blocks requests that go over budget:
class CostController:    def __init__(self, daily_budget: float = 100.0):        self.daily_budget = daily_budget        self.current_spend = 0.0        self.spend_by_user = {}
    def track_request_cost(self, user_id: str, tokens: int, model: str):        cost = self.calculate_cost(tokens, model)        self.current_spend += cost        self.spend_by_user[user_id] = self.spend_by_user.get(user_id, 0) + cost
        if self.current_spend > self.daily_budget:            self.trigger_budget_alert()
        if self.spend_by_user[user_id] > 10.0:  # Daily user cap            self.trigger_user_limit_alert(user_id)
    def calculate_cost(self, tokens: int, model: str) -> float:        rates = {            "gpt-4": 0.06,  # per 1K tokens            "gpt-3.5-turbo": 0.002,            "claude-3-sonnet": 0.015        }        rate = rates.get(model, 0.02)  # Default fallback rate        return (tokens / 1000) * rate
    def should_allow_request(self, user_id: str, estimated_tokens: int, model: str) -> bool:        estimated_cost = self.calculate_cost(estimated_tokens, model)        if self.current_spend + estimated_cost > self.daily_budget:            return False        if self.spend_by_user.get(user_id, 0) + estimated_cost > 10.0:            return False        return True
This setup gives you:
- Total spend tracking across all users
- Per-user caps, useful for free-tier limits or internal environments
- Blocking logic that you can plug into request validation or pre-flight checks
- Model-specific pricing, so you don’t treat GPT-4 the same as GPT-3.5
Tailor It for Your Use Case
You don’t have to stop at flat limits. Some ideas to extend this:
- Let budgets vary by environment (e.g., dev vs prod)
- Add tiered pricing or quotas per user group
- Track cost per session or tenant in multi-tenant setups
- Trigger alerts before denying requests, so you can notify users gracefully
For production setups, you might want to persist spend data in a database or cache and run cleanup jobs to reset limits daily.

Monitor LangChain performance with Last9
Last9 provides native support for OpenTelemetry and Prometheus, so you can monitor LangChain workflows without writing custom glue code. Just export your traces and metrics, Last9 handles the rest.
You’ll get visibility into:
- LLM latency and tool execution time
- Token usage and cost per request
- Memory growth across chains and agents
- SLOs, alerts, and performance trends over time
Getting started just takes a few minutes:
- Use your existing OpenTelemetry or Prometheus setup — no changes required
- No proprietary SDKs or vendor lock-in
- Visualize traces, metrics, logs, and costs in one place
- Works out of the box with 100+ integrations, AWS, Python, Cloudflare, JavaScript, and more

