

Are your Java applications running at their optimal performance, or is there room for improvement to make them faster and more efficient? With so many services depending on Java, keeping applications responsive and reliable is a core part of modern software engineering.
This blog walks you through the leading Java Application Performance Monitoring (APM) tools, with a clear comparison to help you choose the right option for your needs.
Why Java Needs APM
If you’re running Java in production, chances are it’s powering something big - an enterprise system, a service-heavy architecture, or a high-traffic app. With so many threads, JVMs, and dependencies in play, performance issues can sneak in fast. An APM tool gives you the visibility to see how everything connects, from memory usage to service calls, so you’re not guessing when something slows down.
The Cost of Slowness
Performance problems hit your business, too:
- Revenue loss: A few seconds of delay in a checkout flow or payment gateway can mean abandoned carts and lost sales.
- User churn: People expect apps to be quick and reliable. If yours isn’t, they’ll move to a competitor.
- Wasted time: Without APM, your team spends hours digging through logs to figure out what went wrong instead of building new features.
- Trust erosion: If your app keeps breaking, users lose confidence, and it gets harder to win them back.
You feel the impact everywhere - in revenue, in team productivity, and in how customers see your brand.
Reactive vs. Proactive Monitoring
How you monitor makes all the difference.
- Reactive monitoring means waiting for something to break and then rushing to fix it. That usually means long nights, emergency patches, and downtime you could have avoided.
- Proactive monitoring means spotting issues early. APM tools let you watch JVM health, trace slow queries, and detect anomalies before your users even notice.
With proactive monitoring, you can:
- Catch unusual behavior before it turns into outages.
- Get to root causes fast and cut down MTTR.
- Use infrastructure more efficiently, instead of over-provisioning.
- Keep performance steady so your users stay happy.
Tracking the right performance indicators is just as important as picking the right tool - here are the key APM metrics you must track.
What Should You Look For in a Java APM Tool?
The right Java APM tool depends on how your applications are built and how your team works. What matters most is matching features to your actual needs.
Core Features to Expect
A good Java APM tool should give you clear visibility into how your apps behave in production. Look for tools that cover these essentials:
- Distributed tracing: Follow a request across services, APIs, and databases. This makes it easier to see where bottlenecks form in microservices and distributed setups.
- Code-level diagnostics: Drill down to the method or line of code causing a slowdown. Useful extras here are CPU profiling and memory usage analysis.
- JVM monitoring: Keep an eye on garbage collection, heap usage, thread contention, and class loading - the metrics that make or break Java stability.
- Database query monitoring: Spot slow queries, measure execution time, and understand their resource impact.
- Error tracking and alerts: Get notified when exceptions occur, with stack traces and flexible alerting so your team isn’t caught off guard.
- Real User Monitoring (RUM): Capture what users actually experience - load times, frontend errors, and performance across geographies.
- Synthetic monitoring: Simulate user traffic from different regions to test availability, even when live traffic is low.
- Infrastructure correlation: Tie application performance to CPU, memory, network, and disk metrics so you can trace issues through the full stack.
- Custom metrics and dashboards: Define your own metrics and build dashboards tuned for developers, SREs, or product teams.
- Scalability and efficiency: The tool should handle growth in services and traffic without adding heavy overhead.
Match the Tool to Your Context
Not every team has the same needs. Before choosing, think about:
- Application architecture: Are you running a monolith, microservices, or serverless workloads? Some tools are better suited for distributed systems, others for JVM-heavy apps.
- Team expertise: Do you have the skills to run and maintain open-source APM, or do you want a managed commercial solution?
- Budget: Open-source options are free but come with operational effort. Commercial tools cost more but offload management.
- Integration ecosystem: Make sure the tool works smoothly with your CI/CD pipelines, logging stack, alert systems, and cloud provider.
- Compliance and security: If you’re in a regulated space, check for certifications and strong data-handling policies.
- Vendor support: In commercial tools, the quality of support during an incident can matter as much as the product itself.
Top 11 Java APM Tools: A Detailed Comparison
Navigating the landscape of Java APM tools can be challenging due to the sheer volume of options. This section provides a detailed comparison of leading tools, highlighting their core strengths and characteristics.
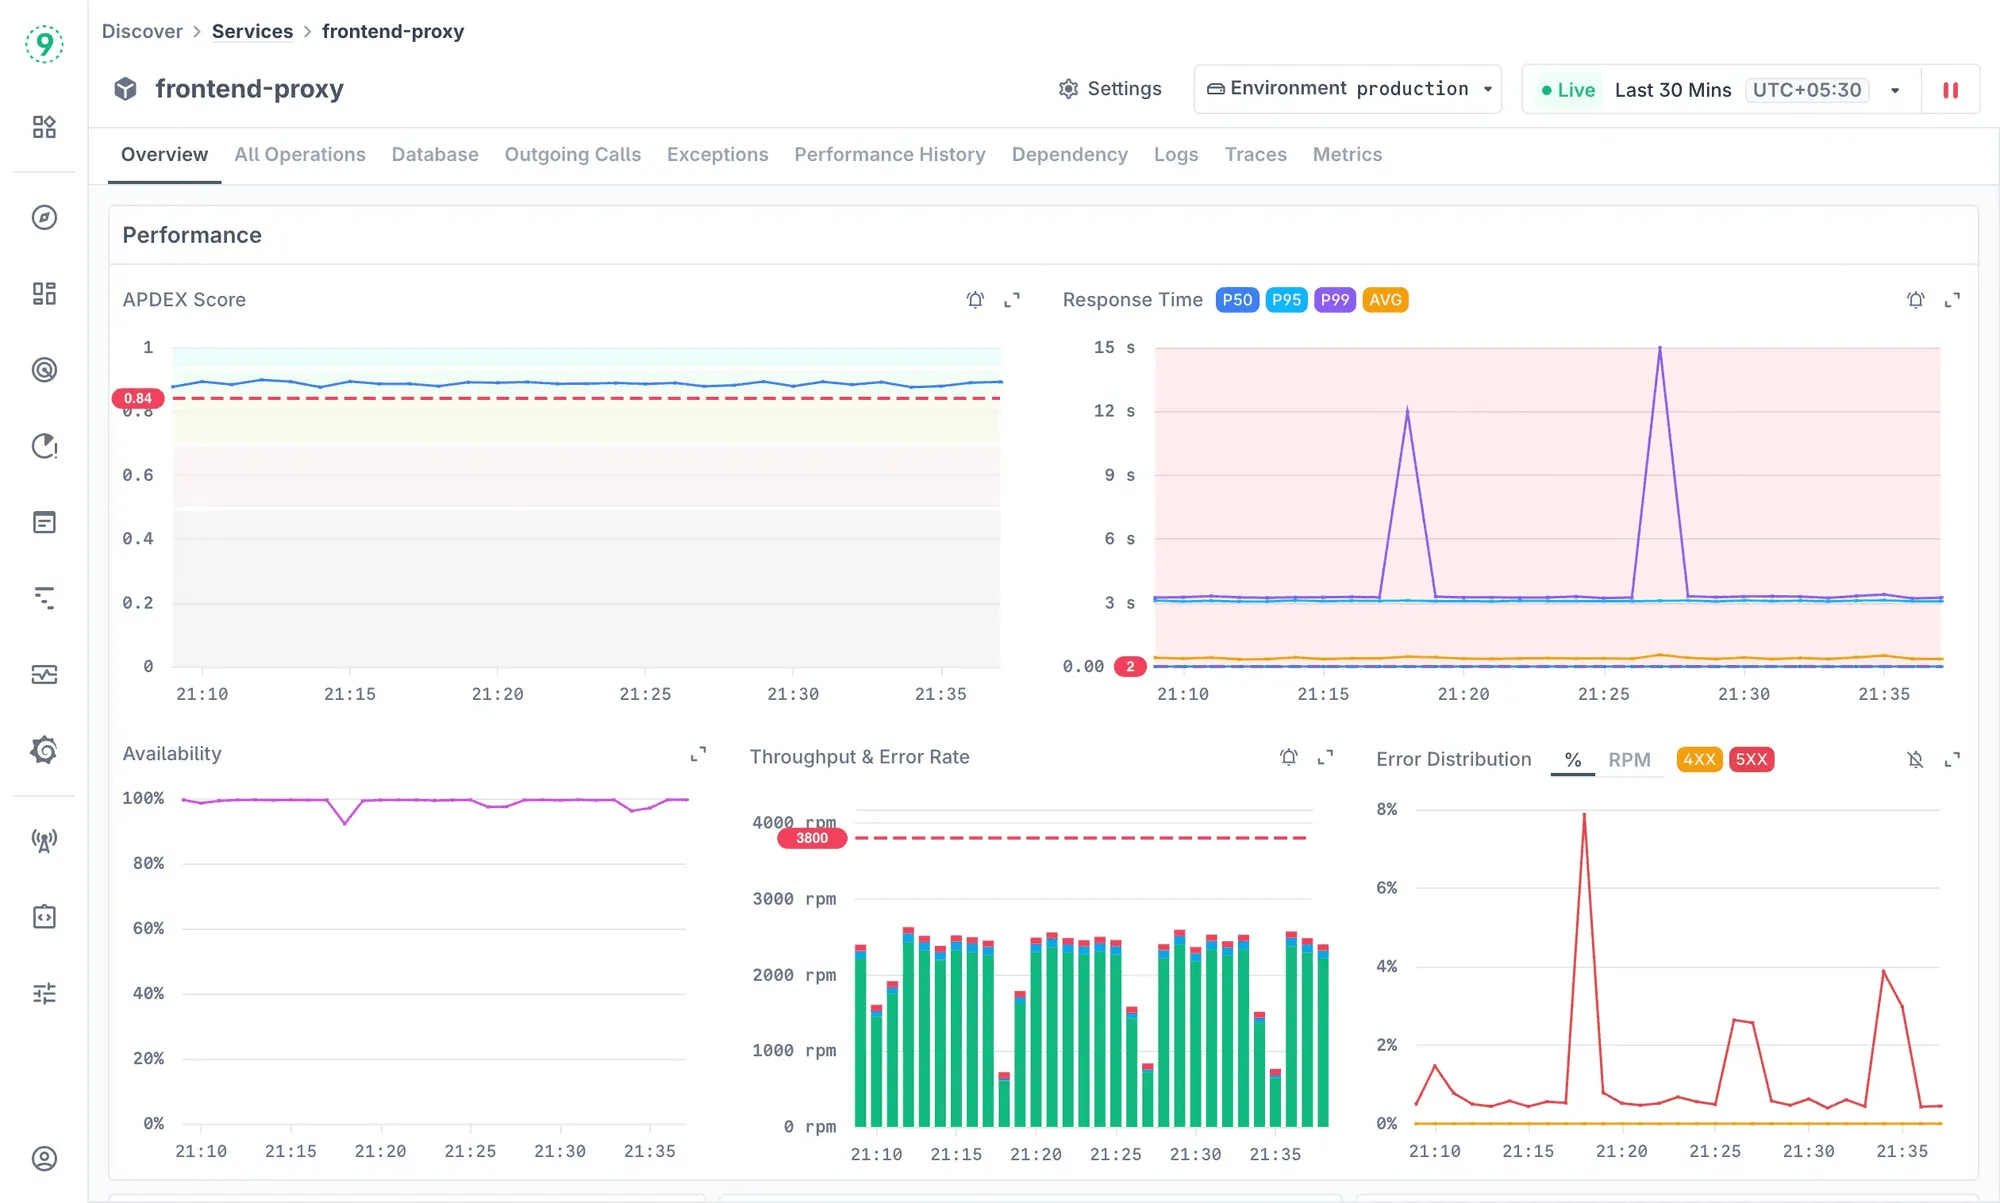
1. Last9
At Last9, we take an OpenTelemetry-first approach to APM, built for the scale and complexity that Java applications bring.
With Discover Services, you don’t just get metrics in isolation - you get a connected view of service health, dependencies, and performance trends. Metrics, logs, and traces live together in one place, so you can quickly move from a high-level view to the exact operation or query that’s slowing things down.
What you get with Last9:
- End-to-end visibility: From HTTP endpoints to database calls, you see how every request flows across your Java services.
- Deep JVM insights: Garbage collection, heap usage, thread contention, and class loading captured alongside infrastructure metrics.
- High-cardinality support: Keep every label -
thread_id,service_instance,region- without trimming data or worrying about cost blowups. - Reliability built ina : Track SLOs, SLIs, and error budgets natively, so reliability becomes part of your workflow, not an afterthought.
- Dependency maps that matter: See how failures in one service ripple across queues, APIs, and databases, so you can understand impact instantly.
Why it fits Java teams: If you’re scaling microservices, hitting Prometheus’s cardinality limits, or tired of unpredictable costs from legacy APM vendors, Last9 gives you full-fidelity visibility without trade-offs. With proper instrumentation, you’ll have a monitoring setup that scales as confidently as your applications.
Start with the free tier to explore Last9, then scale into the Pro plan for production workloads, or choose an Enterprise plan tailored to your needs.
2. Elastic APM
If you’re already running the Elastic Stack, Elastic APM fits right in. It lets you send traces and application metrics into Elasticsearch and explore them in Kibana, right alongside your logs and infrastructure metrics. For Java teams used to ELK, this makes performance data feel like a natural extension of what you already have.
What you get:
- Native Elasticsearch integration: All APM data is stored in Elasticsearch, which means you can query, filter, and analyze performance issues with the same tools you already use for logs and metrics.
- Customizable Kibana dashboards: You’re not locked into canned views. You can build dashboards tailored to your services, whether that’s JVM performance, slow queries, or latency across APIs.
- Open-source agents for Java: Elastic provides language-specific agents, including one for Java, so you can instrument applications without building custom collectors from scratch.
- Distributed tracing support: You can follow a request end-to-end across microservices, databases, and external APIs, which makes it easier to spot bottlenecks in complex Java architectures.
- Unified observability: Logs, metrics, and traces all live in the same platform, so you don’t need to stitch together data from multiple tools to understand what went wrong.
When it makes sense for you: Elastic APM is a strong option if you’re already invested in ELK and want to keep your observability data under your control. Just know that running and scaling Elasticsearch at high volume can be heavy on operations - worth it if you want flexibility, but something to plan for.
Elastic APM is free and open-source, with paid Elastic Cloud plans starting at around $95/month for managed deployments.
If you want to monitor tasks that run in the background (outside HTTP requests), here’s a helpful resource: What Is Asynchronous Job Monitoring?
3. AppDynamics (Cisco AppDynamics)
AppDynamics is one of the big names in enterprise APM. If you’re working in a large organization with complex Java applications, it gives you deep visibility into both technical performance and business impact. Instead of just telling you that a transaction is slow, it shows you which business process is affected - like checkout, payments, or onboarding - so you can prioritize fixes that matter most.
What you get:
- Automatic code-level diagnostics: AppDynamics instruments your Java code to pinpoint the exact methods or classes that slow down transactions.
- Business transaction mapping: Requests are grouped into business flows (like “Place Order” or “Add to Cart”), helping you see how technical issues affect customer journeys.
- Application topology discovery: Your entire application landscape - services, databases, queues - is auto-mapped so you understand dependencies at a glance.
- AI/ML-powered anomaly detection: AppDynamics learns normal performance baselines and flags unusual behavior early.
- Real User Monitoring (RUM): See how your applications actually perform in users’ browsers and devices, not just in the backend.
When it makes sense for you: AppDynamics is a strong choice if you’re running mission-critical Java applications in an enterprise setting and need both technical and business visibility. It’s a robust, full-featured platform, but it comes with a significant cost and operational overhead - best suited when you can invest in enterprise-grade monitoring and support.
It’s powerful but also one of the pricier options, starting at around $30–$50 per CPU core/month for full APM features.
4. Stagemonitor
Stagemonitor is a lightweight, open-source APM tool built specifically for Java web applications. If you want something simple to set up that still gives you visibility into performance metrics, it’s a practical choice. You can run it locally, plug it into Elasticsearch and Grafana, and get real-time insights without the heavy overhead of enterprise platforms.
What you get:
- In-browser performance reporting: While developing, you can view response times, database queries, and error rates directly in the browser, which helps you validate performance changes before they hit production.
- ElasticSearch + Grafana integration: Out of the box, Stagemonitor can feed data into Elasticsearch and Grafana, giving you customizable dashboards and the ability to search historical performance data with the same tools many teams already use.
- Simple setup: Adding Stagemonitor as a Java agent is straightforward, and it doesn’t require a heavy collector or complex orchestration. This makes it friendly for smaller teams without a dedicated observability engineer.
- Essential Java metrics: Stagemonitor tracks response times, throughput, error counts, and slow database queries, giving you immediate visibility into how your web application behaves under load.
- Plugin-based extensions: While lightweight, the platform allows additional monitoring features through plugins, so you can expand capabilities if your needs grow.
When it makes sense for you: Stagemonitor is best if you’re a developer or part of a smaller team that wants an open-source APM option without extra cost or operational load. It’s not as feature-rich as enterprise tools, but it gives you the essentials - and being open source, it’s free to use.
To understand how requests are tracked across services at the code level, check out our blog on APM tracing.
5. Instana (IBM Instana)
Instana is built for fast-changing, cloud-native environments where containers and microservices are constantly spinning up and down. Instead of manual setup, Instana relies on smart agents that automatically discover your services, map dependencies, and start collecting metrics with almost no configuration. For Java workloads, it captures everything from JVM health to transaction traces, making it easier to keep up with the pace of modern deployments.
What you get:
- Automatic service discovery: As soon as a new container, service, or instance comes online, Instana detects it and adds it to your application map without manual work.
- 1-second granularity monitoring: Metrics and traces are collected continuously, giving you near real-time insight into performance changes.
- AI-driven root cause analysis: Instana applies pattern detection to highlight the most likely source of an issue, so you spend less time chasing noise.
- Broad technology coverage: Supports a wide range of runtimes, frameworks, and platforms - including strong coverage for Java applications and JVM metrics.
- Dependency mapping: Visualizes how your microservices, databases, and external APIs connect, helping you understand the blast radius of failures.
When it makes sense for you: If you’re running highly dynamic, cloud-native Java applications - Kubernetes, containers, or serverless - Instana saves you the manual setup that comes with traditional APM tools. It’s a commercial solution with pricing based on hosts and usage, so it fits best if you want automation and real-time insight more than fine-grained control over cost.
6. Prometheus (with Grafana)
Prometheus has become the default choice for open-source monitoring. It’s not a traditional APM in the enterprise sense, but if you’re running Java applications and want full control over your telemetry, it gives you the building blocks. With PromQL for querying and Grafana for dashboards, you can create a monitoring setup that’s flexible, scalable, and entirely under your control.
What you get:
- Powerful time-series database: Prometheus stores metrics in a time-series model that makes it easy to query performance over time.
- PromQL query language: A flexible query engine that lets you slice and analyze your metrics however you need.
- Java client libraries: Straightforward instrumentation for Java apps, so you can export JVM metrics like heap usage, garbage collection, and thread counts.
- Alertmanager integration: Set up alerts on any metric you collect, with routing and silencing features built in.
- Grafana visualizations: Pairing with Grafana gives you customizable dashboards to visualize performance trends, latency, and resource usage.
- Large community: A broad ecosystem of exporters and integrations, with community support for almost any technology you need to monitor.
When it makes sense for you: Prometheus is best if you’re comfortable running and maintaining your own monitoring infrastructure. It shines when you want customization and control, or if you’re already invested in open-source tools. For Java teams, it’s great for JVM and service-level metrics, though you’ll likely need to add tracing (e.g., Jaeger) for full APM-style coverage.
If you’re running Java apps on container platforms, you’ll find this post on APM for Kubernetes especially relevant to distributed environments.
7. Glowroot
Glowroot is a lightweight, open-source APM tool purpose-built for Java. It’s quick to set up, runs with very little overhead, and gives you the kind of code-level diagnostics that can help you pinpoint bottlenecks without needing a large monitoring stack. Because it’s focused entirely on Java, it feels simpler than multipurpose APMs while still giving you useful depth.
What you get:
- Detailed transaction traces: Every request is tracked, showing you where time is spent inside methods and external calls.
- SQL capture: Slow queries are flagged with execution times, so you can identify database hotspots quickly.
- Error capture: Exceptions are recorded with full context, helping you debug application failures faster.
- Low overhead: Designed to run inside the JVM without consuming much memory or CPU.
- Web-based UI: A clean, built-in interface to explore traces, errors, and performance metrics without requiring Grafana or Kibana.
When it makes sense for you: Glowroot is a solid choice if you want a no-cost, Java-focused APM tool that just works. It’s especially useful for small and mid-sized teams that need transaction traces, slow method detection, and database visibility without the complexity of managing a larger observability stack.
8. Scout APM
Scout APM is built with developers in mind. Instead of overwhelming you with metrics, it highlights the performance issues you care about most - slow database queries, N+1 calls, and background jobs. Setup is straightforward, and the UI is designed to give you clear answers rather than endless graphs. For Java teams, it’s a practical way to get value quickly without heavy configuration.
What you get:
- Automatic N+1 query detection: Flags inefficient query patterns before they balloon into major performance problems.
- Slow query visibility: Surfaces database queries that are dragging down response times, along with execution details.
- Background job monitoring: Tracks job execution and helps identify bottlenecks outside the request/response cycle.
- Clean, developer-friendly UI: Shows actionable insights rather than raw data, so you can focus on fixing issues fast.
- Low configuration overhead: Designed to start delivering insights with minimal setup.
When it makes sense for you: Scout APM works well if your team wants a simple, developer-centric tool for spotting the most common performance bottlenecks in Java applications. It’s not as broad as enterprise-grade APMs, but it gives you quick wins and immediate visibility where it matters most. Pricing begins at $19/month for the Startup plan, with higher tiers available as your usage grows.
For a broader view of tools beyond Java, see our guide on application performance monitoring tools.
9. AWS X-Ray
If you’re running Java applications on AWS, X-Ray is the native choice for distributed tracing. It’s tightly integrated with the AWS ecosystem, so you can see how requests move through services like EC2, Lambda, S3, and RDS without bolting on an external APM. X-Ray builds a service map automatically and highlights bottlenecks across your stack, which is especially useful in microservices and serverless setups.
What you get:
- AWS-native integration: Works out of the box with AWS services, IAM, and CloudWatch, making setup seamless if you’re already on AWS.
- End-to-end request tracing: Follow requests as they flow through Java applications, databases, queues, and downstream AWS services.
- Service maps: Auto-generated diagrams of how your services talk to each other, helping you understand dependencies and latency hotspots.
- Error and fault analysis: Captures exceptions, timeouts, and throttling errors with context for faster debugging.
- Scalability: Designed to handle high-volume distributed applications without major configuration overhead.
When it makes sense for you: X-Ray is ideal if your applications are built primarily on AWS and you want visibility without leaving the ecosystem. It’s not as feature-rich outside of AWS, so if you run a hybrid stack, you may need complementary tools. Pricing is pay-as-you-go, starting at $5 per million traces recorded plus analysis charges.
10. Google Cloud Trace
Google Cloud Trace is Google’s native distributed tracing tool, built into the Cloud Operations suite. If you’re running Java applications on GCP, Trace gives you latency data across services and visualizes how requests move through your system. You can profile application performance, spot bottlenecks, and debug slow endpoints directly from the Google Cloud Console without adding another vendor to your stack.
What you get:
- Native GCP integration: Works seamlessly with services like App Engine, GKE, Cloud Functions, and Cloud Run.
- End-to-end distributed tracing: Follow requests across microservices, databases, and APIs running inside Google Cloud.
- Detailed latency analysis: Breaks down where time is spent in each request to pinpoint bottlenecks.
- Automatic instrumentation: Built-in support for many Google Cloud services, with Java client libraries for custom instrumentation.
- Cloud Console views: Traces and latency breakdowns are visualized directly in the same console you use for logs and metrics.
When it makes sense for you: Cloud Trace is a natural fit if your Java applications run primarily on Google Cloud and you want tracing tightly integrated into the rest of your observability stack. It’s less compelling for hybrid or multi-cloud environments. Pricing is usage-based, starting at $0.20 per million spans ingested.
For faster troubleshooting, pair your traces with logs - see our write-up on APM logs for faster debugging.
11. Zabbix (with APM extensions)
Zabbix is best known as an open-source infrastructure monitoring platform, but with the right setup, you can extend it to collect Java application metrics too. By using JMX integrations, custom scripts, or templates, you can monitor JVM health and basic application performance alongside servers, networks, and databases. It’s not a purpose-built APM, but if you’re already running Zabbix for infra monitoring, it can act as a single pane of glass.
What you get:
- Unified monitoring: Combine infrastructure, network, virtualization, and Java application metrics in one place.
- JVM monitoring via JMX: Track garbage collection, heap usage, thread states, and other Java-specific metrics.
- Robust alerting system: Advanced rules, escalations, and integrations with popular incident tools.
- Customizability: Flexible templates and scripts let you extend monitoring to fit your exact needs.
- Community support: A large ecosystem of plugins, templates, and community-driven best practices.
When it makes sense for you: Zabbix works well if you’re already invested in it for infrastructure monitoring and want to extend coverage to your Java applications without adding another tool. Just note that setting up APM-like functionality requires more manual configuration, and it won’t give you deep tracing out of the box. As an open-source tool, Zabbix is free, though you’ll need in-house expertise to get full value from it.
Choose the Right Java APM Tool for Your Organization
The right Java APM tool is the one that fits your runtime, data model, and growth path. Picking well means looking past surface features and checking how the tool behaves under your actual workload.
Technical Factors to Weigh
- Scalability under JVM load: Can the tool handle millions of time series from GC events, thread states, and heap usage without falling over? Some agents add measurable overhead - test with a realistic load.
- Instrumentation depth: Does it support bytecode instrumentation for frameworks like Spring Boot, or will you need manual spans? Can it capture JDBC calls, async tasks, and background jobs?
- Tracing fidelity: Will attributes like
thread_idorservice_instancesurvive, or does the tool force you to drop dimensions to control cost or performance? - Data pipeline fit: Does it plug into OpenTelemetry, or does it lock you into a proprietary format? That choice decides how portable your telemetry is.
- Query performance: Storing JVM and application metrics is one thing; querying them at scale is another. Can you run ad-hoc queries on high-cardinality labels without timeouts?
- Ops overhead: For self-hosted options (Prometheus, Elastic), factor in retention, federation, and cluster scaling. For SaaS, understand ingest limits and sampling defaults.
- Integration points: How well does it tie into your CI/CD pipeline, log stack, or alerting system? Missing integrations add friction.
How to Make the Right Choice
- Define what matters in your stack: JVM metrics, distributed traces across microservices, business-level SLIs - be clear on what’s non-negotiable for your team.
- Run pilots with load: Go beyond dev testing. Try candidates in staging with a realistic JVM load and multiple services to see how they hold up.
- Measure overhead: Track CPU, memory, and latency with and without the agent. This helps you understand the runtime cost of monitoring.
- Test root-cause workflows: Check if the tool lets you move from a broad signal (e.g., p95 latency spike) to the specific method or query causing the slowdown.
- Balance cost and fidelity: Some platforms limit high-cardinality attributes to control cost. Others keep full-fidelity data. Choose what aligns with how your team debugs.

Next Steps
The right choice depends on how your applications are built, the kind of data you need to keep, and how quickly your team can act on it. Whether you lean toward open-source flexibility or full-featured commercial platforms, the goal is the same - shorten the path from “something’s slow” to “here’s why.”
With Last9’s Discover Services, the benefits go beyond raw data:
- Faster debugging: Move from latency spikes to the exact method, query, or service at fault in a few clicks.
- Confidence at scale: Keep every dimension of your JVM and application data without worrying about high-cardinality blowups.
- Fewer blind spots: Metrics, logs, traces, and reliability signals like SLOs and error budgets live together, so you always have context.
- Predictable cost: Event-based pricing means you can instrument everything without second-guessing which metrics to drop.
If your Java stack is growing and you want observability that scales with it, Discover Services is built to give you that edge.
FAQs
Q: What can you do to improve Java application performance?
You can improve performance by monitoring JVM metrics (GC activity, heap usage, thread contention), profiling code to find hotspots, optimizing database queries, and using caching where appropriate. Proactive monitoring with an APM tool helps you spot issues early and validate improvements in real workloads.
Q: What network monitoring tool do you use?
Network monitoring depends on your environment. Tools like Zabbix, Nagios, or Prometheus with exporters are common for infrastructure-level metrics, while APM platforms such as Last9 or Elastic APM can correlate network latency with application performance for a fuller picture.
Q: What is a CPU and memory usage monitor?
It’s a tool that tracks how much CPU and memory your applications and systems consume. In Java, this includes JVM-level metrics like heap usage, garbage collection frequency, and thread CPU time. Monitoring these helps detect leaks, bottlenecks, or inefficient resource usage.
Q: What is garbage collection in Java?
Garbage collection (GC) is the JVM process that automatically frees memory by reclaiming objects that are no longer referenced. Monitoring GC activity (frequency, pause times, memory reclaimed) is key for performance - excessive GC can lead to latency spikes and throughput issues.
Q: How do you find critical areas that are good targets for optimization?
APM tools and profilers help by tracing transactions end-to-end and surfacing where time is spent. Slow database queries, expensive loops in code, blocking I/O, and frequent GC pauses are typical hotspots. Focusing on these areas delivers the biggest performance gains.
Q: What is Java performance monitoring?
It’s the practice of continuously tracking JVM and application metrics (CPU, memory, GC, thread states), distributed traces, and error rates to understand how Java applications behave in production. The goal is to detect anomalies, reduce MTTR, and ensure consistent performance for users.
Q: What are the best tools for monitoring Java application performance?
The best tool depends on your needs:
- Last9 – OTel-native, high-cardinality support, built for scaling Java microservices.
- Elastic APM – Good fit if you already use the ELK stack.
- AppDynamics / Dynatrace – Enterprise-grade platforms with deep visibility.
- Prometheus + Grafana – Open-source option for teams that want customization and control.
- Glowroot / Stagemonitor – Lightweight, Java-focused, open-source tools.

