
Prometheus and Graphite are both powerful open-source tools used for monitoring and alerting purposes in system infrastructure. However, their key features, user experience, and mechanisms for data handling distinctly vary. This article aims to clarify the differences between the two and help users decide which one is best suited to their requirements.
What Are Graphite and Prometheus?
Graphite, on the other hand, was developed by Orbitz Worldwide, and it is now a fully open-source project. Unlike Prometheus, Graphite uses a push-based mechanism for gathering data, meaning the target system sends (or pushes) data to the Graphite server.
Prometheus is an open-source system monitoring and alerting toolkit initially built at SoundCloud. It is now a standalone open source project maintained independently of any company. Prometheus uses a pull-based mechanism for collecting metrics from monitored targets, meaning it fetches (or pulls) the metrics data from the target systems.
Now, let’s delve into their differences based on certain criteria.
Architecture
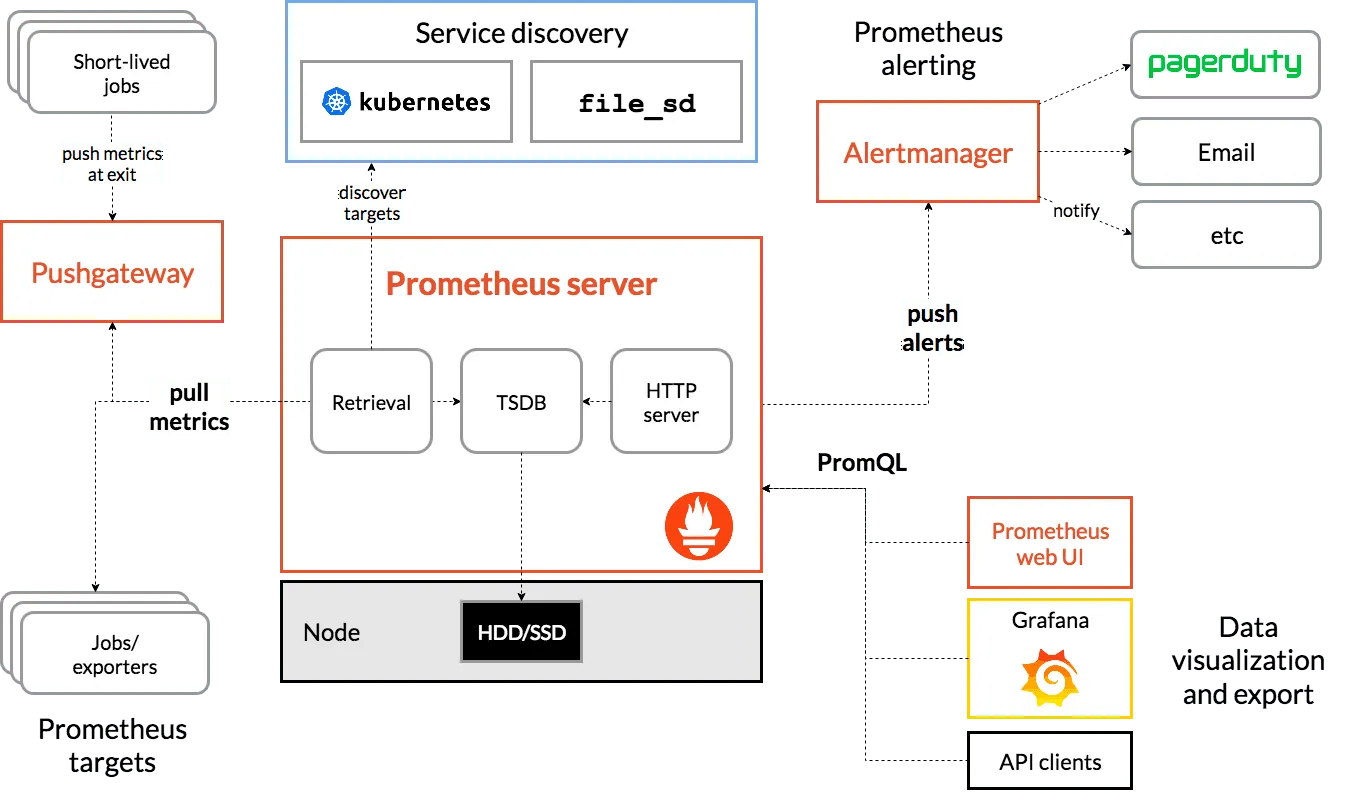
Prometheus is a single binary composed of several components such as retrieval, storage, etc., all combined into one. It employs a pull model for gathering metrics and provides a multi-dimensional data model. The Prometheus server is autonomous and does not depend on distributed storage.
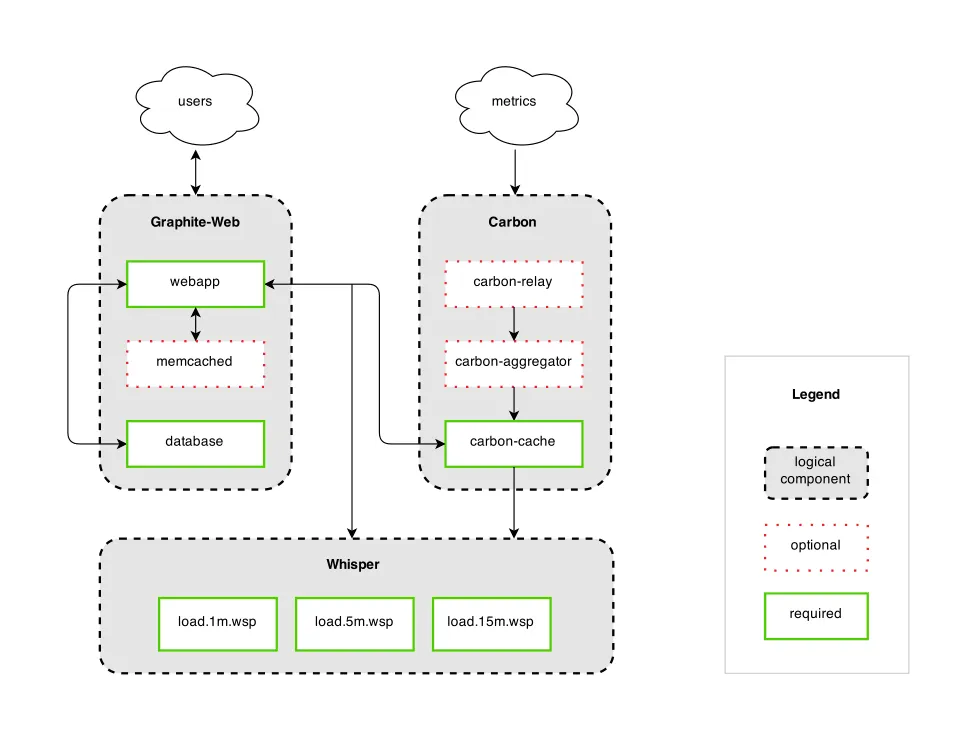
Graphite’s architecture is more complex and modular with separate components like Carbon, Whisper, and Graphite-Web. It follows a push model where applications send their metrics to Graphite. The Graphite ecosystem is built around storing numeric time-series data and rendering graphs of this data.
Data Model
Prometheus has a powerful and flexible data model. It stores time series data identified by metric name and key/value pairs. The data model supports the concept of labels which allow for flexible querying and visualization.
Graphite’s data model is more straightforward but less flexible. It stores data as a unique identifier, which is a dot-separated string that often represents a hierarchy of names. This model lacks the concept of labels and queries have to be done via this hierarchical structure, which can be limiting.
Query Language
Prometheus has its own query language, PromQL, which is highly expressive and allows for complex queries and computations. This powerful query language enables users to select and perform aggregations on time series data in real time.
Graphite uses functions and render API to query the time series data so you can pass the query parameters to this API to retrieve the data.
Storage
Prometheus’s local storage is intended for short-term storage and requires another solution, such as Last9, Thanos or Cortex, for long-term data retention.
On the other hand, Graphite uses Whisper as a storage system, a simple database library for storing time-series data, but it lacks advanced data management features.
Checkout Last9’s managed time series data warehouse which supports open standards, is built for high cardinality with automatic data tiering and data retention for up to a year without rollups. Book a demo to know more.
Graphite Dashboards
The basic Graphite package comes with a built-in simple dashboard tool called Graphite-Web. It allows users to quickly put together dashboards showcasing the metrics collected. However, many users opt to use Grafana, as it’s more powerful and versatile in terms of visualization options.
When using Graphite, it’s easy to create complex visualizations, and you can instantly adjust time intervals, stacking, and color schemes to better understand the data. Graphite also supports anomaly detection, meaning that it can automatically identify unexpected patterns in your time-series data.
Prometheus Dashboards
Creating dashboards using Prometheus is typically achieved using a visualization tool like Grafana. Prometheus itself doesn’t provide a built-in dashboarding feature. Grafana offers a wide range of visualization options, from simple line graphs to complex heatmaps, histograms, and more.
Prometheus dashboards are incredibly customizable. You can create charts, tables, or other visual representations of your Prometheus metrics. With Prometheus and Grafana, you can easily monitor many aspects of your system, such as CPU usage, memory usage, network traffic, and many more. Furthermore, with the alerting feature in Grafana, you can set up alerts based on your Prometheus metrics.
Graphite Client libraries
1. Python: graphite-client, graphite-py.
2. Java: graphite-java-client.
3. Node.js: graphite, graphite-udp.
4. Go: go-graphite-client.
5. Ruby: graphite-api.
6. Perl: Net::Graphite.
7. PHP: graphite-php.
8. .NET/C#: graphite-client-csharp.
Prometheus Client Libraries
The official Prometheus client libraries include:
1. Go: The official Go client library.
2. Java or Scala: The official Java client library.
3. Python: The official Python client library.
4. Ruby: The official Ruby client library.
5. Node.js: The official Node.js client library.
In addition to these official libraries, the Prometheus community has contributed a number of client libraries, including C##, Haskell and Rust.
Prometheus vs Graphite
Prometheus and Graphite are both open-source time series monitoring systems. They are both widely used in the industry, and each has its own strengths and weaknesses.
Data collection
Prometheus is a pull-based system, while Graphite is a push-based system. This means that Prometheus actively scrapes metrics from its targets, while Graphite waits for targets to send metrics to it.
Pull-based systems are typically more scalable than push-based systems, because they do not require the targets to be aware of Prometheus. However, pull-based systems can also be more complex to configure.
Data model
Prometheus uses a richer data model than Graphite. Prometheus metrics have labels, which are key-value pairs that can be used to filter, group, and match metrics. Graphite metrics do not have labels.
The richer data model in Prometheus makes it easier to filter and group metrics, and to calculate derived metrics. However, it also makes the Prometheus data model more complex.
Query language
Prometheus has a more expressive query language than Graphite. Prometheus’s query language can be used to filter, group, match, and calculate metrics. Graphite’s query language is more limited as it is used as query parameters passed to render API.
The more expressive query language in Prometheus makes it easier to write complex queries. However, it also makes the Prometheus query language more difficult to learn.
API Endpoints
Prometheus and Graphite, as monitoring systems, expose HTTP-based endpoints for different kinds of interactions.
Prometheus Endpoints
1. Metrics Endpoint: Each Prometheus client library provides a metrics endpoint (usually /metrics), which exposes a list of all the application’s metrics in a format Prometheus understands. This endpoint is what the Prometheus server scrapes at regular intervals to collect metrics data.
2. Prometheus API: The Prometheus server provides an HTTP API to interact with it. This API allows you to do things like query your data or metadata, retrieve data points, find series by label matchers, etc. The endpoint is usually something like http://<prometheus-server-url>:9090/api/v1/.... It supports JSON interface to read the data points with timestamp.
3. Alertmanager API: Prometheus’ Alertmanager also exposes an API which allows you to interact with alerts. You can use this API to get information about current alerts, silence alerts, etc.
Graphite Endpoints
1. Metrics Endpoint: Unlike Prometheus, Graphite doesn’t scrape metrics from your applications, it receives them. Therefore, it doesn’t have a metrics endpoint like Prometheus does. Instead, you send metrics to Graphite’s plaintext protocol port (usually port 2003) or pickle protocol port (usually port 2004).
2. Render API: Graphite provides a Render API that you can use to retrieve metrics stored in Graphite or to create and retrieve graph images. The endpoint for the Render API usually looks like http://<graphite-web-url>/render?....
3. Metrics API: The Metrics API is used to manage the metrics metadata, and its endpoint is typically http://<graphite-web-url>/metrics/....
Data Sources
Both Prometheus and Graphite are monitoring tools that collect metrics data from various sources.
Prometheus Data Sources
Prometheus collects metrics from monitored targets by scraping metrics HTTP endpoints on these targets. Here are some of the data sources:
1. Instrumented Applications: Applications can be instrumented with client libraries to expose an HTTP metrics endpoint that Prometheus can scrape.
2. Exporters: These are applications that help expose metrics from third-party systems as Prometheus metrics, such as the Node Exporter for machine metrics, and the MySQL exporter for MySQL server metrics.
3. Service Discovery or Static Config: Prometheus supports service discovery mechanisms which automatically discover scrape targets. Alternatively, scrape targets can also be statically configured.
4. Pushgateway: For short-lived jobs or batch jobs, metrics can be pushed to Prometheus’s Pushgateway, which Prometheus can scrape.
5. Other Observability Signals: With the help of external adapters, Prometheus can ingest other observability signals such as logs or traces, although this is less common.
Kubernetes-based
Graphite, on the other hand, primarily uses a push model where data is sent to it. Here are some of the data sources:
1. Instrumented Applications: Applications can be instrumented to send metrics to Graphite.
2. Collectors/Agents: Tools such as collectd, StatsD, or Diamond are often used to collect system metrics and send them to Graphite.
3. Graphite-API-compatible Tools: Some tools and services are compatible with the Graphite API, which means they can send metrics directly to Graphite.
4. Log Files: Metrics can be extracted from log files and sent to Graphite using a variety of methods.
Plugins and Exporters
While Graphite does not natively support plugins, it enjoys broad compatibility with a variety of tools that have been designed to work seamlessly with it.
On the other hand, Prometheus sustains a thriving ecosystem of exporters. These exporters allow third-party tools to feed their data into Prometheus effectively. A significant number of open-source software components come with built-in compatibility for Prometheus.
AWS Cloud Monitoring
Both Graphite and Prometheus can be used to monitor Amazon Web Services (AWS).
While Graphite does not natively support AWS monitoring, you can collect metrics from AWS services by using additional tools. For instance, you can use AWS CloudWatch along with a tool like cloudwatch2graphite, which fetches CloudWatch metrics and pushes them into Graphite. Alternatively, you can use the AWS SDK in your preferred programming language to build a custom solution that collects AWS metrics and pushes them to Graphite.
Prometheus supports AWS monitoring through its ecosystem of exporters, which are applications that help capture Prometheus metrics. For AWS, the CloudWatch exporter is commonly used. It makes requests to the AWS CloudWatch API and exposes the results for Prometheus to scrape. With the CloudWatch exporter, you can collect metrics from many AWS services such as EC2, S3, RDS, and more. Additionally, the AWS SDK can also be used to build custom exporters for services if necessary.
In both cases, please note that additional costs may be incurred for CloudWatch API requests and data transfer. You should also be mindful of API rate limits, which vary depending on the service and your AWS account type.
With Last9’s AWS Cloudwatch Metrics Stream integration, you don’t run into this problem as you can stream Cloudwatch metrics only once to Last9 and then query it from Last9 instead of Cloudwatch.
Integration with Kubernetes-based backends
Prometheus and Graphite can both be used for monitoring applications running in a Kubernetes environment, but they have different ways of integration.
Prometheus has native support for Kubernetes. It uses Kubernetes’ service discovery mechanisms to automatically find and scrape metrics from services and pods.
Prometheus provides a Kubernetes operator which simplifies the deployment of Prometheus instances in a Kubernetes cluster. It manages Prometheus instances and can create, configure, and manage Prometheus clusters atop Kubernetes.
Additionally, you can use Prometheus for collecting Kubernetes control plane metrics. The kube-state-metrics component provides object metrics about the state of Kubernetes resources like Deployments, Pods, and Nodes, and the metrics can be scraped by Prometheus.
Graphite doesn’t provide native Kubernetes integration like Prometheus does. However, you can use a StatsD daemon (like statsd-exporter) as a bridge between your applications running on Kubernetes and Graphite. Applications can send metrics to the StatsD daemon, which aggregates them and forwards them to Graphite.
You can also collect system-level metrics from your Kubernetes nodes and push them to Graphite. Tools like collectd or Telegraf can be used for this. You might have to build custom integrations or scripts to get metrics about the state of Kubernetes objects.
In both cases, visualizing the collected data is a common practice, and Grafana is a popular choice for this. Grafana can pull data from both Prometheus and Graphite, and it provides built-in dashboards for Kubernetes.
Installation and Deployment
Prometheus and Graphite, both used for monitoring purposes, have different installation and deployment processes that cater to their unique architectures.
Prometheus
1. Installation: Prometheus provides precompiled binaries for many platforms such as Linux, Mac OS X. Installing Prometheus can be as simple as downloading the appropriate binary and running it. There are also Docker images available for Prometheus.
2. Configuration: Once installed, you need to configure Prometheus to tell it where to scrape metrics from. This is done via a configuration file, written in YAML, where you specify the scrape targets and intervals.
3. Deployment: Prometheus provides a Kubernetes operator which simplifies deployment in Kubernetes environments. The operator manages the Prometheus instances and can create, configure, and manage Prometheus clusters on top of Kubernetes. For other environments, you can run Prometheus as a system service.
4. Scalability: For horizontal scalability, you can run multiple independent Prometheus servers which scrape the same targets. For long-term storage and higher query loads, you can use the Prometheus remote storage integrations such as Last9.
Graphite
1. Installation: Graphite installation can be more complex compared to Prometheus. Graphite is composed of several components (Carbon, Whisper, Graphite-web), each of which needs to be installed. Graphite does not provide precompiled binaries, so installation often requires fetching the code and dependencies, then building and installing it.
2. Configuration: Configuration of Graphite involves setting up and tuning the various components, configuring storage schemas and retention policies, and setting up the web interface.
3. Deployment: Graphite does not have a specific operator for Kubernetes like Prometheus, so it needs to be manually deployed as a set of containers or system services. For other environments, Graphite can be run as a system service.
4. Scalability: Graphite supports clustering and can thus be scaled horizontally by adding more servers. Graphite also supports replication for high availability.
In both cases, installation and deployment can be greatly simplified by using configuration management tools like Ansible, Chef, or Puppet, or using orchestration platforms like Kubernetes. Lastly, both have Docker images available, which can simplify the deployment process in containerized environments.
Conclusion
In conclusion, Prometheus and Graphite both serve as effective monitoring solutions for SRE and DevOps teams, but they suit different needs.There are other tools such as ElasticSearch and InfluxDB as well. If you’re looking for a solution that’s easy to set up with a powerful query language, flexible data model, and built-in alerting, Prometheus is the way to go. Conversely, if you need a simpler, straightforward time-series database with a focus on storage and rendering and you are okay with integrating external alerting systems, Graphite might be the right choice. It’s crucial to evaluate your individual use case and resources before making a decision.
Checkout Last9 - our managed time series data warehouse which efficient and economical alternative to traditional time series databases such as Prometheus and Graphite. Book a demo to know more.

