

As Prometheus has become the de facto standard for monitoring software applications in production, the use of Prometheus exporters has also grown over time.
The widespread adoption of Prometheus means that many applications now natively expose Prometheus-style metrics for monitoring.
However, some applications are unable to do this, and monitoring these applications requires a Prometheus exporter to collect metrics and transform them into ones that Prometheus can scrape.
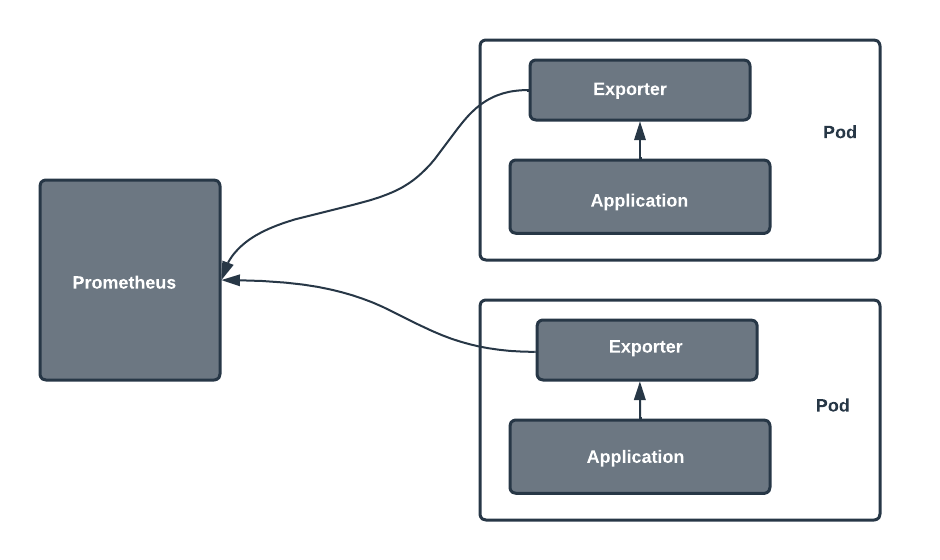
Prometheus exporters thus bridge the gap between Prometheus and applications that don't export metrics in the Prometheus format.
Prometheus monitoring is most commonly adopted in cloud-native environments. When exporters are used, they're often deployed alongside the application or systems they're scraping.
This article introduces Prometheus exporters, explains how to properly find and utilize pre-built exporters, and provides some tips, examples, and considerations for building your own exporters.
Choosing the Right Pre-built Exporters
Deciding on the best exporters for your use case can feel overwhelming. With so many options available, it’s essential to know where to start. Thankfully, there are tools and resources to guide you through this process.
Tools and Resources for Exporters
- Prometheus Website: The Prometheus server’s official site offers a curated list of recommended exporters for various use cases.
- PromCat: This platform helps you filter or select exporters based on categories, matching them to your monitoring system’s needs.
Key Considerations for Exporters
To make the most of pre-built exporters, focus on these factors:
- Metrics Exposure:
- Check if the exporter exposes metrics that align with your needs. For instance, common metrics like CPU and memory usage are crucial for many dashboards.
- Ensure compatibility with your monitoring system, whether it’s a Prometheus server or another tool.
- Configurability:
- Avoid overly generic exporters unless your use case demands flexibility.
- Look for exporters like the Node Exporter, which offer a balance between configurability and targeted metrics.
- Integration with Tools:
- Exporters that work seamlessly with open-source visualization tools like Grafana can simplify building effective dashboards.
When to Consider Custom Exporters
Although rare, some scenarios might require building a custom exporter:
- Third-party software lacks an existing exporter.
- Specific metrics collection needs, such as unique API or application-level data.
Pro Tip for Optimized Monitoring
Combine exporters with PromQL queries to unlock insights and drive decisions. Tailor your queries to create dashboards that provide actionable intelligence, whether it’s tracking memory usage, monitoring API calls, or analyzing Prometheus server performance.
Utilizing Pre-Built Prometheus Exporters
Each Prometheus exporter exposes its own set of metrics, so it’s essential to review the metrics for every exporter you use. Here are a few things to keep in mind:
- Information about metrics is usually found on the exporter's project page or documentation.
- Proper labeling helps you track resource usage, such as RAM and CPU, across different environments.
- A good data model with accurate labels improves insights and simplifies analysis.
When setting up notifications and alerting rules, focus on states that truly matter. Not every state is critical, so consider these steps:
- Identify the critical elements of your application that need monitoring.
- Determine the severity of states and decide which ones require an alert.
- Use Alertmanager to streamline notifications, ensuring only meaningful alerts reach your DevOps team.
As your use of exporters grows, scalability becomes a challenge. Planning can help:
- Use service discovery to manage and organize multiple exporters.
- For Linux systems, use exporters optimized for the environment to avoid unnecessary resource strain.
- Incorporate aggregation strategies to ensure Prometheus scales effectively as your system expands.
How to Build Your Own Exporters
In this section, you'll learn how to build an exporter in Python while following best practices. The exporter you'll create will export metrics from a simple Apache HTTP application server.
Prerequisites:
To follow along, ensure you have Docker and Prometheus installed.
- Clone the Project
Clone the project from the provided GitHub repository. - Build the Docker Image
docker build -t apache-website .- Run the Docker Container
docker run -d --name apache-website-01 -p 80:80 apache-website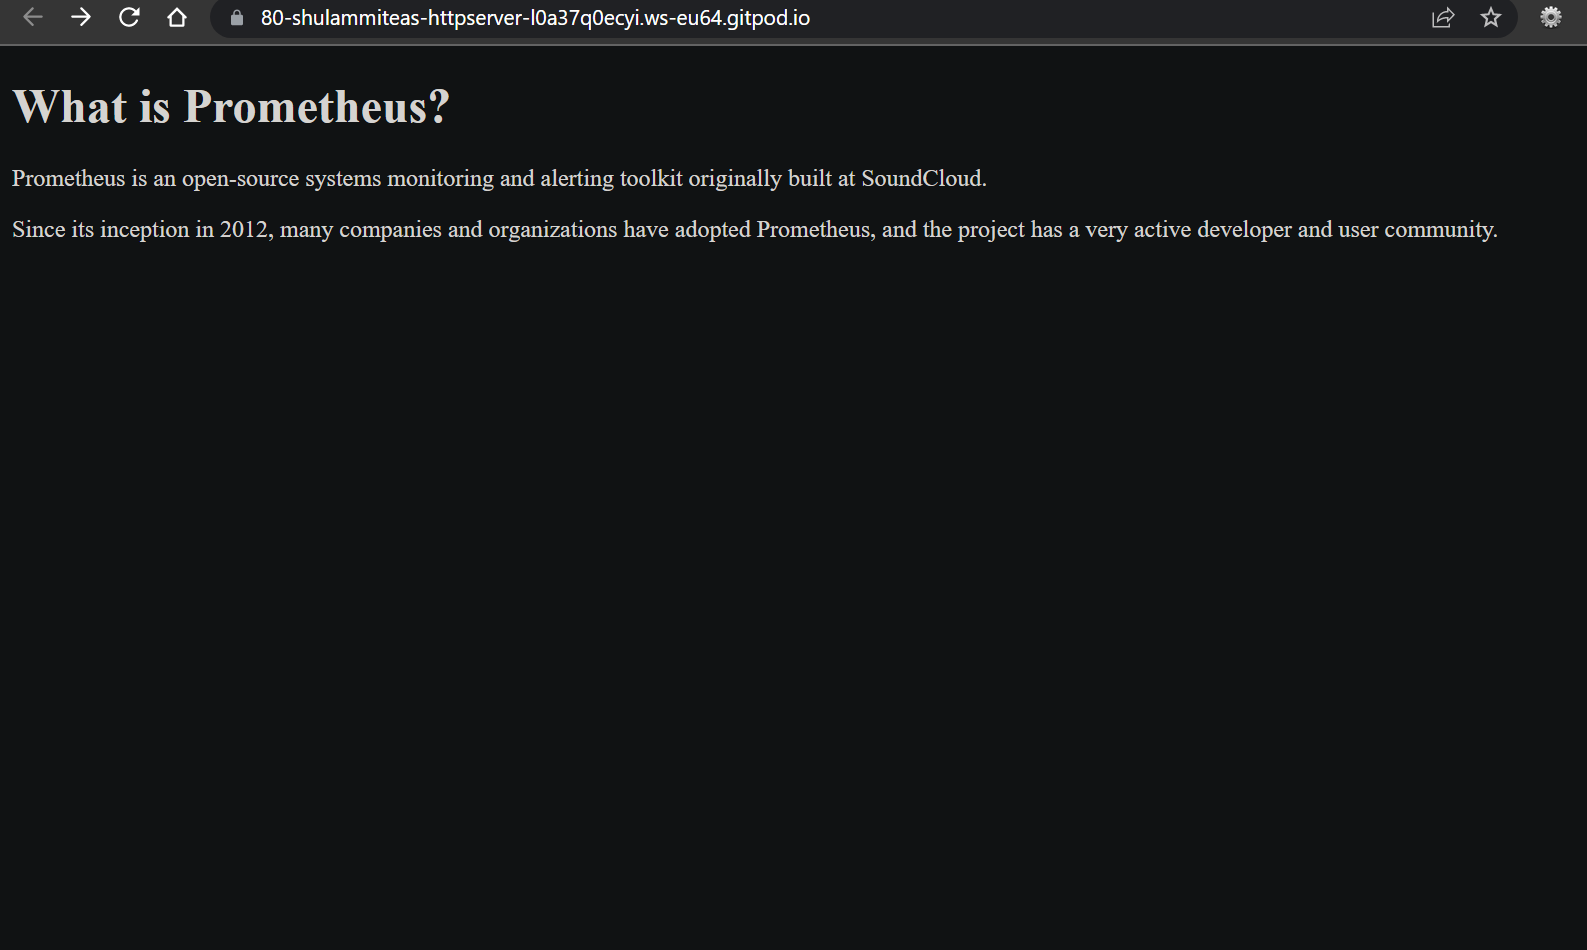
Note: For simplicity, the exporter you're building here is not customizable.
- Access the Sample Page
Once the container is running, you can view the sample page served at:
http://localhost:80/
To start, create a Python project or simply a directory where you'll write your exporter. For this example, the directory will be named httpd-exporter.
Inside this directory, create a __main__.py file with the following code, which imports all the dependencies you need for the project:
import requests
import time
from prometheus_client import start_http_server
from prometheus_client.core import GaugeMetricFamily, CounterMetricFamily, REGISTRY
In the following steps, you'll collect metrics from the application you're monitoring (in this case, an httpd application server), convert the collected metrics to the type of metrics that Prometheus understands, and lastly, expose the metrics on an endpoint.
Collecting Metrics from the Monitored App
Applications expose metrics in various ways, depending on their design. You might find metrics through:
- An application log file.
- A specific endpoint.
To build an exporter, the first step is to collect these metrics from their source.
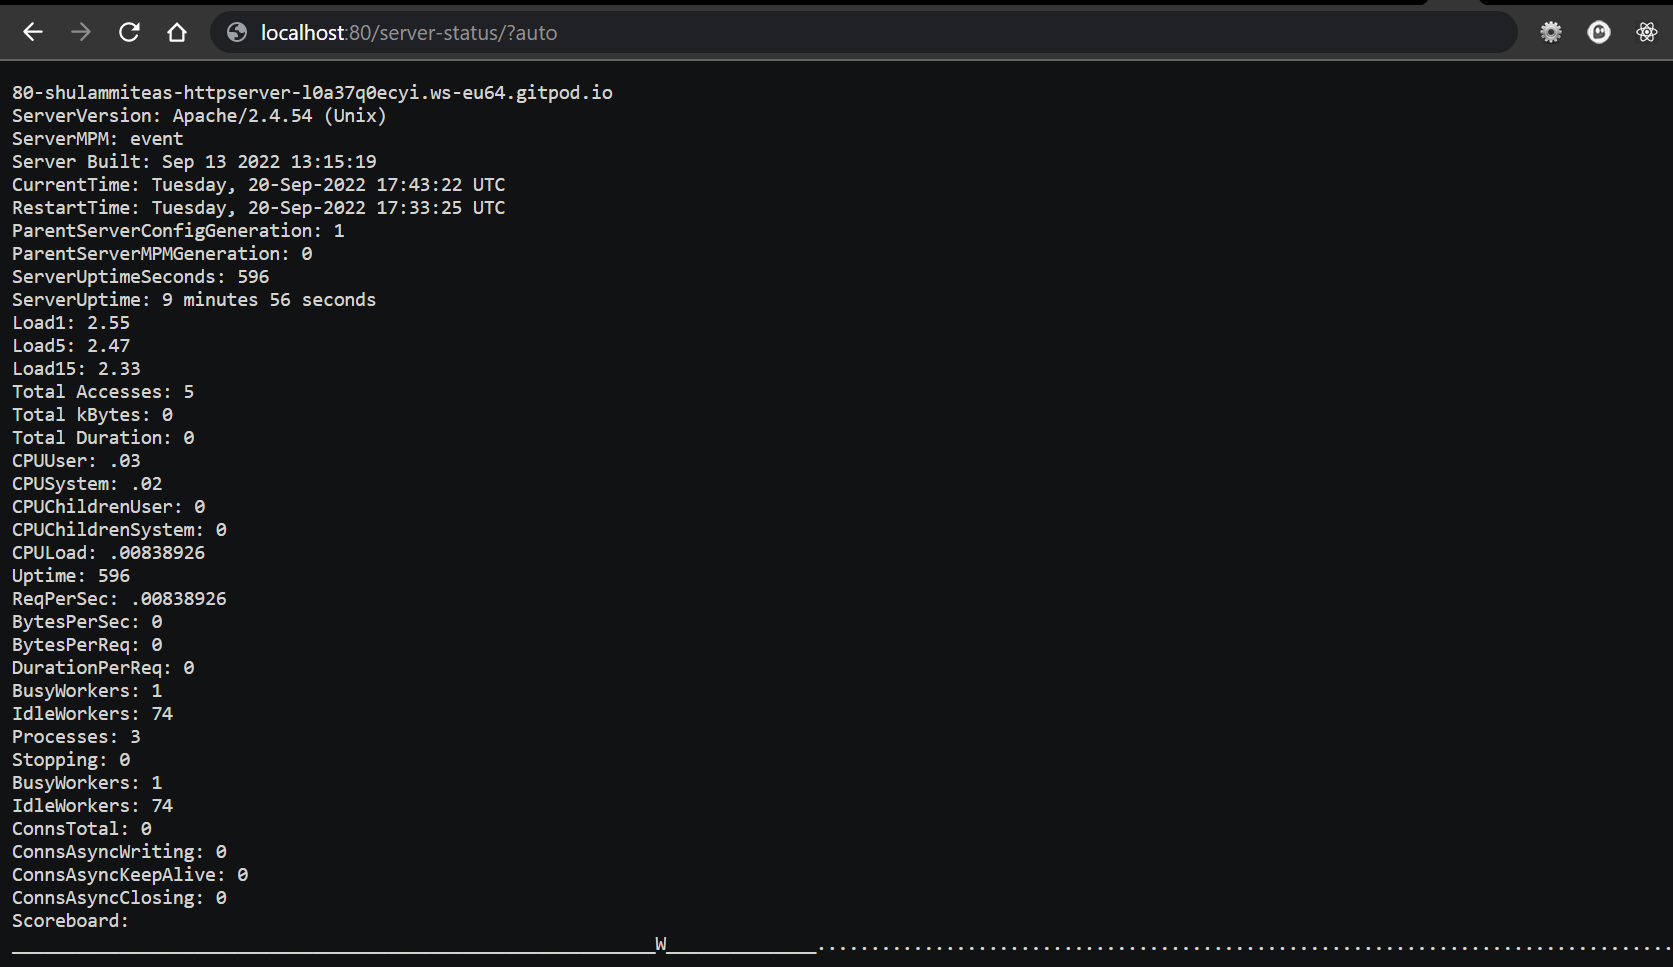
For an httpd application server, the metrics are accessible at the /server-status/?auto path of the port where httpd is running.
For example:
If you’ve run the base application as per earlier instructions, the metrics will be available at: http://localhost:80/server-status/?auto
This URL provides the data your exporter needs to process and present in a format Prometheus can scrape. Let me know if you'd like to expand on this!
After reviewing the metrics exposed there, you can collect them by making a GET request to the URL. The following code makes this request in Python:
APP_URL = "http://localhost:80/server-status/?auto"

def get_metrics():
    resp = requests.get(url=APP_URL)
    byte_data = resp.content

    data = str(byte_data, 'UTF-8')

    lines = data.split('\n')

    return lines

def split_pair(pair=""):
    key_and_value = pair.split(':')
    value = key_and_value[1].strip()
    return float(value)
If you're familiar with Python, you'll know that the get_metrics() function makes a GET request to your server metrics endpoint and returns the result as a list of lines. Each of the lines contains a key-value pair representing metrics. The split_pair() function returns the value in the pair.
Creating Prometheus Metrics
Once you've collected metrics from the monitored application, the next step is to create metrics in a format Prometheus can understand.
Prometheus Core Metric Types
Prometheus supports the following metric types:
- Counter: Tracks a value that only increases (e.g., requests served).
- Gauge: Tracks a value that can go up or down (e.g., memory usage).
- Histogram: Measures observations and buckets them into ranges (e.g., request durations).
- Summary: Similar to a histogram but includes quantiles for detailed observation summaries.
Converting Application Metrics
You can either:
- Convert all the exposed metrics to Prometheus-compatible types.
- Focus on the metrics most relevant to your needs.
For example, in this guide, you’ll write code to convert three key application metrics into Prometheus metrics that can be scraped.
Implementing a Custom Collector
Instead of using direct instrumentation (where metrics are created globally), an exporter requires a custom collector. The custom collector:
- Creates new metrics dynamically at each scrape.
- Updates metric values based on the latest data from the monitored application.
This ensures that Prometheus fetches fresh and accurate data with every scrape.
For example, in direct instrumentation, you would write:
from prometheus_client import Gauge
gauge = Gauge('gauge_name', 'gauge description')

# code to get gauge value here
gauge.set(gauge_value)
However, in an exporter, you would write:
from prometheus_client.core import GaugeMetricFamily, REGISTRY

class CustomCollector(object):
    def collect(self):
        yield GaugeMetricFamily('my_gauge', 'Help text', value=gauge_value)

REGISTRY.register(CustomCollector())
Proceed by adding the following code to your __main__.py file:
class CustomCollector(object):
    def __init__(self):
        pass

    def collect(self):
        lines = get_metrics()
        for i in lines:
            if "ServerUptimeSeconds" in i:
                v = split_pair(i)
                yield CounterMetricFamily('httpd_server_uptime', 'How long the application server has been up', value=v)
            elif "CPULoad" in i:
                v = split_pair(i)
                yield GaugeMetricFamily('httpd_server_CPU_load', 'How many requests per second the server is processing', value=v)
The code above defines a class called CustomCollector and create two of the three metrics that you want Prometheus to scrape.
To better understand what each part of the code is doing, let's analyze one of the items of the for-loop:
if "ServerUptimeSeconds" in i:
                v = split_pair(i)
                yield CounterMetricFamily('httpd_server_uptime', 'How long the application server has been up', value=v)
Within the data returned from the get_metrics() function, the line that contains the string "ServerUptimeSeconds" holds the value that represents the server uptime of the httpd server you're monitoring. In the first two lines of the code, you programmatically retrieve that value.
Using Python Client Library
The Python client library's custom collector functionality allows defining Prometheus metrics using the following functions:
- CounterMetricFamily: Tracks metrics that increase over time.
- GaugeMetricFamily: Handles metrics that fluctuate, increasing or decreasing.
- HistogramMetricFamily: Tracks data distribution across specified buckets.
- SummaryMetricFamily: Measures observations with quantiles for detailed analysis.
Creating a Counter Metric
To define a counter metric with CounterMetricFamily:
- Metric Name: Use snake_case for consistency with Prometheus standards.
- Help Text: Add a description that explains the metric's purpose.
- Value: Assign the value based on collected metrics from the monitored application.
Example:
A counter metric named httpd_requests_total could represent the total requests processed by an httpd server.
Naming Best Practices
- Avoid Generic Names: Overly generic names can confuse users or cause conflicts.
- Use Prefixes: Start metric names with the system or exporter's name (e.g.,
httpd_for metrics related to an httpd server). - Ensure Clarity: Design names that make the metric's purpose evident, even to someone unfamiliar with your system.
Adopting these practices helps maintain clarity and ensures Prometheus metrics are easy to understand and use.
To create a third metric that has more than one value and that uses labels to categorize the values, change your CustomCollector class to the following:
class CustomCollector(object):
    def __init__(self):
        pass

    def collect(self):
        lines = get_metrics()
        server_threads = GaugeMetricFamily('httpd_server_threads', 'Number of workers available on the application server', labels=['worker_state'])
        for i in lines:
            if "ServerUptimeSeconds" in i:
                v = split_pair(i)
                yield CounterMetricFamily('httpd_server_uptime', 'How long the application server has been up', value=v)
            elif "CPULoad" in i:
                v = split_pair(i)
                yield GaugeMetricFamily('httpd_server_CPU_load', 'How many requests per second the server is processing', value=v)
            elif "BusyWorkers" in i:
                v = split_pair(i)
                server_threads.add_metric(['busy'], v)
            elif "IdleWorkers" in i:
                v = split_pair(i)
                server_threads.add_metric(['idle'], v)

        yield server_threads
The label name for this third metric is worker_state, and it has two variations: busy and idle. Bear in mind that Prometheus advises against using labels to put things into one metric just because they share a prefix.
The example code presented up to this point creates three metrics that you want to export; in practice, you'll very likely want to export more.
In any case, the same principle you have followed here will apply. You can read more about best practices for writing exporters here
Exposing the Endpoint
The final step in completing your exporter is to expose the metrics you've created. The client library makes this very easy to achieve. Add the code below after your collector class:
if __name__ == "__main__":
    start_http_server(8000)
    REGISTRY.register(CustomCollector())
    while True:
        time.sleep(1)
By exposing a port number using start_http_server and registering your custom collector, your metrics are ready to be scraped by Prometheus from the /metrics endpoint. You can also see them firsthand by visiting the endpoint at http://localhost:8000/metrics:
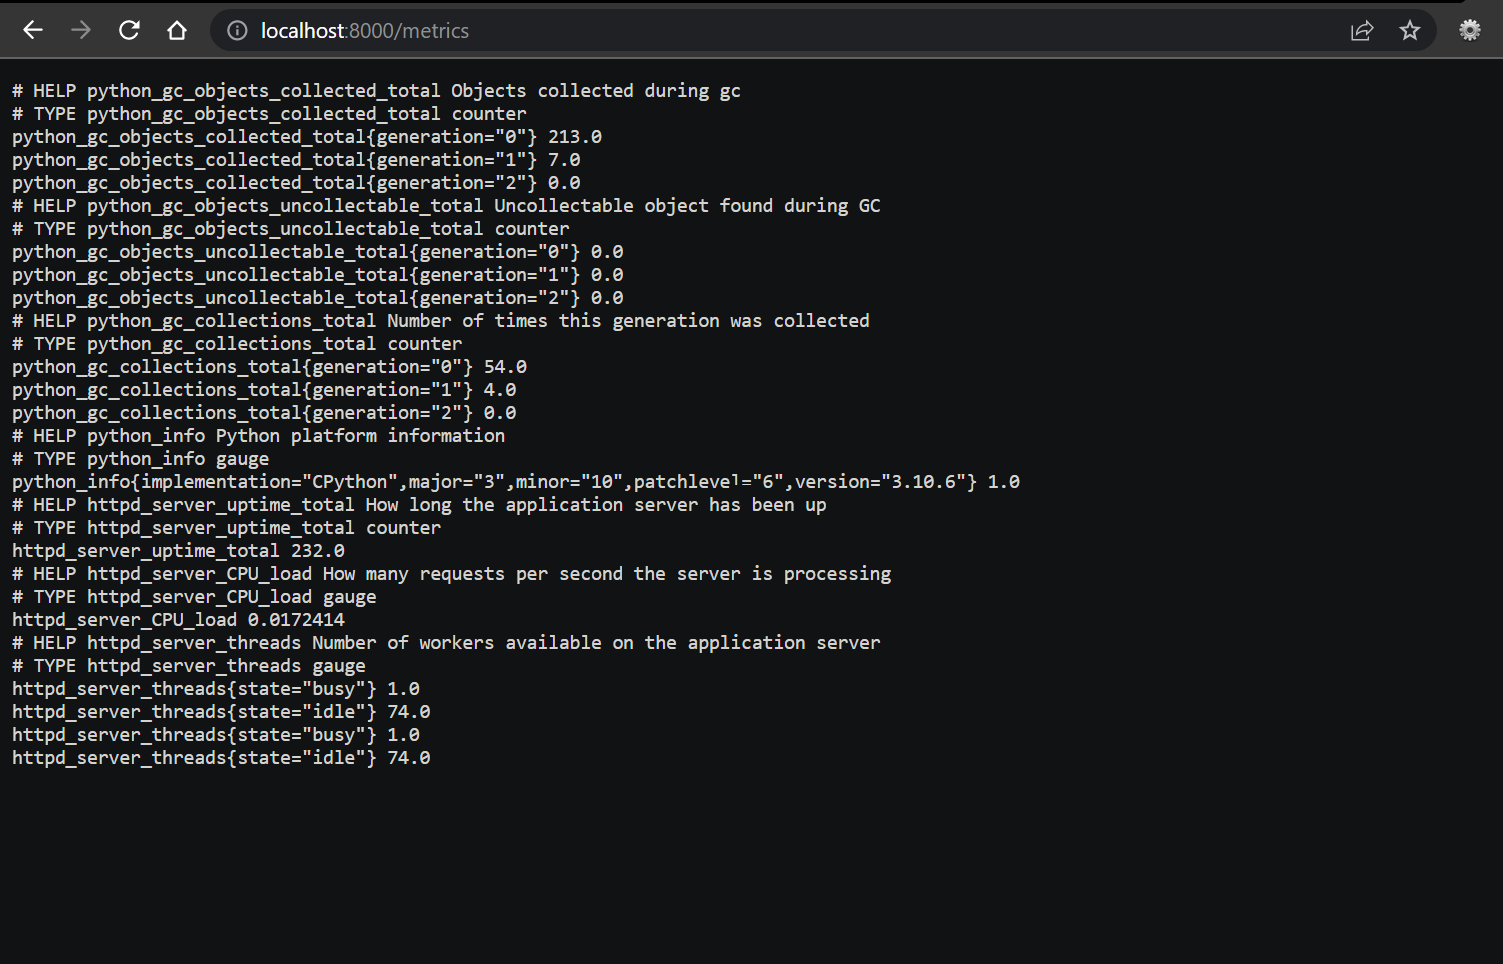
The final code snippet can be found here.
Now you can configure Prometheus, run it, and visualize the data. Create a file called prometheus.yml. The configuration below tells Prometheus to scrape your exporter's /metrics endpoint:
global:
  scrape_interval: 5s
  evaluation_interval: 15s
scrape_configs:
  - job_name: "httpd"
    static_configs:
      - targets: ["localhost:8000"]
Run your Prometheus binary from your terminal while passing
--config.file=prometheus.yml to it:
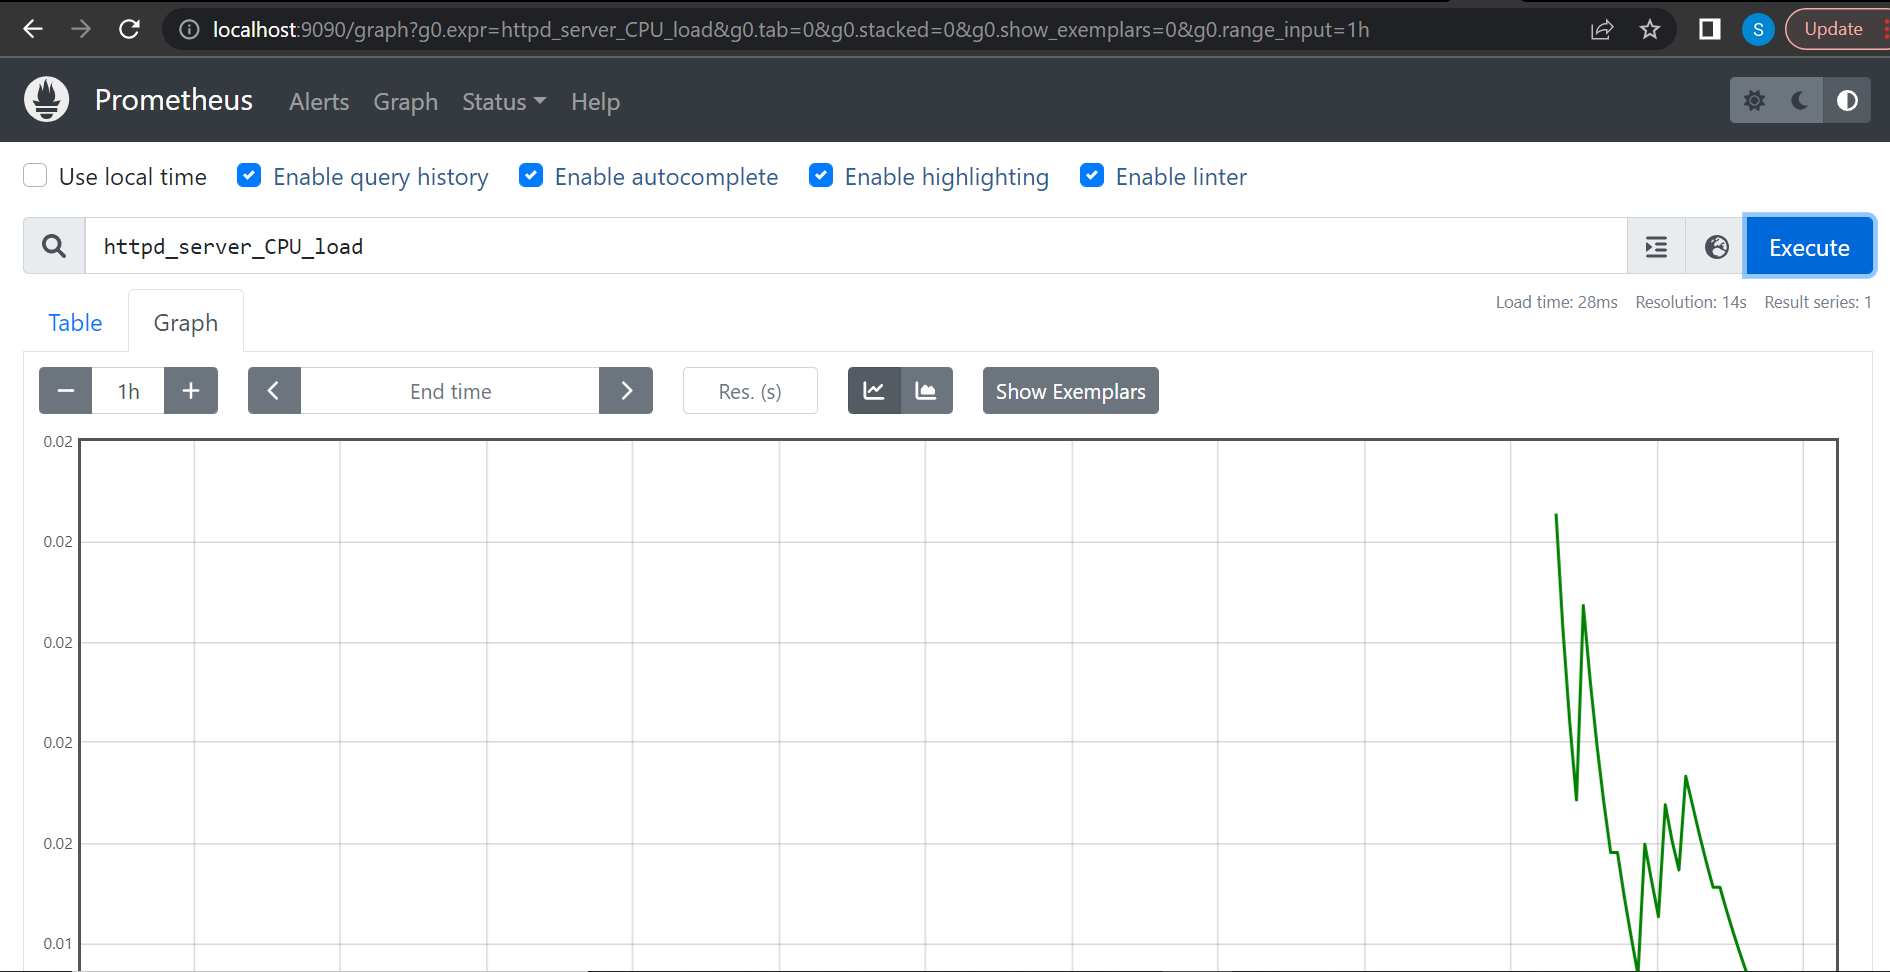
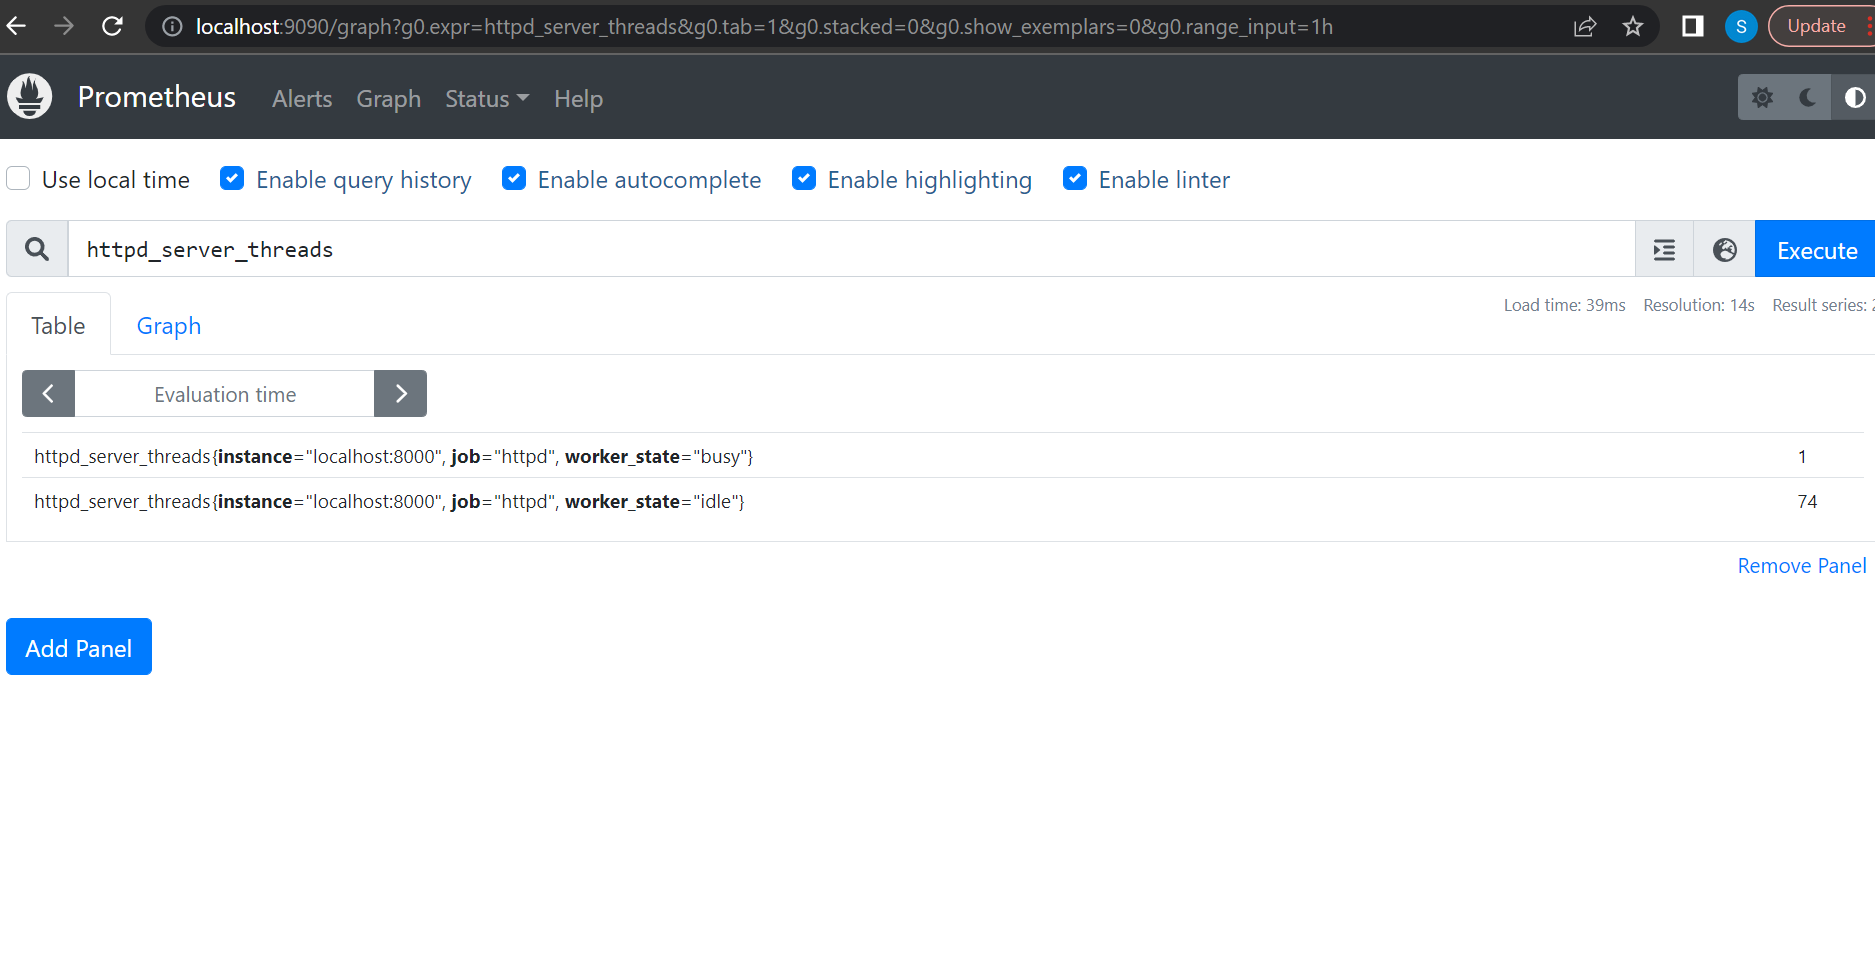
./prometheus --config.file=prometheus.ymlYou should now see your httpd server metrics on Prometheus's built-in expression browser. Navigate to http://localhost:9090/graph and query using any of your metric names. You can switch between the table and graph tabs to see how your data is represented in each format.
Below is a graph for the httpd_server_CPU_load query:
Below is a table for the httpd_server_threads query:
Conclusion
In this article, you learned what Prometheus exporters are, and how to properly choose exporters that will suit your needs. You saw that there are curated lists of vetted exporters that can save you a lot of time when trying to decide what to adopt.
You also learned how to build an exporter of your own using the Python client library, as well as some of the best practices to follow while building one.
