
Last9 Named a Gartner® Cool Vendor in AI for SRE and Observability
Gartner recognizes Last9 in their latest Cool Vendor report for unified telemetry and agentic SDK—moving teams from reactive monitoring to proactive ops.
Nishant Modak

Zero-Code OpenTelemetry for Vert.x
Drop a JAR on the JVM. Get distributed tracing, RxJava context propagation, log-trace correlation, and Vert.x internal metrics. No code changes. No Maven dependency. Java 8–21. Inside the design of last9/vertx-opentelemetry v2.3.4.
Prathamesh Sonpatki

Kubernetes Monitoring Tools: What Actually Works at Scale
What actually works for Kubernetes monitoring at scale — not what looks good in a vendor demo with a five-pod cluster.
Faiz Shaikh
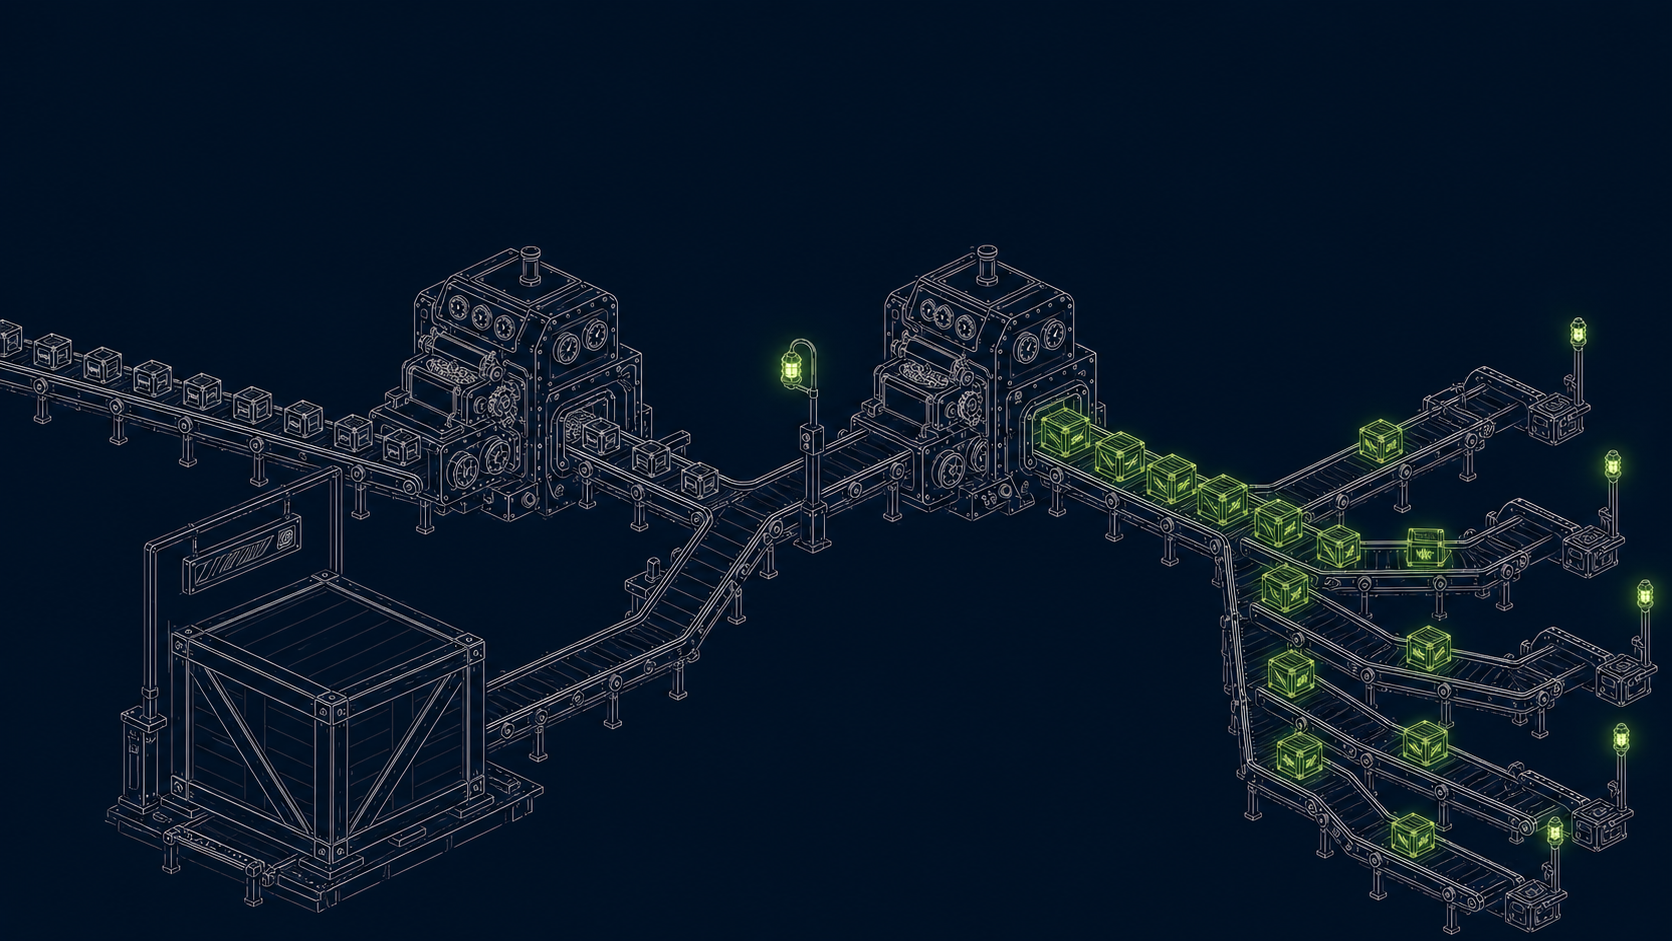
Stop ECS Containers From Collapsing Into One Service in OpenTelemetry
Why ECS containers collapse under service.name = aws_ecs and how to fix it for both EC2 launch type and Fargate, including the resource-vs-log-record pitfall that quietly breaks log filtering.
Prathamesh Sonpatki
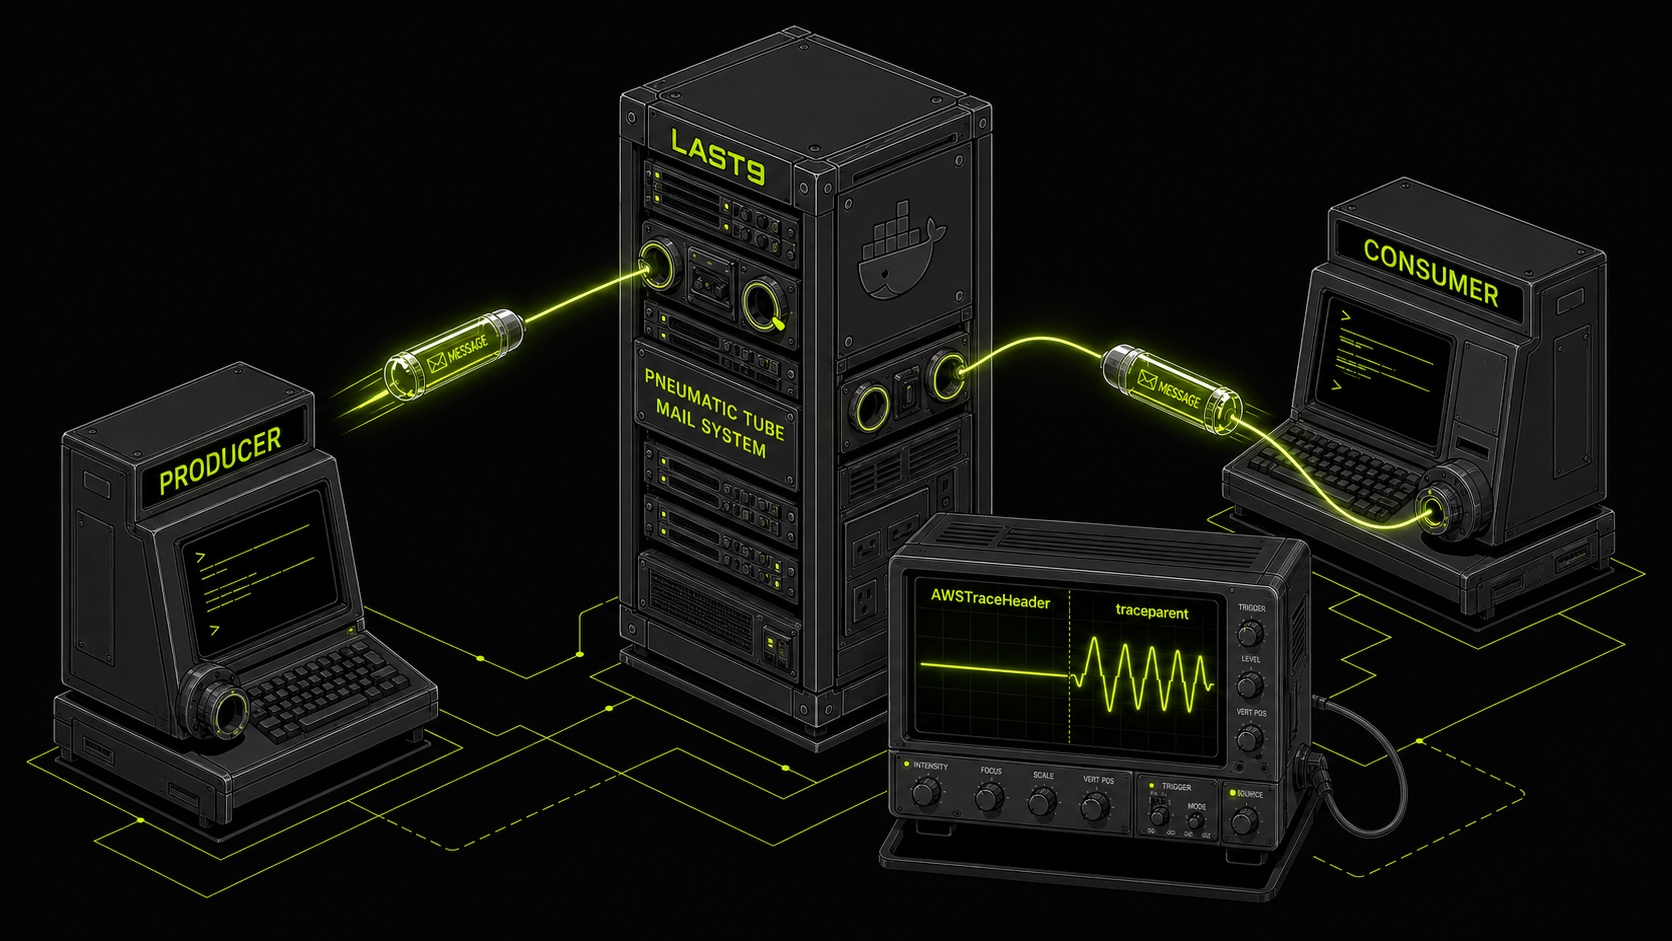
How to Test SQS Workflows Locally with LocalStack and OpenTelemetry
LocalStack lets you run SQS, Lambda, and S3 locally in Docker — but there's a hidden trap: OpenTelemetry's default AWS propagator doesn't work with free LocalStack. Here's how to set up end-to-end local testing with working trace propagation.
Prathamesh Sonpatki

End-to-End Trace Propagation Across SQS and Lambda with OpenTelemetry
SQS doesn't propagate trace context automatically. You instrument both sides, deploy, and get two disconnected traces. This post shows how to wire them into one waterfall — and the ESM format gotcha that silently breaks it every time.
Prathamesh Sonpatki
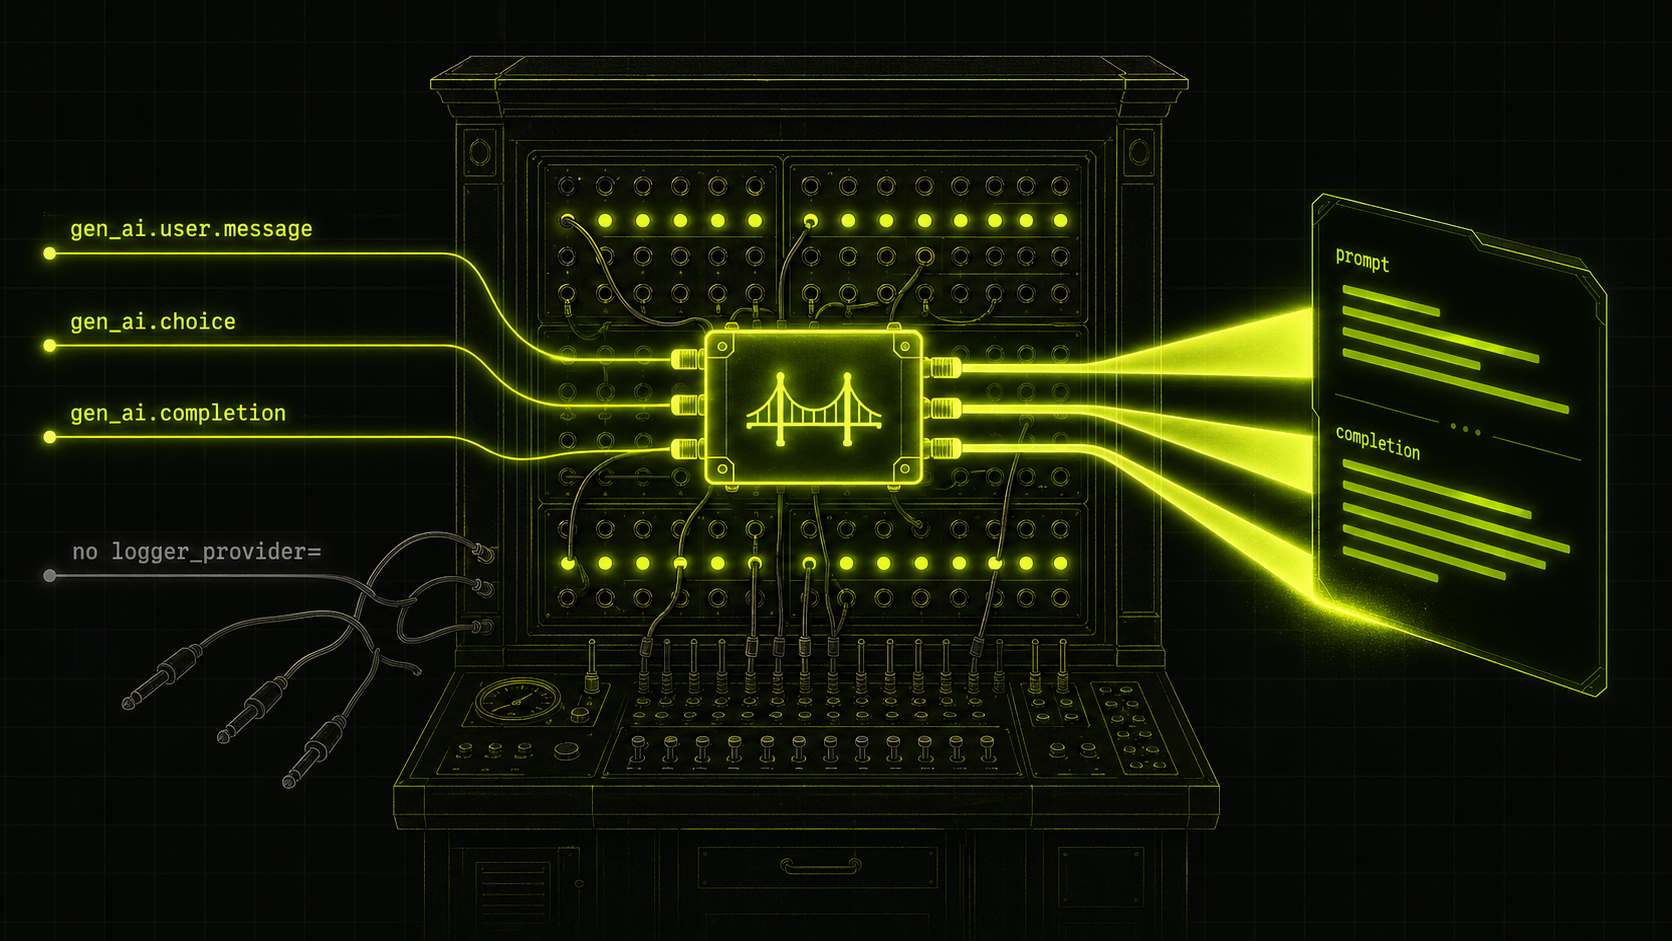
last9-genai: Closing the Conversation Gap in LLM Observability
OpenTelemetry's GenAI instrumentation gives you spans and token counts. It does not give you conversations, workflow cost rollups, or prompts visible in your dashboard. last9-genai is an OTel extension that fills those three gaps — without replacing your existing observability stack.
Prathamesh Sonpatki
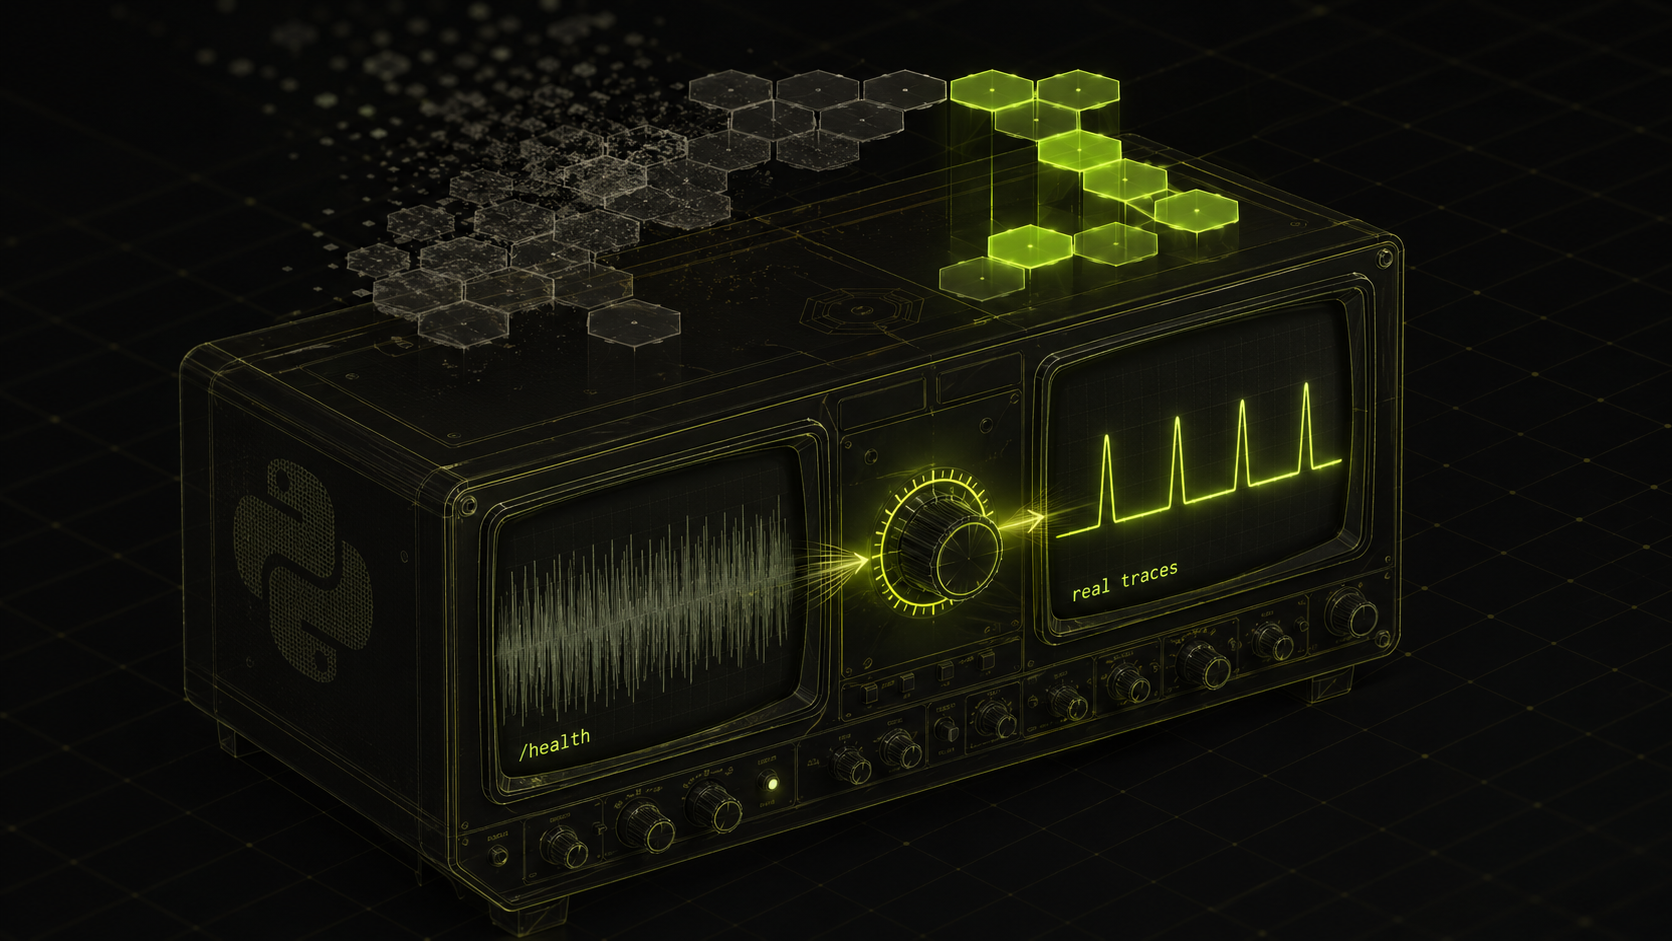
How to Exclude Health Check Endpoints from Python OTel Traces
Health check endpoints generate thousands of identical, useless spans per day. Here are two production-ready approaches to filter them from your Python OTel traces — and the correctness trap most implementations miss.
Prathamesh Sonpatki

Argo Rollouts Canary Monitoring: Metrics, Gotchas, and Automated Gates with Last9
Argo Rollouts exposes Prometheus metrics on port 8090 — but the docs lie about which labels exist. Here's how to scrape them into Last9, build a canary dashboard, and use Last9 as an automated AnalysisTemplate gate, including the auth and base64 gotchas.
Prathamesh Sonpatki

What is AI SRE? The Complete Guide to AI-Assisted Site Reliability Engineering
It's 2:47 AM. PagerDuty fires. You open a Slack alert and see: p99 latency spike on checkout-service. You SSH into the host, check dashboards in four tabs, grep logs for the last 20 minutes, and eventually find a slow query introduced in a deploy six hours ago. It took 34 minutes. You resolved it, w
Prathamesh Sonpatki