
Debugging is an engineer’s birthright, and logs are her best friend. But how do you determine how your PromQL queries are performing with Levitate?
One way is to figure it out by exploring with Grafana, but that’s not the ideal way, as there is no central place to find out and debug slow queries, optimize, and understand which ones are working great.
With the Query Logs feature in this release, you can find out how the queries are performing and take necessary actions. You can inspect all the queries for each Levitate cluster with the newly released Query Logs feature.
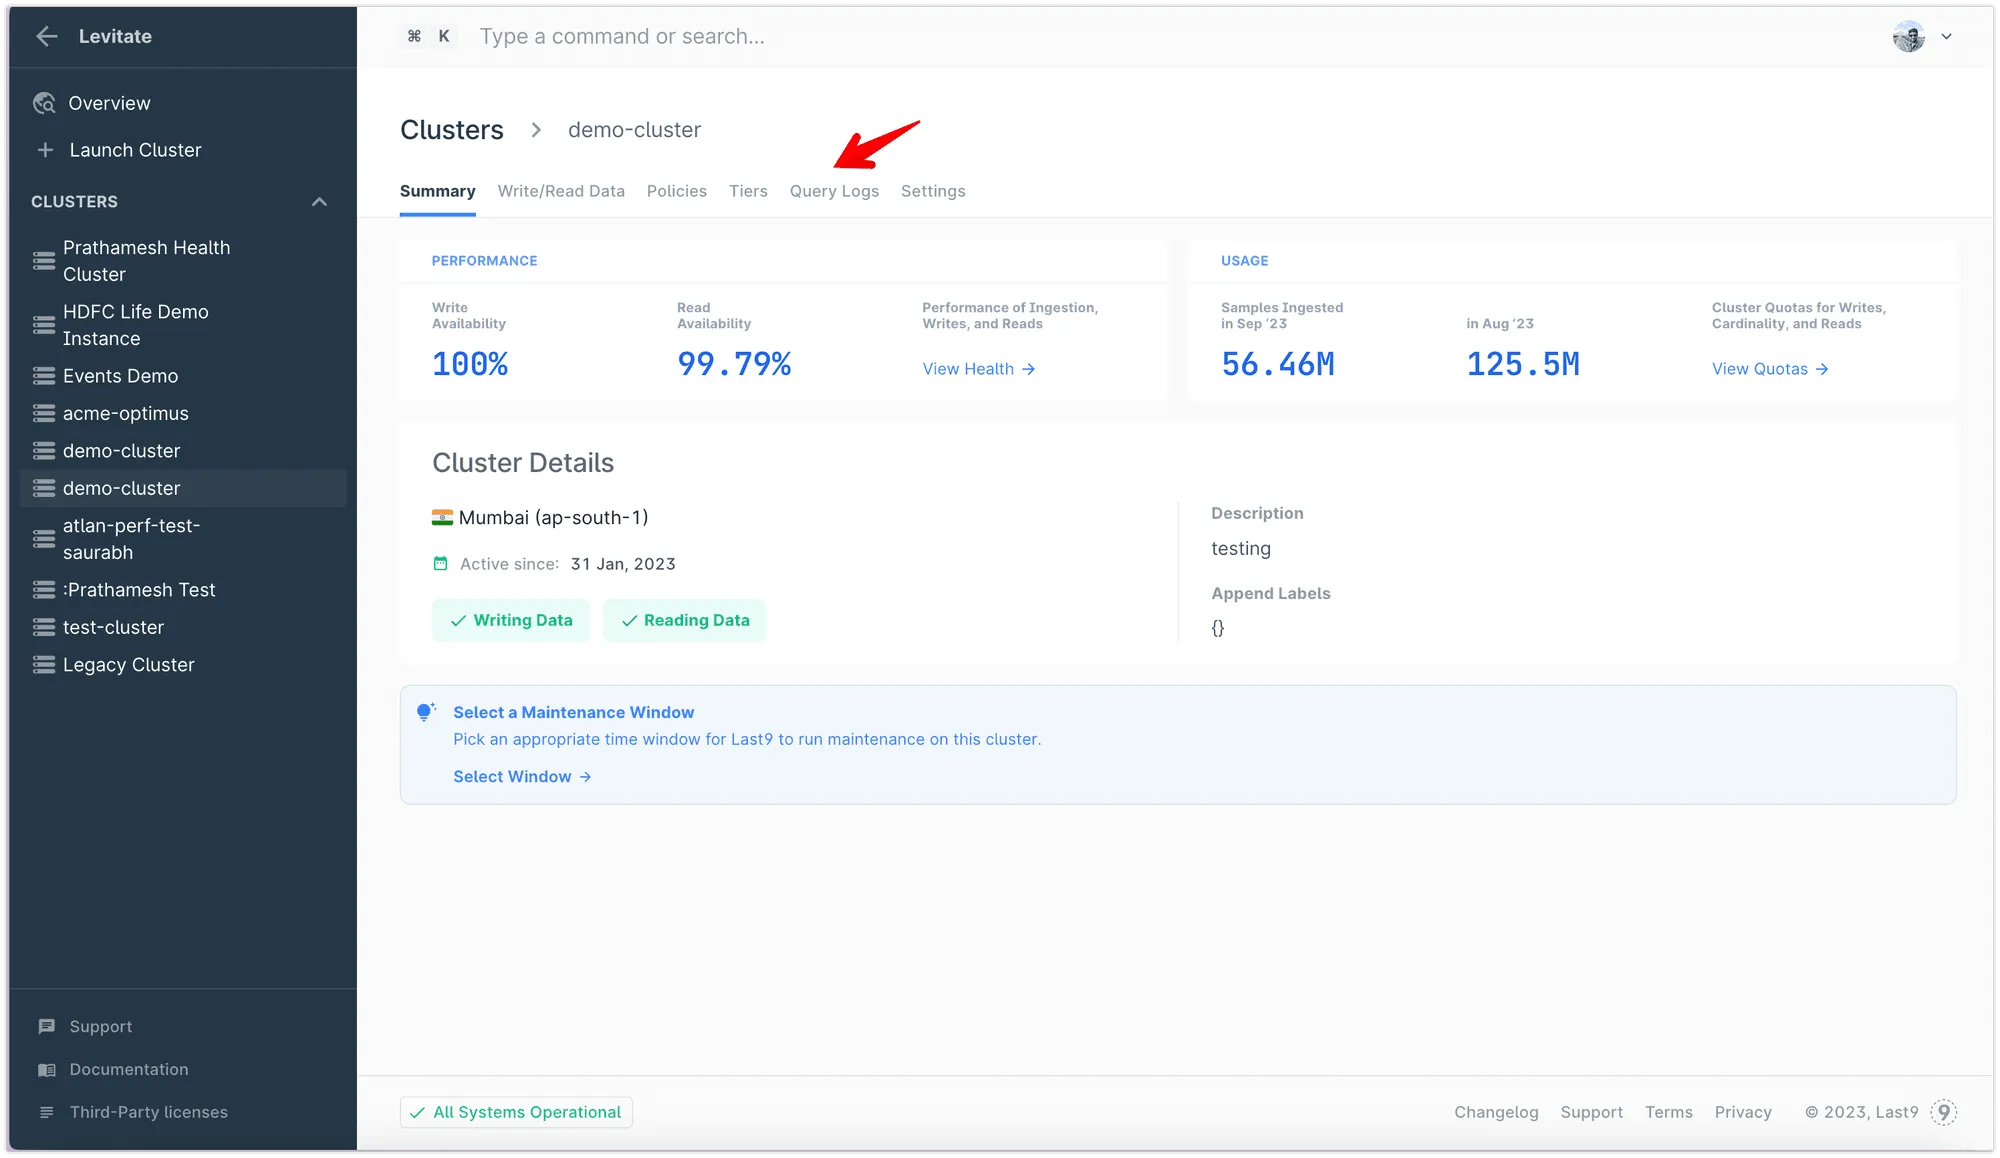
Just go to the cluster and visit the “Query Logs” tab.
Features
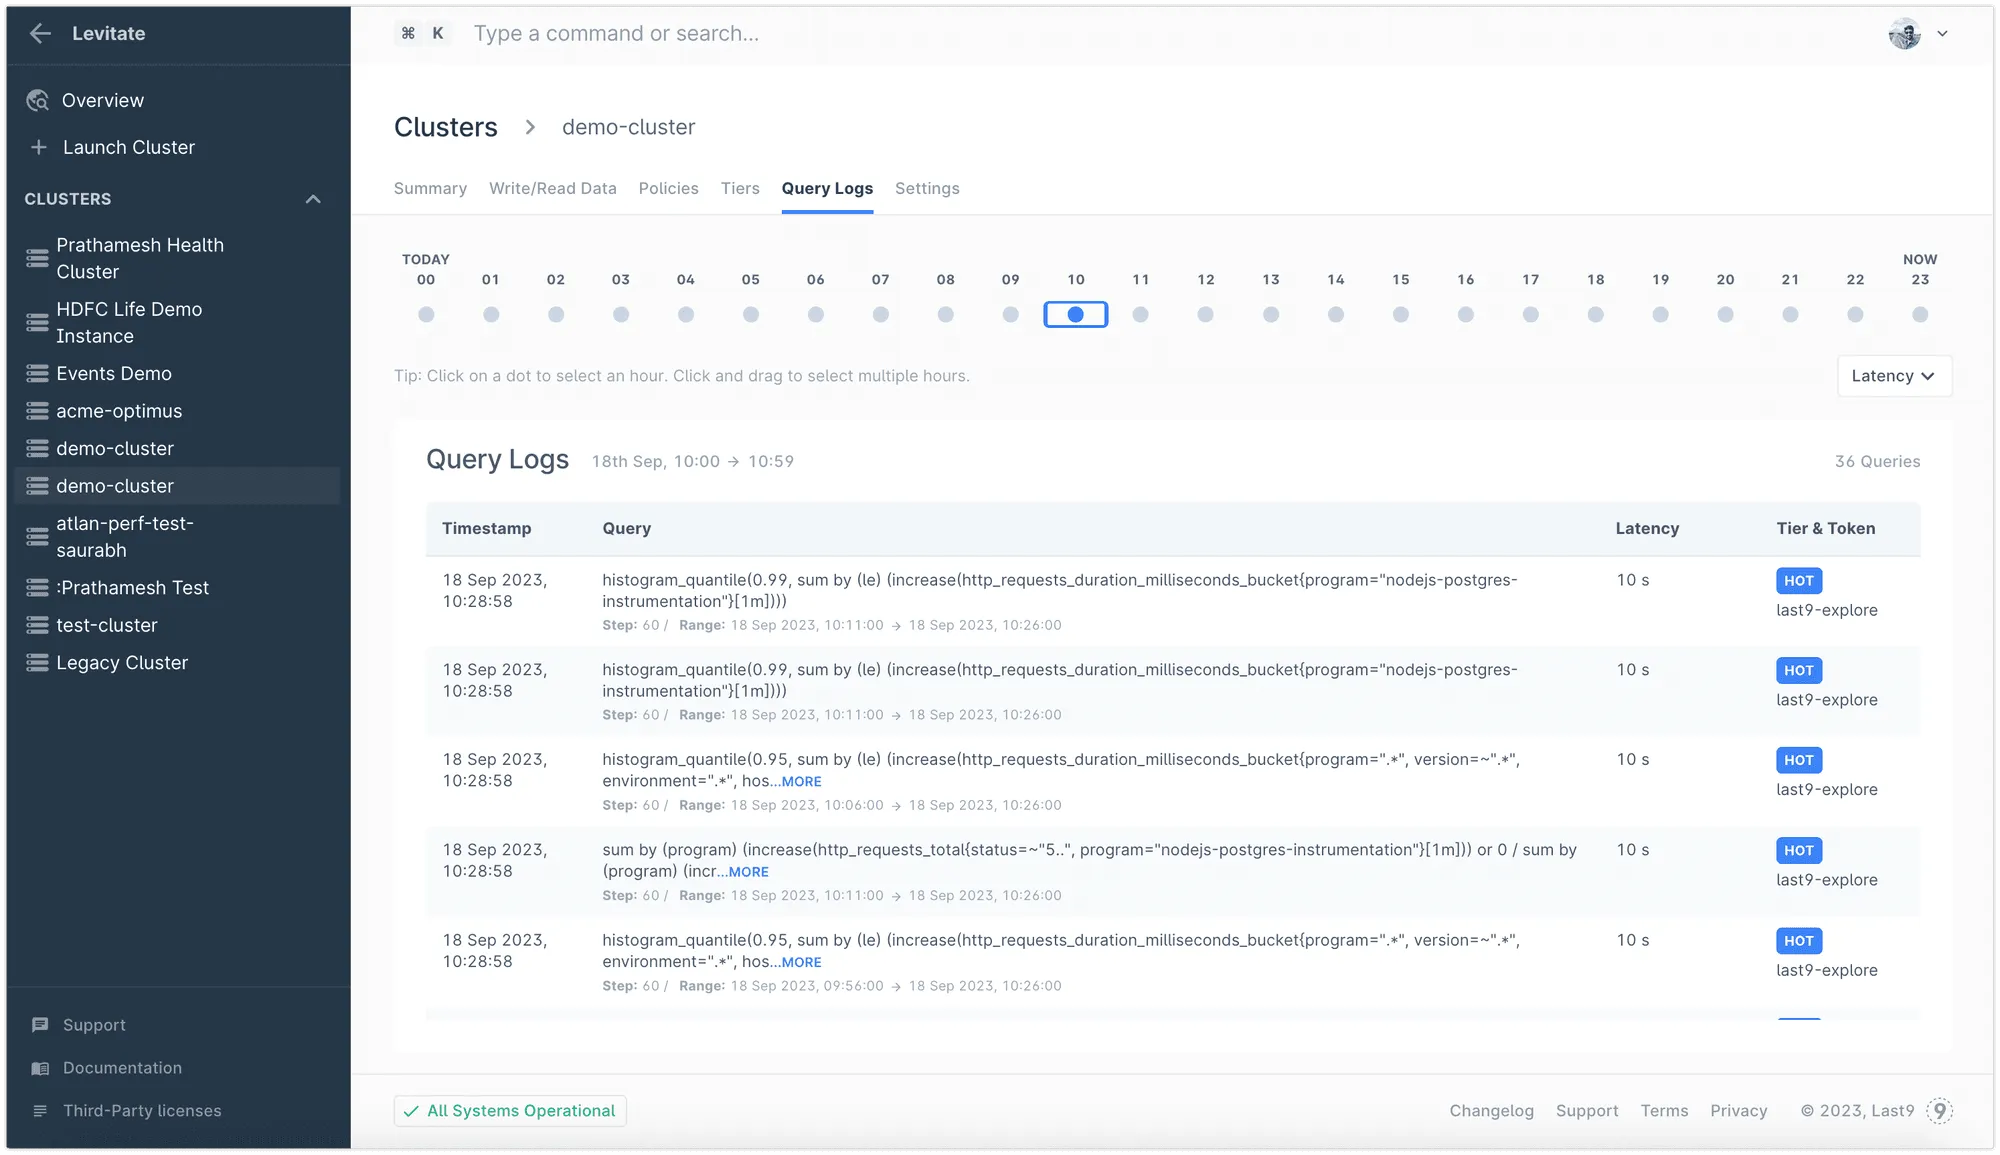
- The last 24 hours of queries are displayed in reverse chronological order by default.
- Jump between any hour by clicking the dot.
- Along with the query, additional information is displayed, such as the step size, range, the time required to run it, and which tier and token were used to run the query.
Happy debugging and optimizing PromQL queries with Levitate!