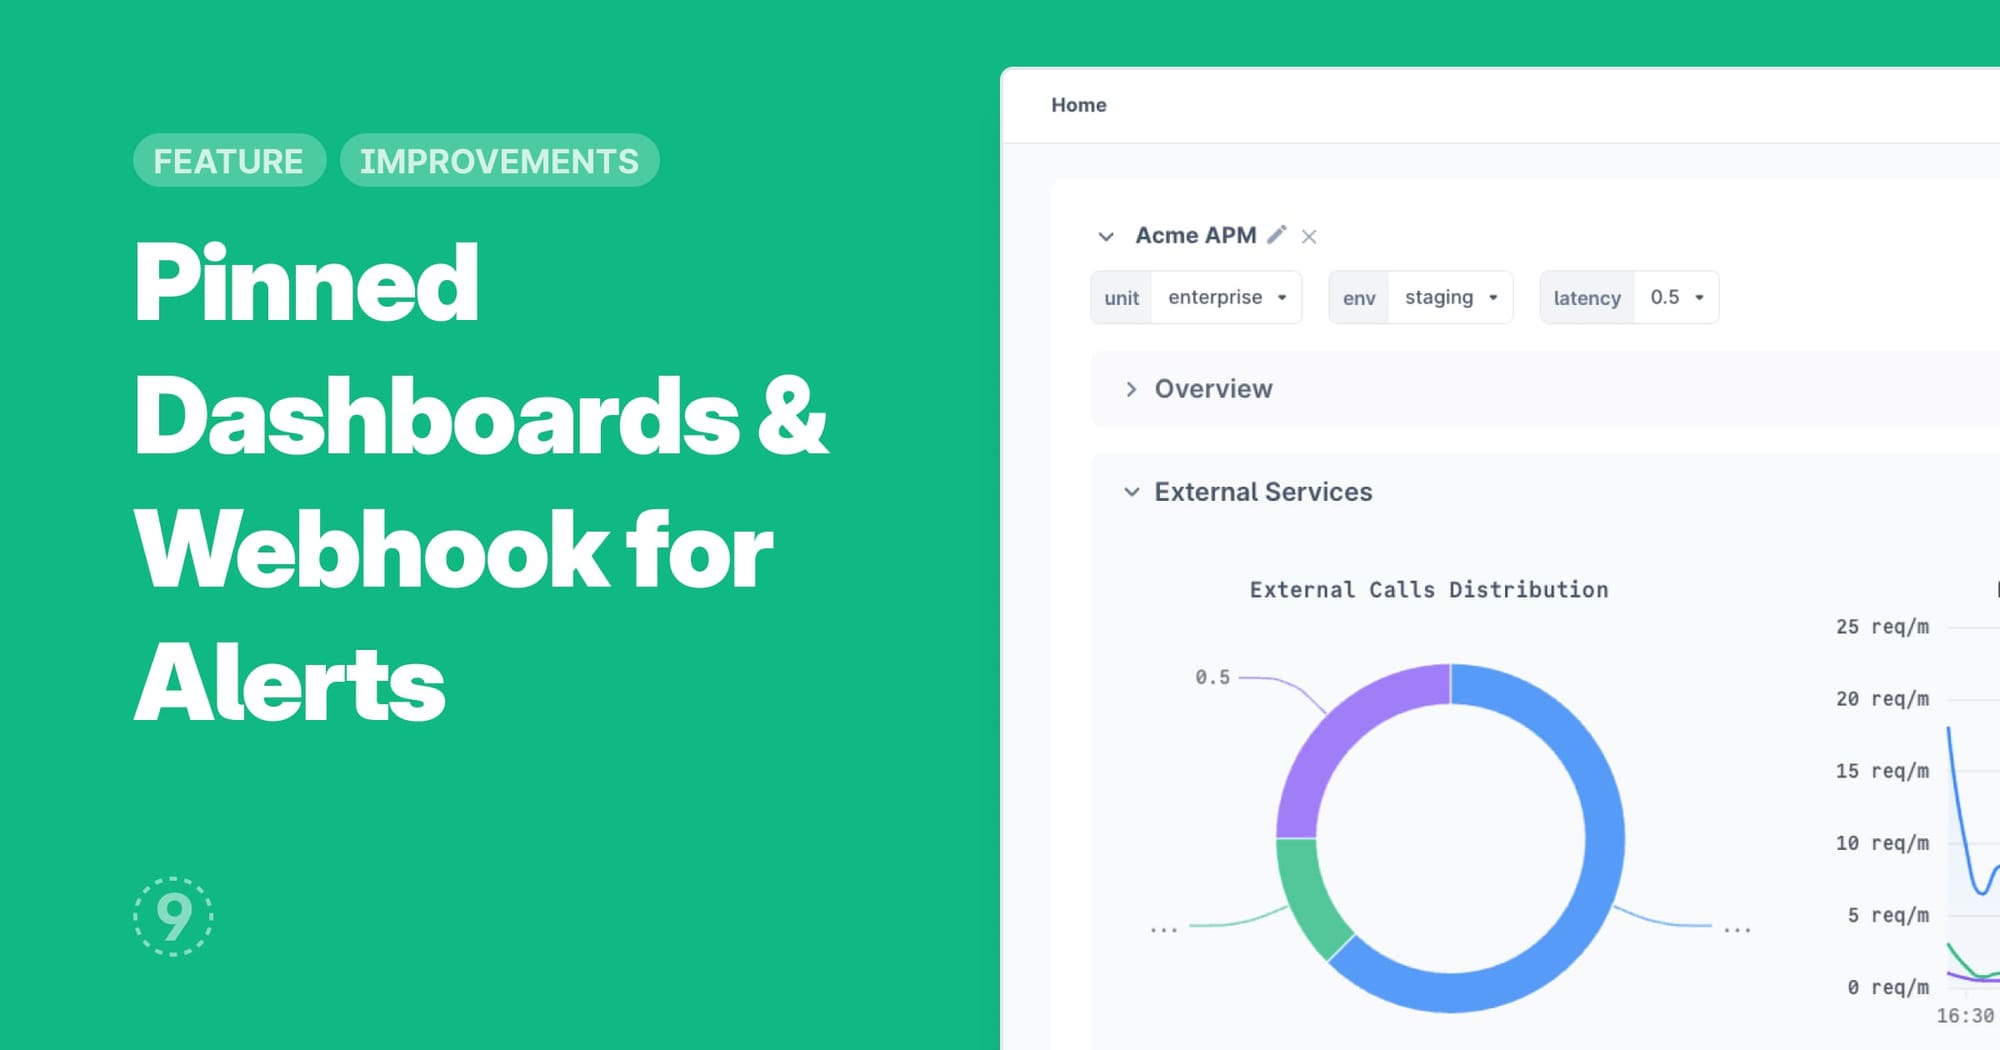
Pin Dashboard to Home Page
Personalize your monitoring experience by pinning one dashboard to your home page for immediate access. Configure variables for service, geography, and other dimensions to create a customized view of the metrics most relevant to your role. If a dashboard has multiple sections, you can toggle which sections are visible.
This feature streamlines your workflow by:
- providing instant access to critical metrics without additional navigation, creating personalized views tailored to your specific responsibilities,
- and enabling faster insights during both routine monitoring and incidents.
The entire team benefits from increased efficiency as each member can configure role-specific dashboards that focus on their areas of concern.
Webhook Alert Notification Channel
Configure webhooks as notification channels within alert rules to enable advanced automation workflows. Receive standardized payloads that can be processed by your custom systems.
With webhook notifications, you can integrate alerts directly into your automation pipelines, create custom response workflows for specific alert conditions, and accelerate incident resolution through automated actions.
This flexible integration allows you to connect your alerting system with third-party tools already in your technology stack, creating a more cohesive and responsive monitoring environment. Read our docs on how to use webhooks as a channel.
Improvements
- Timeslice function in Logs Explorer aggregate queries: Added support for more granular time-based analysis in aggregate queries, enabling better trend visualization.
- Drag and Drop for Dashboards panel management:
- Move panels by dragging and dropping them to new positions
- Resize panels by dragging panel edges for more flexible dashboard layouts
- Support for multiple indicators in Alert Visualizations:
- Plot multiple indicator values simultaneously in Alert Visualizations
- Support for multiple indicator queries in 'View in Grafana' redirects
- Improvements to API Catalog:
- Added Availability Chart to the Details side panel
- Implemented greater/less than filters for Throughput, Error Rate, and Latency columns
- Persist selected filters or opened endpoint details side panel in URLs for easier sharing of filtered views or deep-linking to the details of a particular endpoint
- Skip endpoints with zero requests to reduce clutter
- Default sorting on throughput for better focus on active endpoints
