

You want to learn more about the three pillars of observability and perhaps even start implementing them in your organization. Or you are a seasoned SRE/DevOps/Engineering and want to brush up your knowledge on observability and Telemetry. Either way, going over Telemetry and different types of data such as metrics, events, logs, and traces is the first step. This post will introduce Metrics, Events, Logs, and Traces and discuss their pros and cons about what value they provide. We will discuss –
- What is Telemetry
- Two key outcomes that we expect from the Telemetry data as SRE and DevOps Teams
- Types of Telemetry Data and Key Pillars of Observability - M.E.L.T.
- What are Logs
- What are Metrics
- What are Traces
- What are Events
- Comparing M.E.L.T.
Telemetry
The observability journey starts with instrumentation where data is collected from different micro-services, apis, infrastructure components in the form of telemetry.
It is used to understand the system health, faults, troubleshooting, degradations, exploring dashboards, and alerting with the help various observability and monitoring tools — both Open source such as ELK Stack, Prometheus, Jaeger and tools such as Last9, New Relic, along with other observability solutions and application performance monitoring (APM) tools.
Logs, Metrics, Traces and Events are also commonly knows as MELT.
But what they really are? When should we use which data type, what are their strengths and weaknesses? Which one helps the Site Reliability Engineers, and DevOps teams the most?
Telemetry Data for DevOps and SRE teams
There can be different use cases for telemetry data for DevOps teams and SRE teams to know the system behavior, and application performance, understand dependencies, and performance issues, and make sure customer experience is not affected. Telemetry data should answer most if not all the questions below.
- Is my system healthy?
- To not have downtime
- To be better prepared for the apocalypse
- To mitigate issues quickly
- To know about how the system is behaving
- To debug the root cause of an outage
- To trace a payment transaction failure across micro-services
- To co-relate an outage to a hardware failure
- To find anomalies and patterns of degradation
This can be further divided into two broad categories.
- Debug an incident or degradation
- Recover from an incident
Debugging an incident
Whenever an incident or failure is detected, a natural inclination is to find the root cause of the incident and debug it. However doing it in real time as the incident is underway can be counterproductive to the quality of the user experience. Debugging is best done as a post-factor activity once the incident is mitigated. Programmers and Developers need granular log data or traces to find out the root cause during the debugging process.
Recovering from an incident
The first priority when an incident happens should always be to following
- Understand the impact
- Communicate to relevant stakeholders
- Mitigate or recover from a failure
Site Reliability Engineers(SREs hereafter) are the front line who deal with these 3 crucial actions in most organizations. The job titles may differ, but the function is essentially the same.
While recovering from a failure, too much granular data, without aggregation, can be counter-productive. There must be a way to understand system health without going into too much detail about system internals in real time, which can help troubleshoot and mitigate the incident. The human bandwidth is always limited and the Shannon limit comes into effect. So SREs need a way to understand system health in the fastest and cheapest way possible.
Three Pillars of Observability
There are three significant types of telemetry data in the observability of software systems: Metrics, Logs, and Traces. Each type serves a different purpose and provides unique insights into a system’s behavior.
Recently, the M.E.L.T. acronym has been extended to T.E.M.L.E. which covers Exceptions and Profiling apart from Metrics, Logs, Traces and Events. But this post only focuses on introducing M.E.L.T.
We will also discuss Events additionally as the fourth pillar of observability. Together the three pillars of observability and Events are also called as M.E.L.T. for Metrics, Events, Logs and Traces.
We will follow the order of Logs, Metrics, Traces and then Events in the order of understanding to make it easy to cover important aspects related to Telemetry in incremental order of abstraction as well as complexity.
Logs
Logs are descriptive documents of how the system behaves at a time. Logs are the easiest to start with, as they can be anything. A simple print statement such as Hello, I reached here can help in debugging a lot at times :)
There can be structured logs as well as follows:
{"level":"info","msg":"Something noteworthy happened!","time":"2019-12-09T16:18:21+01:00"}{"level":"warning","msg":"You should probably take a look at this.","time":"2019-12-09T16:18:21+01:00"}{"level":"error","msg":"Something failed but I'm not quitting.","time":"2019-12-09T16:18:21+01:00"}Different languages, frameworks, and tools have their own logging formats. This makes logs harder to standardize across tools, services, and teams. Logs are best used for debugging and are one of the best friends of software developers as they can pinpoint the exact line which is the culprit during troubleshooting. Observability and Monitoring tools such as Splunk, Papertrail provide solutions for logging.
But logs can proliferate very quickly; horror stories of logs quota depleting because a third-party service changed its response are not unheard of. With the advent of Kubernetes, cloud-native environments, modern applications and distributed system architecture of microservices environment, the log data can explode at times as it corresponds to external events such as traffic, number of requests, number of jobs, and even the number of failures.
Without aggregates, logs are of little use in understanding system health. Many logging tools, such as Papertrail, can aggregate logs and ask questions based on the aggregated data instead of raw log data.
Consider two options:
- Look at all logs by squinting your eyes and spot all HTTP 429 errors.
- Find out the rate of HTTP 429 errors in the last 12 hours. If it exceeds a specific threshold, dig deeper.
The second option will be preferable to understand system health without the need to go through all the log data.
So, to recap Logs:
- Descriptive documents of what the system is doing.
- Hard to standardize across tools, services, and teams.
- Excellent for debugging and root cause analysis.
- Only extract insights if you know what to search for.
- Aggregation can reveal system health trends.
- It can explode in volume due to external events as well.
Metrics
Metrics are quantifiable measurements of the health of a system. They are the fastest and cheapest way to understand the system’s health. They are aggregated data, giving a bird’s eye view of the system’s performance. Metrics can tell us the availability of a service, the free CPU % of an EC2 instance, the cache hit rate of a Redis database, or the latency of an API endpoint.
Did you encounter the recent SVB crisis that caused panic in the startup industry for a few days? Well, the issue was resolved, but how did the US authorities come to know about it? Using some key indicators that they were observing that started deteriorating. They fixed the issue over the weekend and continued to root cause it over the next few days and weeks. The first priority was to mitigate, then the root cause analysis.
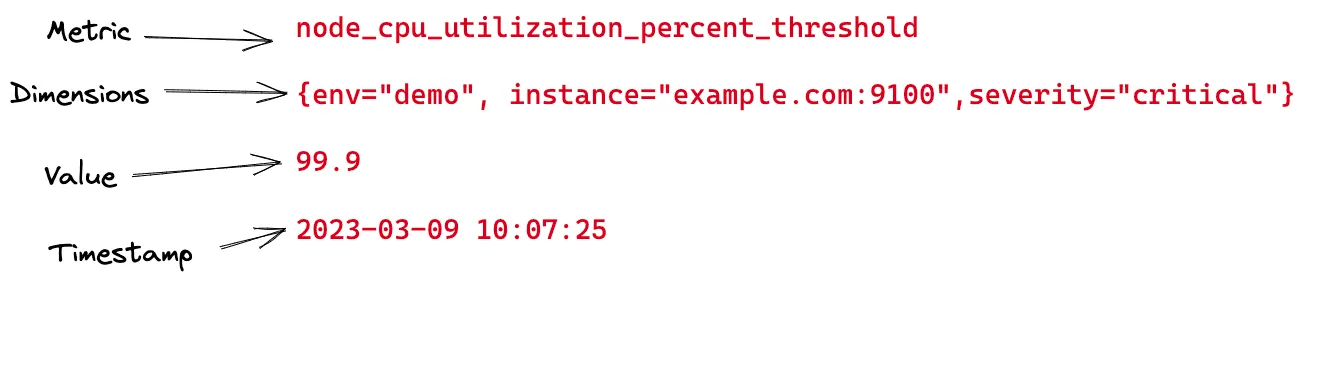
They are essentially values that are aggregated over time with dimensions attached to every data point. Metrics are scalars, without directionality added to them. Because metrics lack directionality, they lack relationships between different components and services.
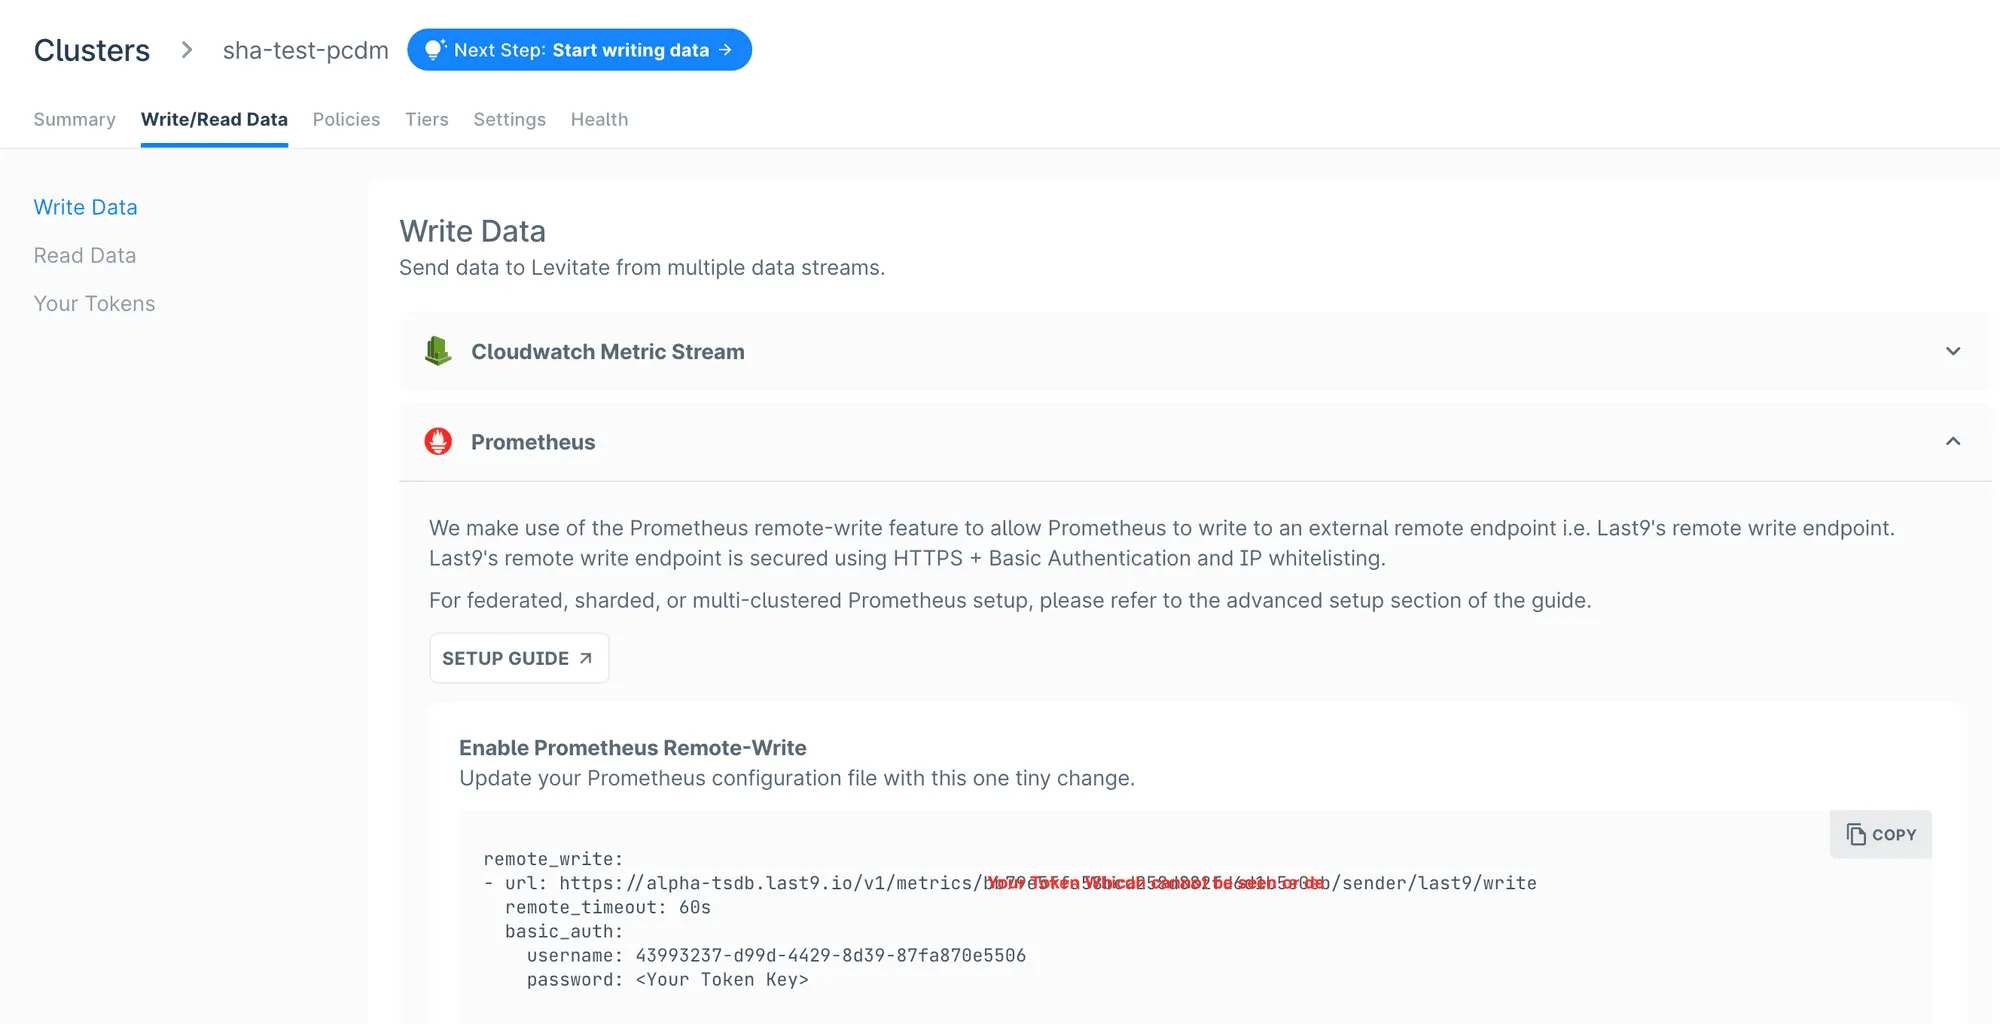
Prometheus is the most popular open source monitoring tool that supports metrics. There are many other commercial and open source time series databases.


When you have a lot of metrics, you need a further narrower view to focus only on key metrics which lead to SLIs and KPIs.
Due to the aggregated nature of Metrics, they are prime candidates for finding anomalies and patterns.
To recap Metrics:
- Scalar values with dimensions and timestamps.
- Easy to standardize.
- Excellent for understanding system health.
- Excellent to understand system health.
- It can explode in volume because of the huge number of unique combinations of dimensions, resulting in High Cardinality.
- Can derive insights via anomalies and patterns.
Traces
A trace is the complete journey of a request or workflow as it moves from one part of the system to another. It is achieved by adding a standard trace id as the request/action flows through all the hops. Each time the context is forwarded to the next execution hop, a shared trace id is passed around, which helps connect the dots. This process is also called Distributed Tracing.
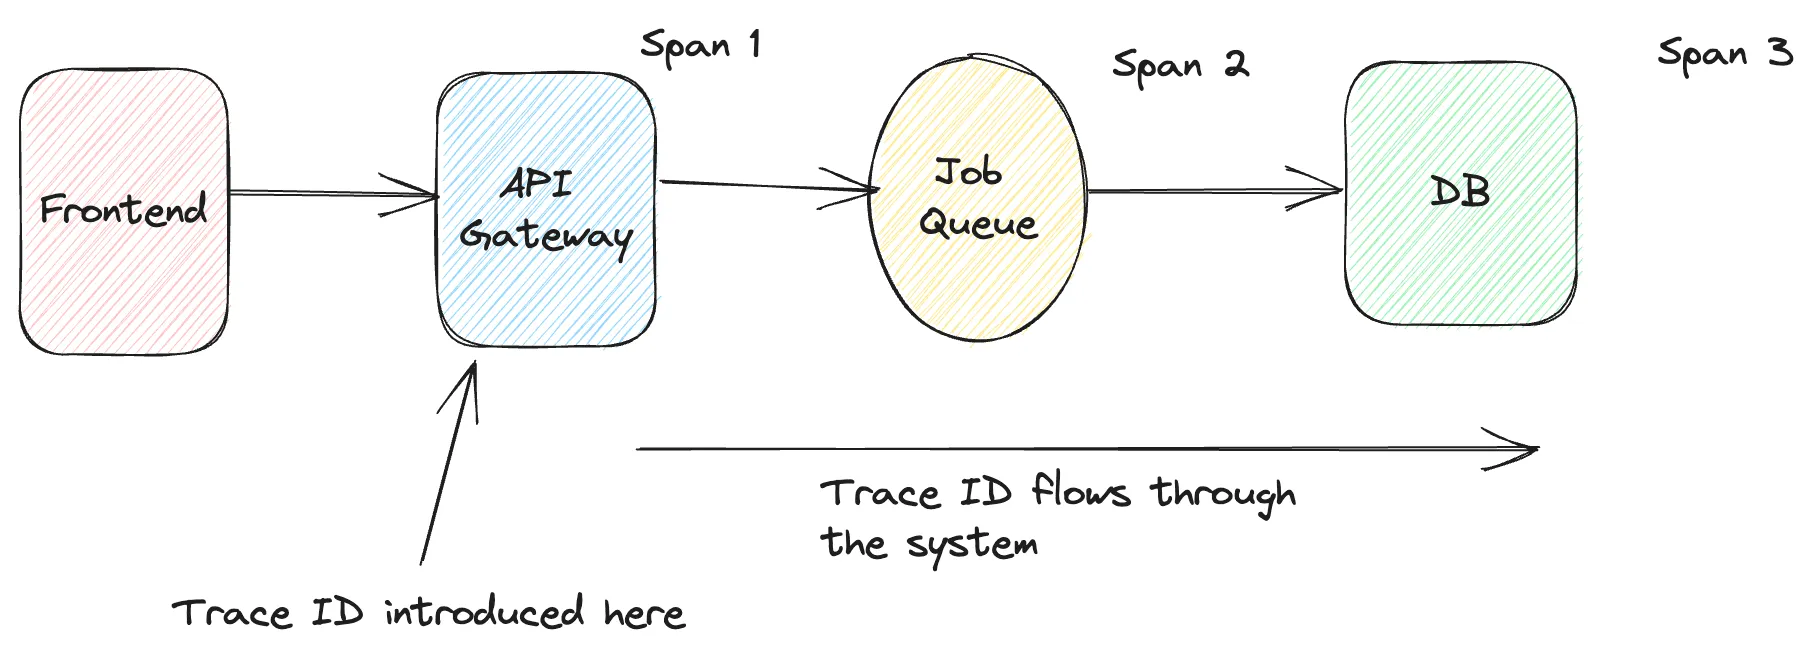
Trace data is made up of spans. A span is a single unit of work in a distributed system and a primary building block of distributed tracing. A trace represents a user request or a transaction in distributed tracing. Traces are broken down into multiple spans. For example, a function call to authenticate a user during a request can be represented by a span.
Traces provide directionality and relationships between two data points. Each trace comprises multiple units of work, characterized by the API called, the time is taken, and the start and end dates of the API execution. Traces can be harder to adopt as all applications and teams may need to make changes, but they make debugging easier. They also do not help understand system health because of the sheer volume of traces and non-aggregated nature.
Traces are widely supported by Datadog, New Relic and lot of other platforms. OpenTelemetry makes it very easy to switch vendors keeping the instrumentation pipeline same.
Standard libraries such as OpenTelemetry client SDKs can help developers adopt distributed tracing as the libraries are drop-in changes for auto instrumentation of traces. Traces can be considered as structured logging as the trace structure is nothing but an agreed-upon contract by all parties on how the data should be.
Distributed Tracing can also run into challenges, read more about it below.
To recap Traces:
- Trace the workflow across services, components end to end.
- Excellent in debugging and root cause analysis.
- Not good in understanding system health at a high level.
- More work to adopt as all teams have to make changes to adopt tracing.
- Automatic standardization via client standard SDKs.
- Can explode in volume.
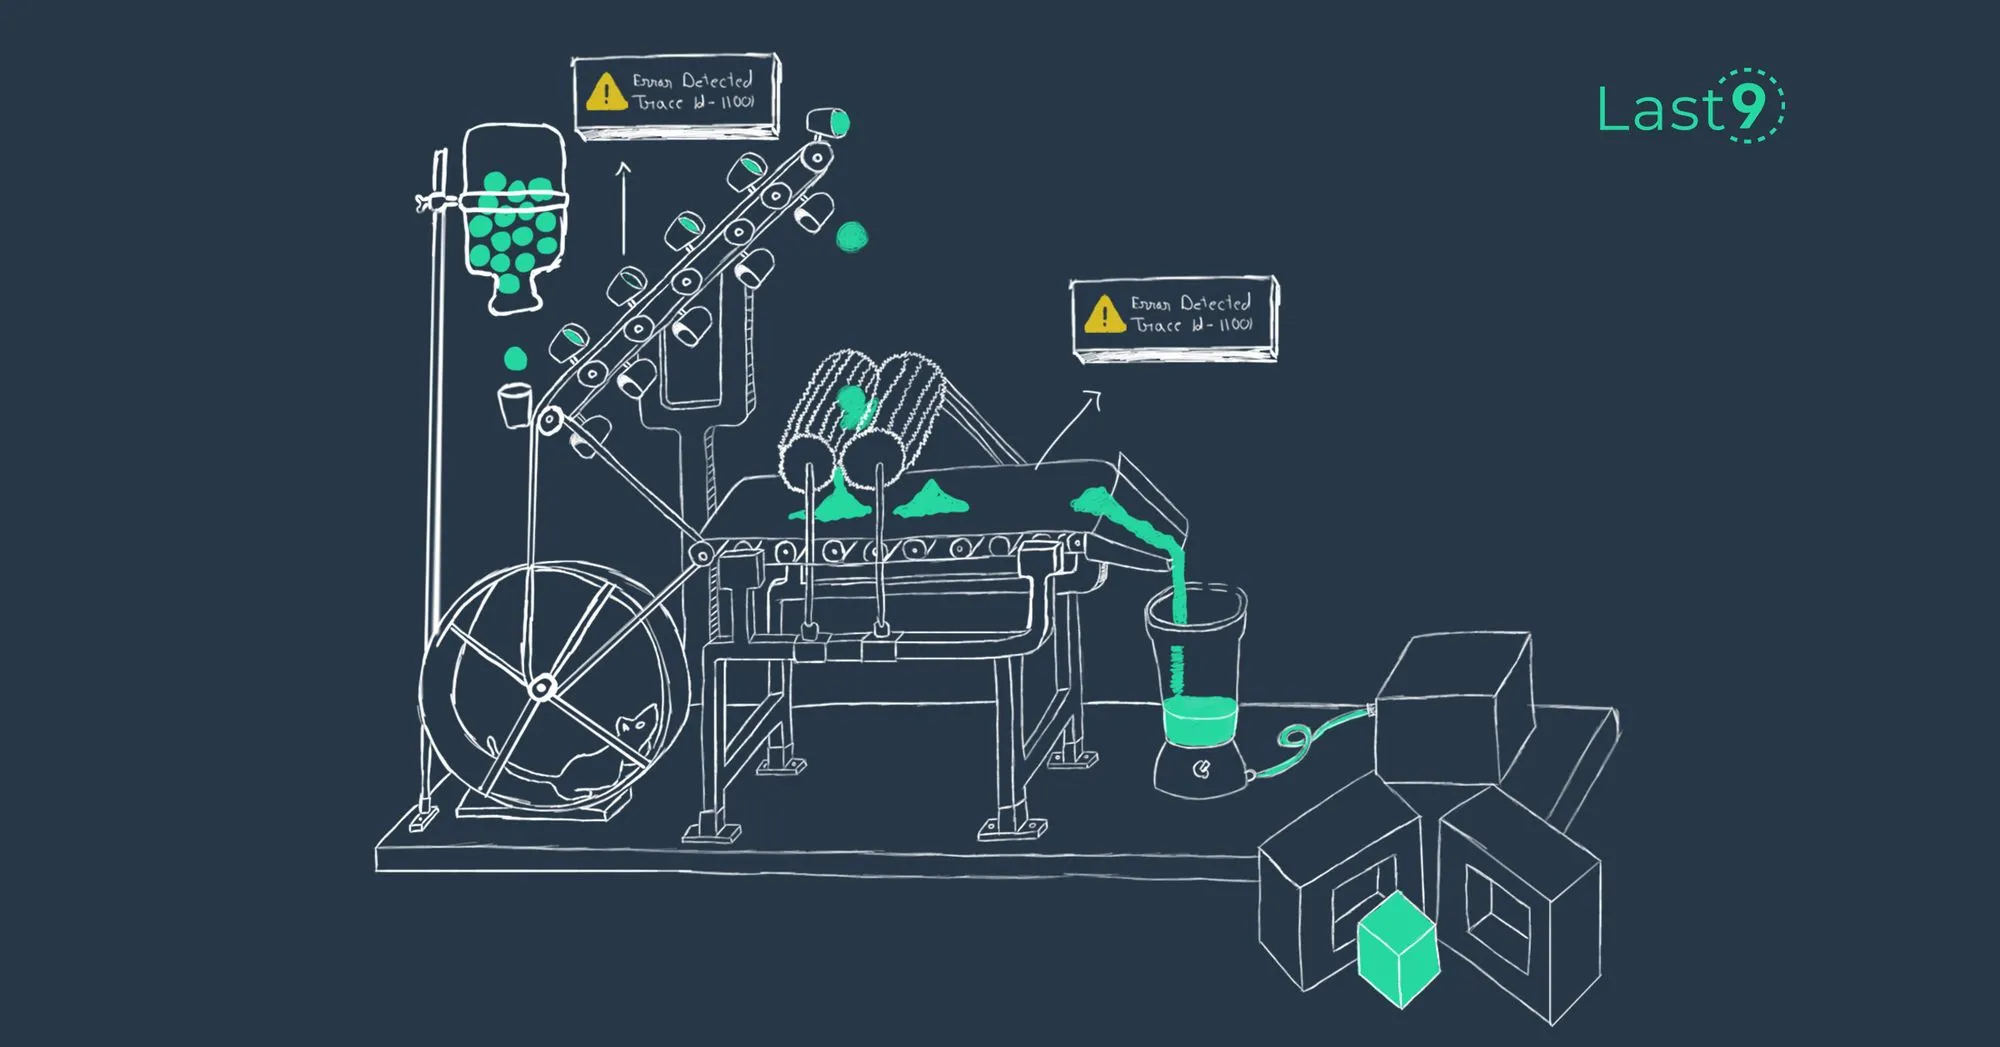
Events
Lastly, events! Events are hardest to define because everything is an event including event logs, deployments, user making a payment transaction and even Amazon AWS restarting an EC2 instance.
But let us give it a try 😉. An event is primarily a change event that can mean a pod restart, deployment, or configuration flag change. Events are important because they affect the system’s state externally and can help correlate incidents with metrics, traces, and logs.
There are two kinds of events I am interested in from the perspective of observability of software systems.
- They happen over time, and their performance, like frequency, presence, or absence, is fascinating. Example: Average hourly take-offs from the San Francisco Airport in the last week.
- The event and its data are of interest. Example: When was the last time Arsenal won in EPL?
The first example is asking questions based on specific aggregations performed on raw events, the individual events may not be necessary, but their aggregations and insights captured using them are relevant for business. The second example gives insights based on the event data.
Events can have specific structure such as following JSON schema.
{ "event": "user_created", "properties": { "server": "ip_address", "environment": "staging" }}Events can also be external such as third party system responses, statuses and even deployments. Such events are generally less in number but need precision capturing. An example of such use case is payment transaction. You can afford losing a fraction of logs but can’t lose out on the event of a customer performing a payment transaction.
Last9’s managed time series warehouse - Levitate supports ingesting real time Events and converting them to Metrics for visulization and alerting. Read more about it below.

Comparing MELT
| Logs | Metrics | Traces | Events |
|---|---|---|---|
| Debugging | Monitoring system health | Debugging | Debugging & Correlation of incidents |
| Granular | Aggregates | Granular; Structured logs | Depends |
| Structured and unstructured | Scalars, just values, no relationships | Vectors with a direction in terms of trace id | Structured with an event schema |
| Splunk, Papertrail | Prometheus, Levitate, InfluxDB | Honeycomb, New Relic, Datadog | Levitate, NewRelic, Datadog |
Conclusion
Metrics, Events, Logs, and Traces form the backbone of today’s observability and monitoring tools and are the key pillars of observability.
From the Observability perspective, understanding what data we can use for what purpose is extremely important. Because of too much noise, system health can be too hard to infer from logs and traces. Metrics are the fastest and cheapest way to identify system health and help SRE and DevOps teams get hold of the incident quickly.
Debugging doesn’t need to happen at the moment while the incident is occurring. It is best done post-incident activity. Compared to logs and traces, metrics can help understand system health in the fastest and cheapest way possible. Logs and Traces are best used for debugging. Understanding the differences between M.E.L.T. data types can help us get the best value from the observability data.

