

You know that pause before opening your monitoring dashboard, when you’re hoping nothing’s broken but a part of you knows something probably is.
Performance issues start quietly: a few slow endpoints, a checkout that takes longer than usual, a graph that looks a little off. Before long, those small signals turn into alerts and support tickets.
This post covers web application performance monitoring from a developer’s point of view: what it actually covers, why distributed systems make it tricky, and the top 9 tools worth considering for your team.
What Is Application Performance Monitoring (APM)?
Application Performance Monitoring (APM) helps you understand how your application behaves in production. It collects data from requests, dependencies, and infrastructure to measure things like latency, throughput, and error rates.
A good APM setup looks at three main signals:
Metrics: Numbers that show performance over time: request counts, CPU or memory use, queue length, and response times.
Traces: The full journey of a request as it moves through different services, APIs, databases, and queues. Tracing shows where delays or errors appear.
Logs: Detailed event data linked to metrics and traces, helping you see what actually happened when something failed.
Instrumentation libraries or OpenTelemetry SDKs collect this telemetry and send it to a backend for analysis. From there, you can see how a request behaves, where latency starts, or which dependency is slowing things down.
Why APM Matters for Web Applications
Modern web applications are made up of many moving parts: services, containers, APIs, and queues, each scaling on its own. When something slows down, finding the cause is hard without full visibility. APM connects these components and shows how a single request travels through them.
Business continuity: Track key performance indicators like latency and error rates in real time to stay within your SLAs.
User experience: Watch p95 and p99 latency, error budgets, and availability metrics to understand how users experience your app.
Early detection: Detect performance regressions or error spikes as they appear, not after users start reporting issues.
Developer visibility: Follow traces down to the method, API call, or query that causes slowness.
Operational awareness: Correlate metrics with deployments, scaling events, or configuration changes to confirm what triggered a performance shift.
Resource efficiency: Connect performance data to resource usage to balance reliability, cost, and scaling needs.
APM gives you the feedback loop to understand how your system behaves in production, and the data to keep it reliable as it grows.
Key Features to Look for in an APM Tool
When you evaluate an APM tool, focus on how well it helps you see what’s happening in production, not just how many metrics it collects. A good APM setup turns telemetry into context: it helps you trace issues, validate fixes, and improve reliability over time.
Real-Time Monitoring
Performance shifts quickly. A new deploy, a burst in traffic, or a failed cache can alter behavior in seconds. Real-time monitoring keeps you aware of those changes as they happen.
A reliable tool should continuously collect key system metrics like CPU, memory, database latency, and request throughput. You should be able to build dashboards that highlight what matters most, such as latency percentiles, error rates, or throughput by service, and use anomaly detection to spot deviations early. Real-time feedback helps you validate performance after deployments and catch regressions before they spread.
Distributed Tracing
In distributed systems, a single request moves across multiple services, queues, and databases. Tracing captures this flow end-to-end so you can see where time is spent and where bottlenecks form.
An effective APM tool records spans across services, measures latency at each hop, and maps dependencies between components. Service maps generated from trace data make it easier to visualize relationships, track regressions, and understand how one slow service affects another.
Root Cause Analysis
Metrics tell you that something is wrong; tracing and logs explain why. Root cause analysis (RCA) connects these signals to show what changed, where, and how it impacted performance.
Look for features that give you:
- Code-level visibility into slow transactions or failed queries.
- Automatic error tracking with stack traces and parameters.
- Correlation between anomalies and recent changes in configuration, deployment, or scaling.
Strong RCA capabilities shorten the time between detection and resolution, which matters most during active incidents.
User Experience Monitoring
Backend metrics don’t always reflect what users feel. User Experience Monitoring (UEM) captures performance from the client side: how long pages take to load, how often errors appear, and how consistent the experience is across devices or geographies.
Tools that include Real User Monitoring (RUM) and synthetic tests help you see both real behavior and controlled simulations. Features like session replay can also highlight where users encounter friction that backend metrics alone might miss.
Alerting and Reporting
An APM tool is most valuable when it helps you act quickly. Alerts should provide enough context to explain what’s happening and why.
You should be able to set thresholds for latency or error rates and receive alerts through your preferred channels (Slack, PagerDuty, or email), complete with affected services, trace links, and deployment data. Reporting features that summarize SLA trends over time make it easier to spot recurring issues and justify reliability improvements.
Scalability and Integration
Your observability stack should grow with your system. An APM platform must handle higher data volumes and service counts without losing query performance.
Native integrations with Kubernetes, CI/CD pipelines, and logging systems reduce manual setup. Support for open standards like OpenTelemetry keeps your data portable, so you can evolve your tooling as your architecture changes.
Top 9 Web Application Performance Monitoring Tools for 2026
APM tools keep changing as architectures grow more distributed. The options below cover the range of choices for today’s web applications.
Here’s an at-a-glance comparison of the nine tools before the detailed breakdown:
| Tool | Open source? | Best for | Deployment |
|---|---|---|---|
| Last9 | No (SaaS) | High-cardinality telemetry at scale, unified RUM and APM without sampling | SaaS |
| Elastic APM | Yes | Teams already on the Elastic Stack that want full control over data | Self-hosted (or managed Elastic Cloud) |
| Sentry | No (SaaS, open-core) | Code-level error tracking and debugging in the release workflow | SaaS (self-hosted option available) |
| Instana | No (SaaS) | Automated discovery for containerized and Kubernetes environments | SaaS (self-hosted option available) |
| Prometheus & Grafana | Yes | DevOps and SRE teams that want to own their metrics stack | Self-hosted (or managed cloud) |
| AppDynamics | No (SaaS) | Large enterprises linking performance to business transactions | SaaS (self-hosted option available) |
| Azure Application Insights | No (SaaS) | Teams running workloads on Azure that want native integration | SaaS |
| New Relic | No (SaaS) | Full-stack observability with broad language coverage | SaaS |
| Datadog APM | No (SaaS) | All-in-one observability with a large integration library | SaaS |
For .NET and ASP.NET applications, Azure Application Insights is the native choice, especially if you already run on Azure. Elastic APM, New Relic, Datadog APM, and AppDynamics all ship .NET agents with code-level instrumentation, and OpenTelemetry-based setups (including Last9) support .NET through the OpenTelemetry .NET SDK and auto-instrumentation. Your best fit depends on whether you want a managed agent or an open, vendor-neutral pipeline.
1) Last9
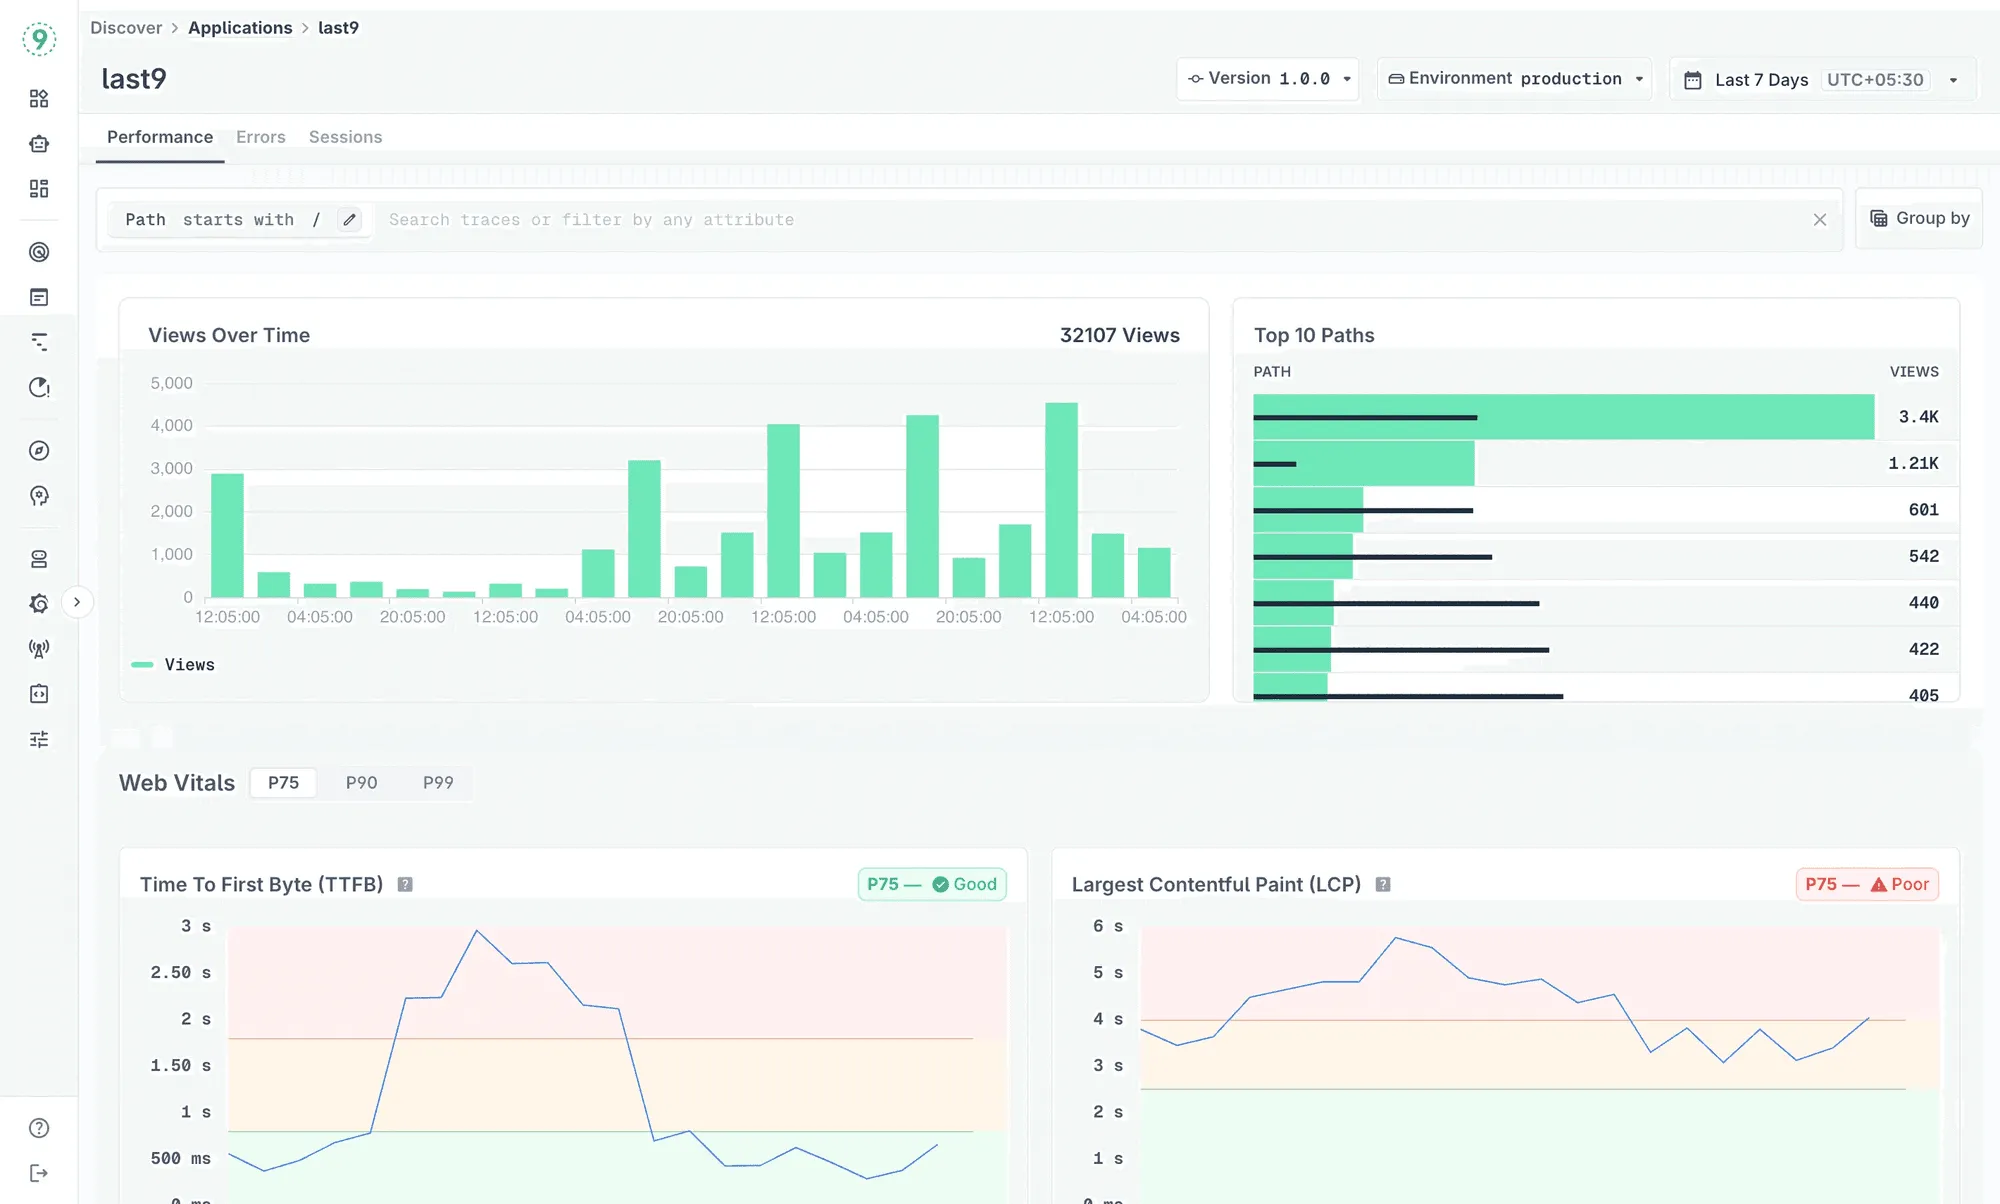
Our Discover suite brings frontend and backend observability into one connected workflow, so you can see how your applications behave in production, from real user sessions to service-level performance.
What you get
Discover → Applications (RUM): Monitor real user sessions across browsers, devices, and networks. Track Core Web Vitals (TTFB, FCP, LCP, CLS, and INP) along with JavaScript errors and session data to understand how users actually experience your app.
Discover → Services (APM): View your services’ throughput, latency, error rates, and dependencies. Inspect operations, outgoing calls, DB/cache usage, logs, and traces in one place.
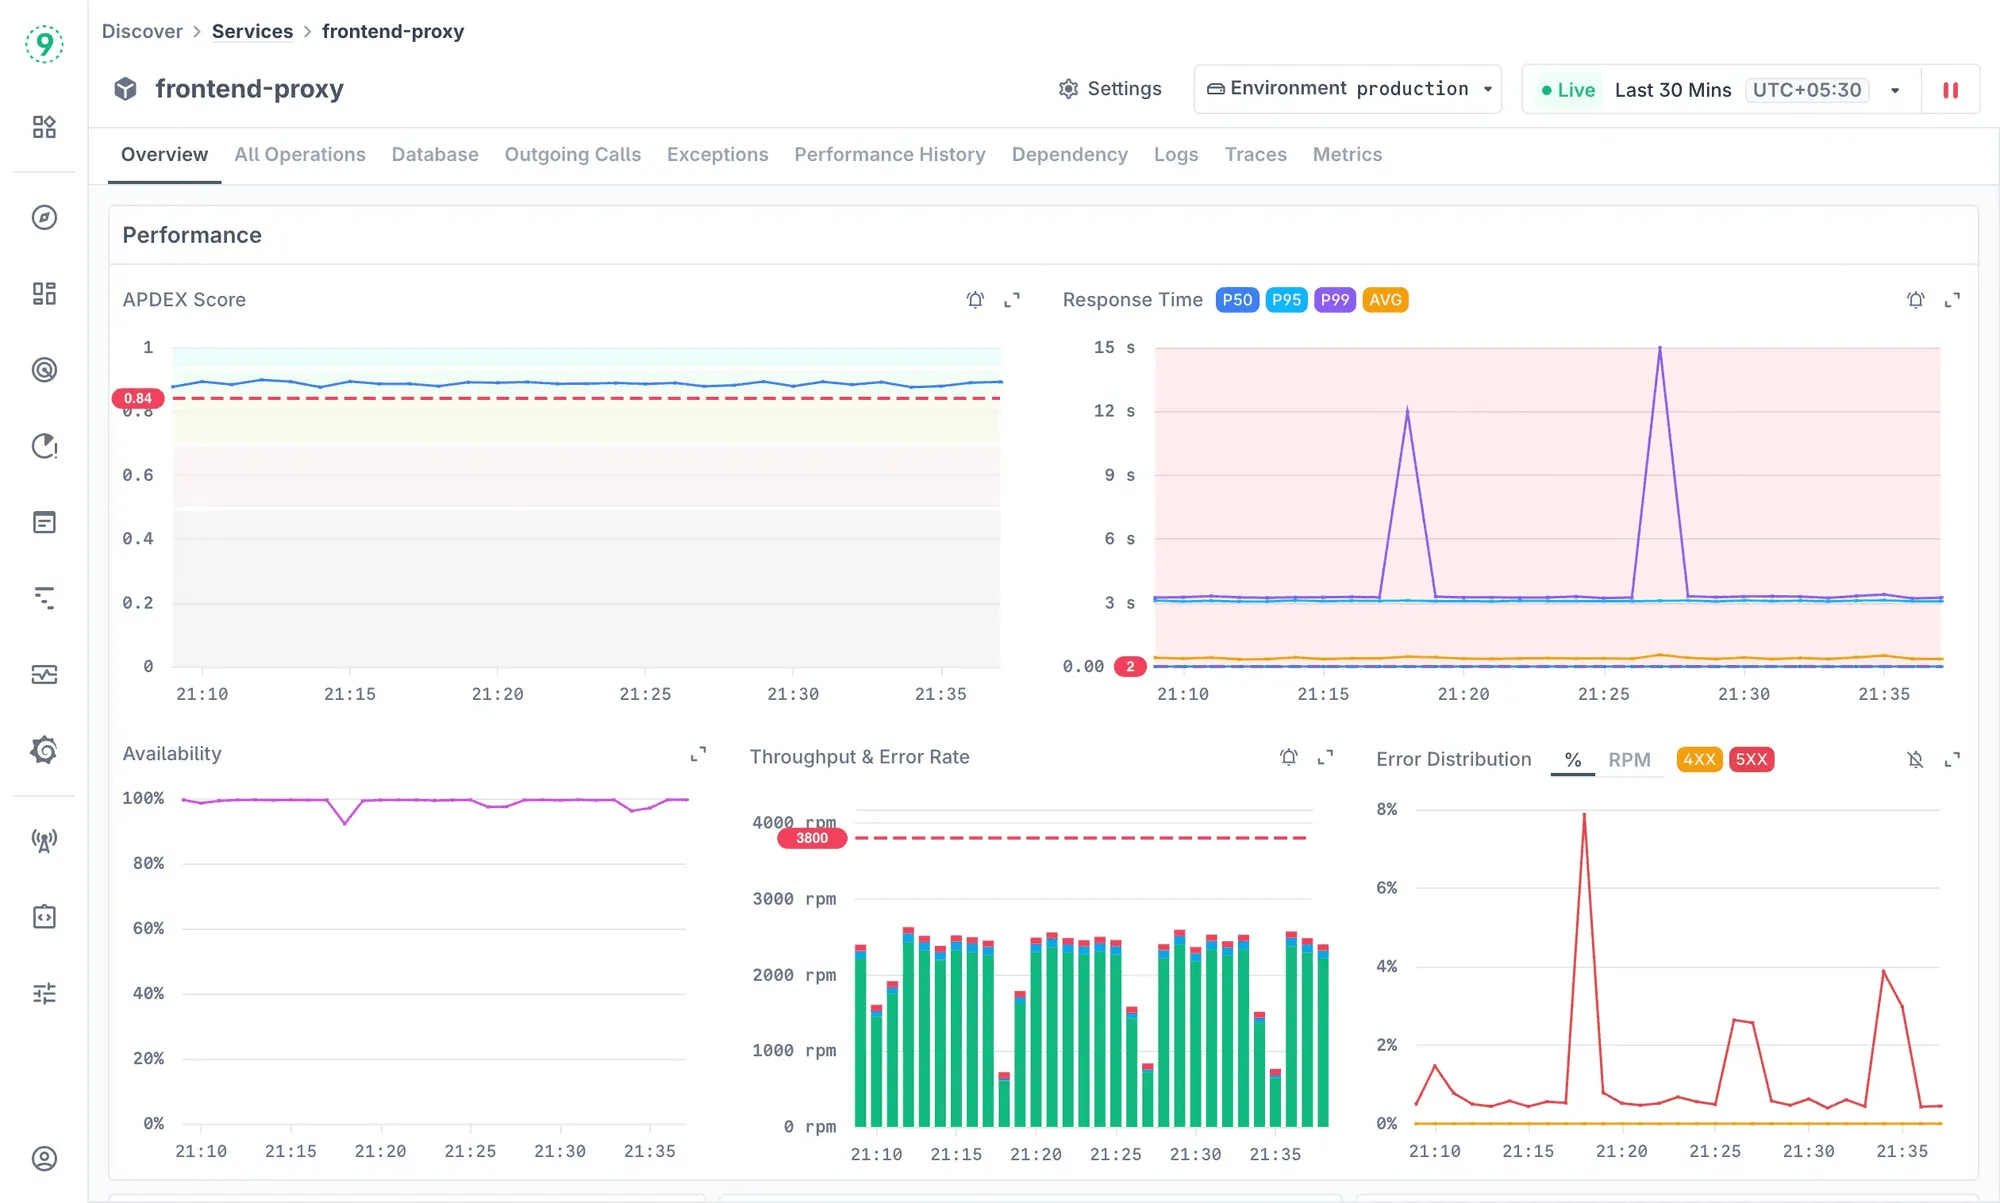
Auto-discovery and correlation: Last9 detects services, jobs, and hosts, then correlates traces, logs, and metrics so you can move from a slow transaction to the exact trace or log in one click.
High cardinality and scale built in: We handle high telemetry volumes without sampling, so you keep full-fidelity data for filtering, segmenting, and troubleshooting.
Why you’ll find it useful
You get real user context from Applications and service context from Services, unified into one view. That lets you connect a frontend signal to its backend cause without switching tools, and keep that visibility as your data and complexity grow.
Ideal for you if:
You’re running a distributed or cloud-native setup and want to connect frontend experience with backend reliability without losing precision as data volume increases.
2) Elastic APM
Elastic APM is an open-source performance monitoring solution built on the Elastic Stack: Elasticsearch, Kibana, Beats, and Logstash. If you already use Elasticsearch for logs or metrics, adding APM completes the picture with transaction traces and service performance data.
With Elastic APM, you track response times, errors, and throughput across your applications and analyze everything in Kibana. Because the data lives in Elasticsearch, you can run custom queries, build dashboards, and correlate APM data with logs and infrastructure metrics in one place.
What you get
- Open source and flexible: You control deployment, configuration, and data retention, which suits teams running their own stack.
- Integrated observability: APM, logs, and infrastructure metrics live in the same platform, giving you a single source of truth.
- Search and analytics: Elasticsearch queries across large datasets quickly, so it’s easy to identify slow endpoints or error spikes.
- Broad language support: Agents exist for major languages and frameworks, including Java, Python, Node.js, Go, and .NET.
Why you’ll find it useful
You can run everything on your own infrastructure, customize it, and connect APM data with logs and traces without switching tools.
Ideal for you if:
You already use the Elastic Stack and want to extend it into APM, or you prefer open-source tooling with full control over your data and queries.
3) Sentry
Sentry focuses on monitoring, debugging, and improving your application code. It’s best known for real-time error tracking, but it also includes distributed tracing and performance monitoring, giving you visibility from exception to slow transaction, down to the exact line of code.
Sentry fits into your development workflow. You see errors tied to commits, releases, and users, then jump straight to context-rich stack traces without switching tools.
What you get
- Fast error tracking: Capture, group, and triage exceptions with detailed stack traces, user context, and release metadata.
- Code-level performance visibility: Trace requests through your application to find slow endpoints, functions, or database calls.
- Developer-first workflow: Integrates with GitHub, GitLab, Jira, and other dev tools, so debugging fits into your release process.
- Session replay: Watch user sessions to understand what led to an error or slowdown, which makes reproduction easier.
Why you’ll find it useful
You get code-level insight without setting up a heavy observability stack. Sentry speeds up debugging when you’re shipping frequently and need to see exactly what changed.
Ideal for you if:
You care most about pinpointing errors and bottlenecks in your code, and you want fast feedback loops between production issues and fixes.
4) Instana (IBM Instana)
Instana provides automated application performance monitoring built for containerized environments. It continuously discovers services, dependencies, and infrastructure components without manual setup, which suits dynamic Kubernetes and cloud-native architectures.
Once deployed, Instana maps your system in real time, capturing every service and interaction. You get full traces with one-second granularity and visibility into latency, throughput, and error rates.
What you get
- Automatic discovery and mapping: Instana detects applications, containers, and services as they come online, with no manual configuration.
- Context-rich tracing: Collects end-to-end traces across microservices with second-level detail.
- Root cause detection: Uses AI-driven correlation to identify the most likely cause of an incident automatically.
- Kubernetes-native observability: Monitors pods, nodes, and clusters with real-time metrics, so you can see how infrastructure changes affect performance.
Why you’ll find it useful
You spend less time configuring and more time understanding how your system behaves under load. The automation holds up even as your services scale or redeploy frequently.
Ideal for you if:
You manage microservices-based applications on Kubernetes and need continuous, automated visibility with minimal configuration.
5) Prometheus & Grafana
Prometheus and Grafana remain the default open-source combination for teams that want full control over their observability stack. Prometheus handles metrics collection, querying, and alerting; Grafana turns that data into real-time dashboards.
This pairing gives you visibility into your systems and the freedom to define exactly what you measure. It also expects you to handle setup, scaling, and integrations yourself.
What you get
- Open source and cost-efficient: You run the entire stack without licensing fees, which works well if you’re comfortable managing infrastructure.
- Customizable metrics and dashboards: Define your own instrumentation, build dashboards that match your mental model, and visualize data however you prefer.
- Large ecosystem: A wide range of exporters, dashboards, and integrations is maintained by an active developer community.
- Flexible alerting: Prometheus Alertmanager lets you define alert rules, route notifications, and manage silences.
Why you’ll find it useful
You own your monitoring setup end to end. For teams that prefer building their own stack, Prometheus and Grafana give you the most flexibility and transparency.
Ideal for you if:
You have a DevOps or SRE culture, prefer open-source tooling, and want full control over how metrics are collected, stored, and visualized.
6) AppDynamics (Cisco AppDynamics)
AppDynamics gives you visibility into every layer of your application, from code execution to business transactions. It’s designed for large, distributed systems where performance issues have a measurable business impact.
It tracks each transaction end-to-end, mapping dependencies across services, databases, and infrastructure. You can see which part of a request caused the slowdown and how that affects user experience or revenue.
What you get
- Business transaction monitoring: Maps and tracks key transactions across services, linking technical metrics to business outcomes.
- Enterprise scalability: Handles high-throughput systems without losing detail or trace continuity.
- Code-level diagnostics: Drill into function calls, queries, and dependencies to pinpoint bottlenecks.
- User experience visibility: Combine real user and synthetic monitoring to measure how users experience your app across regions and devices.
Why you’ll find it useful
You can connect performance metrics directly to business impact. AppDynamics moves you from “something’s slow” to “this specific transaction is affecting conversion.”
Ideal for you if:
You manage complex, mission-critical applications where uptime and user experience directly influence business results.
7) Azure Application Insights
If you build or host applications on Azure, Application Insights gives you performance visibility without adding another external service to manage. It integrates with Azure Monitor, providing telemetry for requests, dependencies, exceptions, page views, and custom events in one place.
You can instrument applications running on Azure, hybrid setups, or other cloud providers using its SDKs. Once data is flowing in, Application Insights tracks availability, latency, and usage patterns and detects anomalies.
What you get
- Native Azure integration: Works with Azure App Service, Functions, Kubernetes, and other Azure resources.
- Complete telemetry: Collects data on requests, dependencies, exceptions, and client-side activity.
- Smart detection: Uses built-in machine learning to flag performance regressions or unusual patterns.
- Developer-friendly instrumentation: SDKs for .NET, Java, Node.js, Python, and other languages give you code-level visibility with minimal setup.
Why you’ll find it useful
You can monitor end-to-end performance across your Azure resources without leaving the ecosystem. It’s built for teams who want to correlate performance, cost, and resource metrics inside one environment.
Ideal for you if:
You run most of your workloads on Azure and want a native APM solution that connects directly with your existing cloud services.
8) New Relic
New Relic gives you full-stack observability in one place. APM, infrastructure metrics, logs, and user experience monitoring all live under the same platform. You can see how your applications behave, how your infrastructure responds, and how users experience your product without switching tools or data sources.
Everything runs on a unified telemetry pipeline, so you can query across metrics, traces, and logs together. That speeds up correlation whether you’re debugging latency, investigating a deployment, or analyzing trends.
What you get
- Unified observability platform: Monitor applications, infrastructure, browser sessions, and mobile experiences in one interface.
- Broad language and framework coverage: Instrument code written in Java, .NET, Node.js, Python, Go, PHP, Ruby, and more.
- Flexible dashboards and analytics: Use the New Relic Query Language (NRQL) to build custom views, run ad-hoc analysis, and visualize key metrics.
- AI-assisted insights: Machine-learning anomaly detection and automated correlation help you find issues faster.
Why you’ll find it useful
You can view the entire lifecycle of a request, from user interaction to backend processing, without juggling multiple monitoring tools.
Ideal for you if:
You want a single observability platform that brings together APM, logs, infrastructure, and user monitoring, with strong analytics and broad language support.
9) Datadog APM
Datadog APM provides distributed tracing and performance monitoring inside the broader Datadog ecosystem, which also covers infrastructure, logs, network, and security monitoring. You can see how requests move across services, where latency builds up, and how application performance connects to the underlying infrastructure.
Integrations are extensive, from Kubernetes and AWS to databases and messaging systems. Everything streams into a single dashboard so you can explore dependencies and spot regressions in real time.
What you get
- Unified observability: Correlate APM traces with metrics, logs, and network data across the Datadog platform.
- Distributed tracing: Capture end-to-end traces that pinpoint slow services, failed calls, and unusual latency patterns.
- Customizable dashboards: Build dashboards for key metrics and visualize service dependencies through service maps.
- Large integration library: Connect to hundreds of technologies, frameworks, and cloud providers with minimal setup.
Why you’ll find it useful
You get visibility into your stack with minimal instrumentation effort, since most things connect through Datadog agents and integrations.
Ideal for you if:
You want an all-in-one observability platform that combines APM, logs, infrastructure, and network monitoring, and you value quick setup with broad ecosystem support.
How to Evaluate Web Application Performance Monitoring (APM) Tools
A structured evaluation shows how an APM tool behaves in production conditions, from data collection to query latency. Verify each of the following areas before adoption.
1. Instrumentation model
Review how telemetry is collected across your stack. Check support for OpenTelemetry SDKs, auto-instrumentation, and manual spans. Confirm that trace attributes, metric names, and tag conventions align with your internal schema.
2. Data ingestion and control
Inspect ingestion mechanisms such as OTLP, StatsD, or Prometheus remote write. Measure ingestion throughput, rate limits, and retry behavior under network pressure. Validate configuration options for sampling and batching at both the agent and collector levels.
3. Distributed tracing fidelity
Generate controlled traffic to verify trace continuity across services, queues, and async calls. Confirm that parent-child span relationships persist and latency measurements stay consistent. Evaluate the minimum time resolution and trace retention period for your workloads.
4. Query performance and scalability
Run large queries against high-cardinality datasets. Observe indexing behavior, storage compression, and query response times. Confirm that performance remains stable as the number of metrics, labels, and traces grows.
5. Integration surface
Check compatibility with your environment: Kubernetes, ECS, or serverless platforms. Evaluate APIs, SDKs, and webhook endpoints for automation and custom pipelines. Ensure data export paths exist for long-term storage or external analytics.
6. Alerting and correlation
Review how metrics, traces, and logs are correlated during incident analysis. Test alert rules, anomaly detection logic, and notification routing. Confirm that alerts include contextual metadata such as service name, environment, and deployment version.
7. Cost behavior and retention
Analyze the pricing model relative to data volume, host count, or transaction rate. Review how retention policies affect storage and retrieval speed. Ensure costs remain predictable under load spikes.
8. Security and compliance
Verify authentication, data encryption in transit and at rest, and access control mechanisms. Confirm compliance with organizational or regulatory requirements for telemetry storage and access.
9. Usability and workflow fit
Assess how engineers interact with the platform during on-call and debugging. Review dashboard ergonomics, API usability, and CLI support. Confirm that the tool integrates into your existing incident management and CI/CD workflows.
What Makes Last9 Different for Web Performance Monitoring
Web performance monitoring isn’t new. The hard part is how much data you can afford to keep without losing detail. Every major platform in this space (Datadog, New Relic, Dynatrace, AppDynamics, Splunk) promises full-stack correlation and visibility, and they all deliver, to a point.
But once your systems grow beyond a handful of services and labels, you hit the same wall: keep everything and pay heavily, or drop dimensions and lose context.
That’s where Last9 takes a different route.
Built for Precision, Priced for Scale
Every metric you collect tells part of the story: user_segment, region, device_type, feature_flag. These dimensions make debugging possible, but in most APM tools they’re also what make your bill unpredictable.
Last9 changes that equation. Our event-based model means you pay for what you ingest, not for how detailed your data is. Whether you track ten dimensions or fifty, the cost stays stable. The platform handles millions of active series per day without sampling or query lag.
Cardinality Without Compromise
When latency spikes on a checkout page, you shouldn’t have to guess whether it’s mobile users in us-east-1 or desktop sessions on an experimental feature.
With Last9, you query those exact combinations instantly, without losing context or waiting on batch processing. Our streaming aggregation engine processes telemetry as it arrives, keeping every label intact while shaping the data for fast queries.
You see the performance issue, trace it to the service behind it, and understand how it affects reliability. That mix of precision and speed turns raw telemetry into something you can act on.
Reliability as the Layer Above Performance
Every spike in a metric looks urgent until you see it in context. A 3.2s LCP is a different problem if your SLO target is 5s.
Most tools stop at the metric. Last9 connects it to SLOs, error budgets, and user impact. You can see how much reliability you’re burning with each regression and decide based on impact, not guesswork.
The Practical Advantage
Datadog and Dynatrace offer session replay and AI features. New Relic and Splunk give predictable pricing for smaller workloads. Those trade-offs make sense depending on your stage and priorities.
Last9 exists for teams who can’t afford to drop data, for systems where every label (user_id, region, browser, flag) carries meaning and precision drives reliability.
If you’re scaling web applications with complex telemetry, our strength is clarity. You keep every dimension and see your system as it actually behaves, without dropping data to keep the bill down.
Start exploring your telemetry without limits and see how Last9 handles scale in production.
FAQs
What is an APM monitoring tool?
An APM (Application Performance Monitoring) tool measures how your application behaves in production by collecting metrics, traces, and logs from requests, dependencies, and infrastructure. It tracks signals like latency, throughput, and error rates so you can spot regressions, trace slow requests across services, and find the root cause of performance issues. Most modern APM tools instrument your code with agents or OpenTelemetry SDKs and send that telemetry to a backend for analysis.
What are the best open source APM tools?
The most widely used open-source options are Elastic APM (built on the Elastic Stack) and Prometheus paired with Grafana for metrics and dashboards. For a vendor-neutral approach, OpenTelemetry provides open standards for collecting traces, metrics, and logs, which you can then send to a backend of your choice. These give you full control over deployment and data retention, at the cost of running and scaling the infrastructure yourself.
What are the best APM tools for .NET applications?
Azure Application Insights is the native choice for .NET and ASP.NET, particularly if your workloads already run on Azure. Elastic APM, New Relic, Datadog APM, and AppDynamics all provide .NET agents with code-level instrumentation. If you prefer an open, vendor-neutral pipeline, the OpenTelemetry .NET SDK (with auto-instrumentation) works with OpenTelemetry-based backends like Last9.
What is the best web application performance monitoring tool?
There is no single best tool: the right choice depends on your stack, scale, and budget. Teams on Azure often reach for Application Insights, teams that prefer open source lean on Elastic APM or Prometheus and Grafana, and teams wanting an all-in-one SaaS platform consider Datadog or New Relic. For workloads with high-cardinality telemetry where dropping data or sampling isn’t acceptable, Last9 focuses on keeping every dimension with predictable cost at scale.

